npm https://www.npmjs.com/package/echarts-liquidfill
github文档 https://github.com/ecomfe/echarts-liquidfill#readme
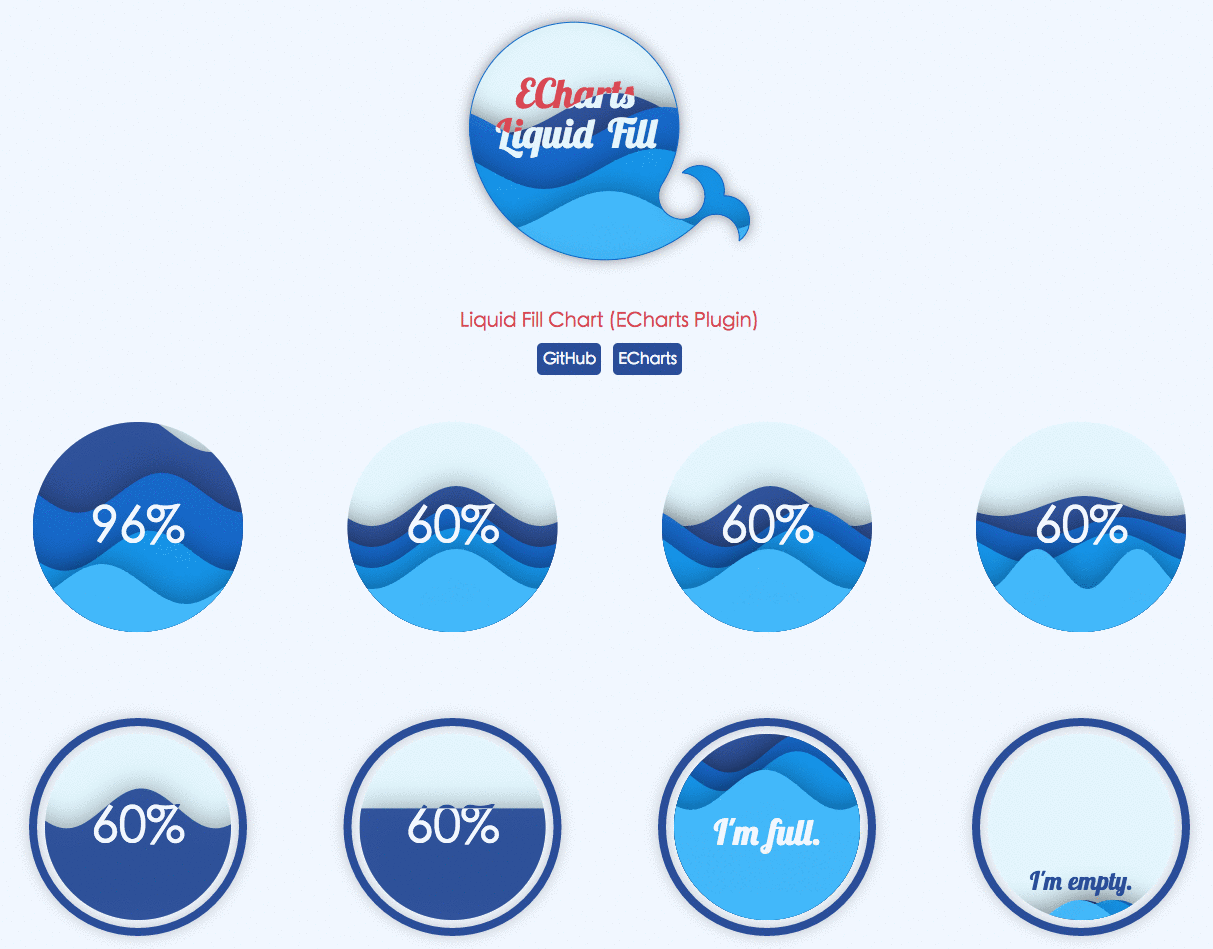
在线 demo https://ecomfe.github.io/echarts-liquidfill/example/
echarts 水球图案例
https://www.makeapie.com/explore.html#sort=rank~timeframe=all~query=liquidFill~author=all
https://www.makeapie.com/explore.html#tags=liquidFill~sort=rank~timeframe=all~author=all
yarn add echarts-liquidfillnpm install echartsnpm install echarts-liquidfill
水波纹效果
WaterWave 实现水位波浪动画,也就是波浪(或者水装在容器中)的侧面图
https://github.com/YingshanDeng/WaterWave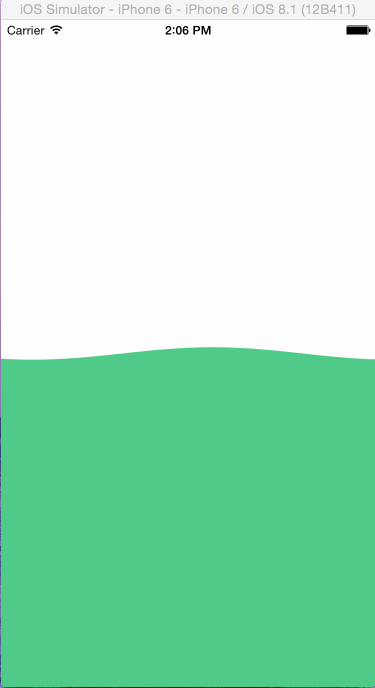
正弦函数 http://objcer.com/2015/02/19/WaterWave/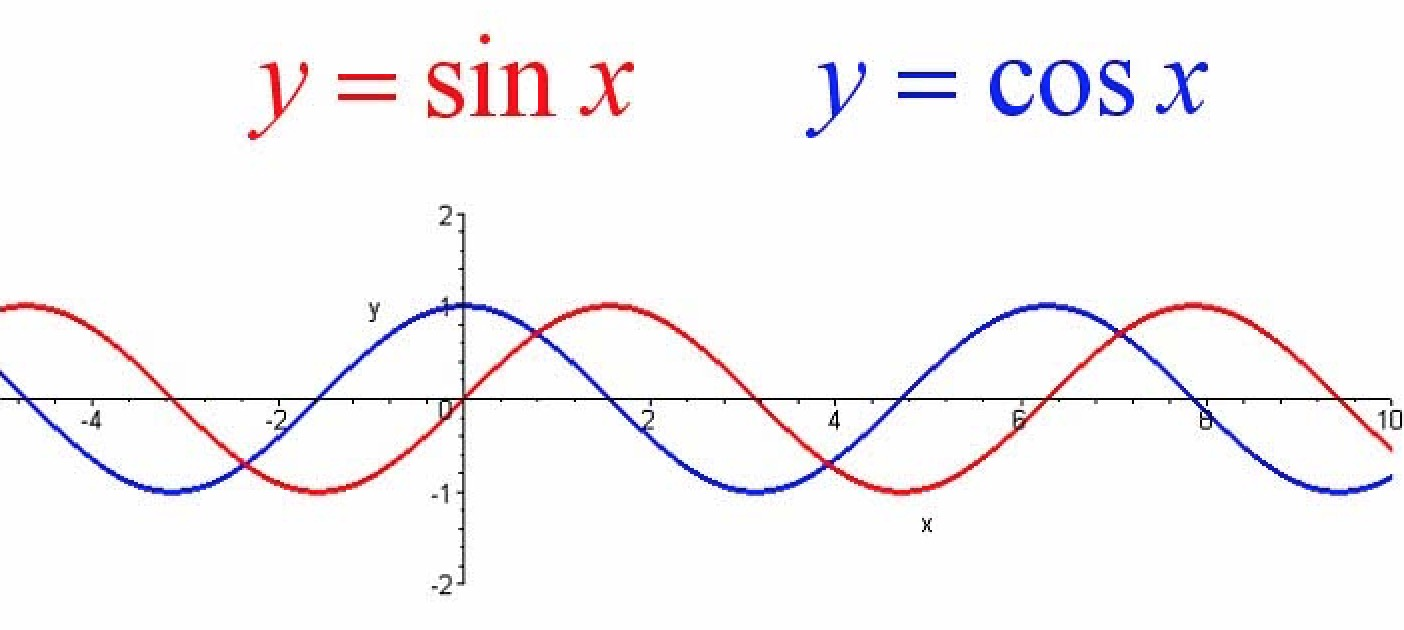
水球图原理
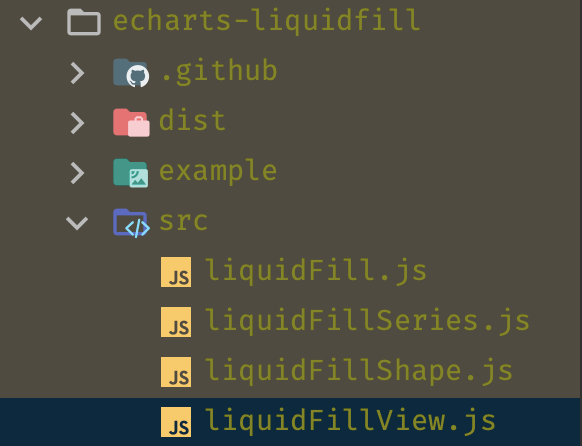
修改了echarts的 series
const echarts = require('echarts/lib/echarts');echarts.extendSeriesModel({type: 'series.liquidFill',visualColorAccessPath: 'textStyle.mormal.color',});
antv水波图
http://antv-2018.alipay.com/zh-cn/g2/3.x/demo/other/liquid-fill-gauge.html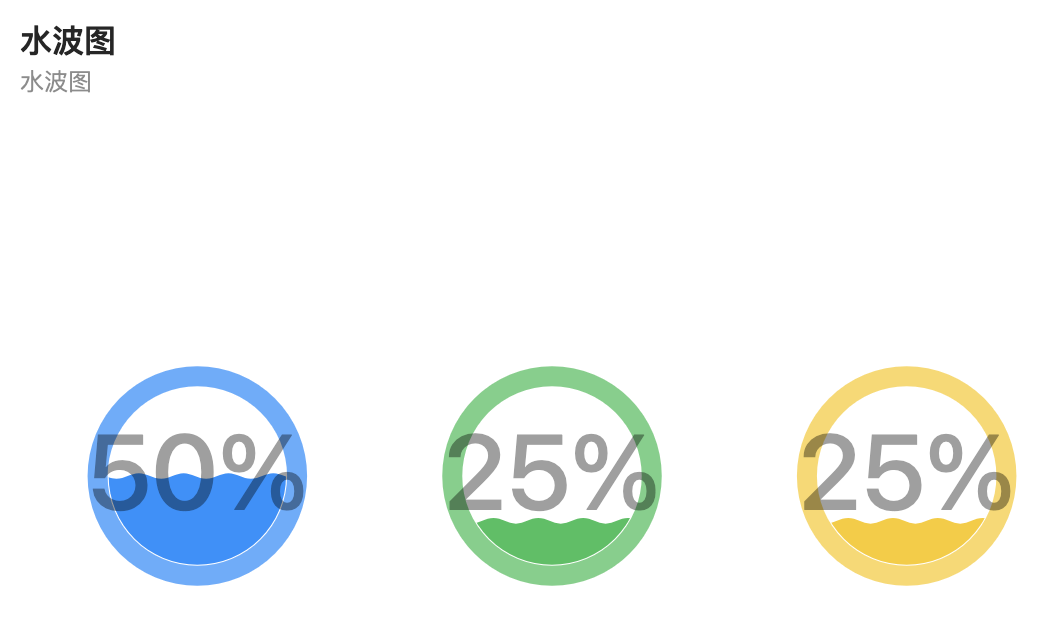
vue水球图

https://github.com/acdseen/waterWaves
yarn add waterwaves
use
import WaterWaves from 'waterwaves'Vue.use(WaterWaves)<WaterWaves v-model="level" /><canvas id="canvas" width="400px" height="400px"></canvas><script>var option={cW:130,cH:130,baseY:50,nowRange:0};var water=new WaterPolo('canvas',option);</script>
vue
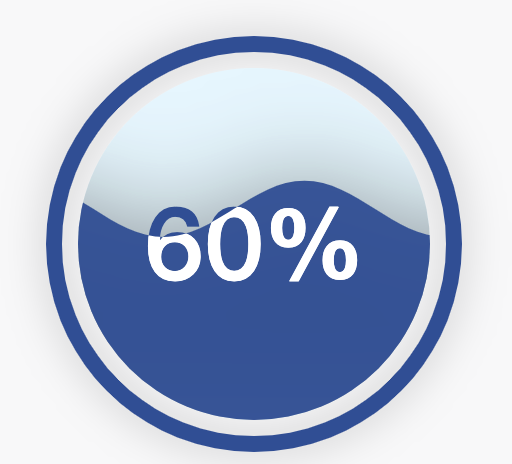
<template><div class="chart" ref="box"/></template><script>import * as echarts from 'echarts';import 'echarts-liquidfill';import {defineComponent, getCurrentInstance, onMounted,} from 'vue';function getOptions() {return [{type: 'liquidFill',data: [0.6],}];}export default defineComponent({setup() {onMounted(() => {const { ctx } = getCurrentInstance();const element = ctx.$refs.box;// 基于准备好的dom,初始化echarts实例const myChart = echarts.init(element);// 绘制图表myChart.setOption({series: getOptions(),});});}});</script><style scoped>.chart {height: 400px;}</style>
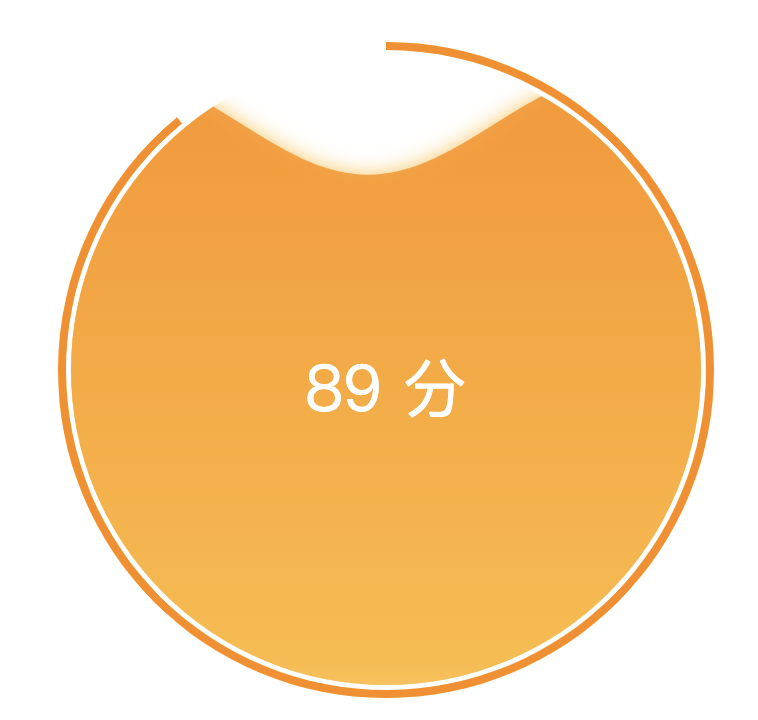
<template><div class="chart" ref="box"/></template><script>import * as echarts from 'echarts';import 'echarts-liquidfill';import {defineComponent, getCurrentInstance, onMounted,} from 'vue';function getOptions() {const max = 500; // 满刻度大小const score = 89;const scorePer = score / 100;const data = max * scorePer;return {backgroundColor: '#fff',title: {top: '47%',left: 'center',text: `${score} 分`,textStyle: {color: '#fff',fontStyle: 'normal',fontWeight: 'normal',fontSize: 32}},series: [{type: 'liquidFill',itemStyle: {opacity: 0.8, // 波浪的透明度shadowBlur: 10, // 波浪的阴影范围shadowColor: '#FFB931'// 阴影颜色},radius: '80%',// 水波color: [new echarts.graphic.LinearGradient(0, 0, 0, 1, [{offset: 0,color: '#FE8704'},{offset: 1,color: '#FFB931'}])],data: [{value: scorePer,}],center: ['50%', '50%'],backgroundStyle: {color: '#fff'},label: {normal: {formatter: '',textStyle: {fontSize: 12}}},outline: {itemStyle: {borderColor: 'transparent',borderWidth: 5},borderDistance: 0}},{color: ['#FF8B00', 'transparent'], // 外环线type: 'pie',center: ['50%', '50%'],radius: ['80%', '82%'],hoverAnimation: false,data: [{name: '',value: data,label: {show: false,position: 'center',color: '#fff',fontSize: 38,fontWeight: 'bold',formatter () {return data;}}},{ // 画剩余的刻度圆环name: '',value: max - data,label: {show: false},labelLine: {show: false}}]}]};}export default defineComponent({setup() {onMounted(() => {const { ctx } = getCurrentInstance();const element = ctx.$refs.box;console.log('ctx', element);// 基于准备好的dom,初始化echarts实例const myChart = echarts.init(element);// 绘制图表myChart.setOption(getOptions());});}});</script><style scoped>.chart {height: 400px;}</style>

若有收获,就点个赞吧
0 人点赞
