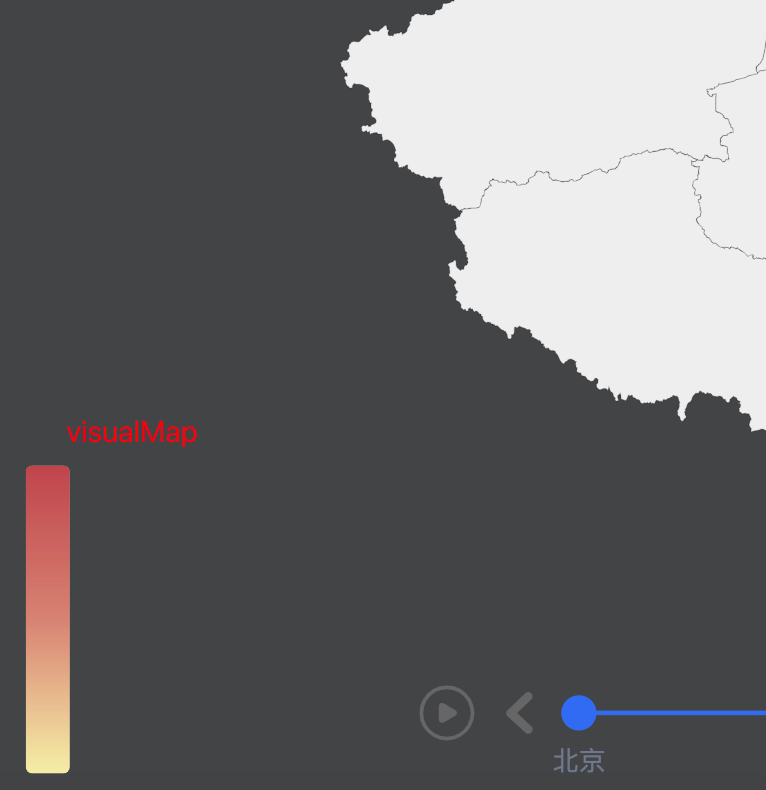
连续视觉映射
https://echarts.apache.org/zh/option.html#visualMap
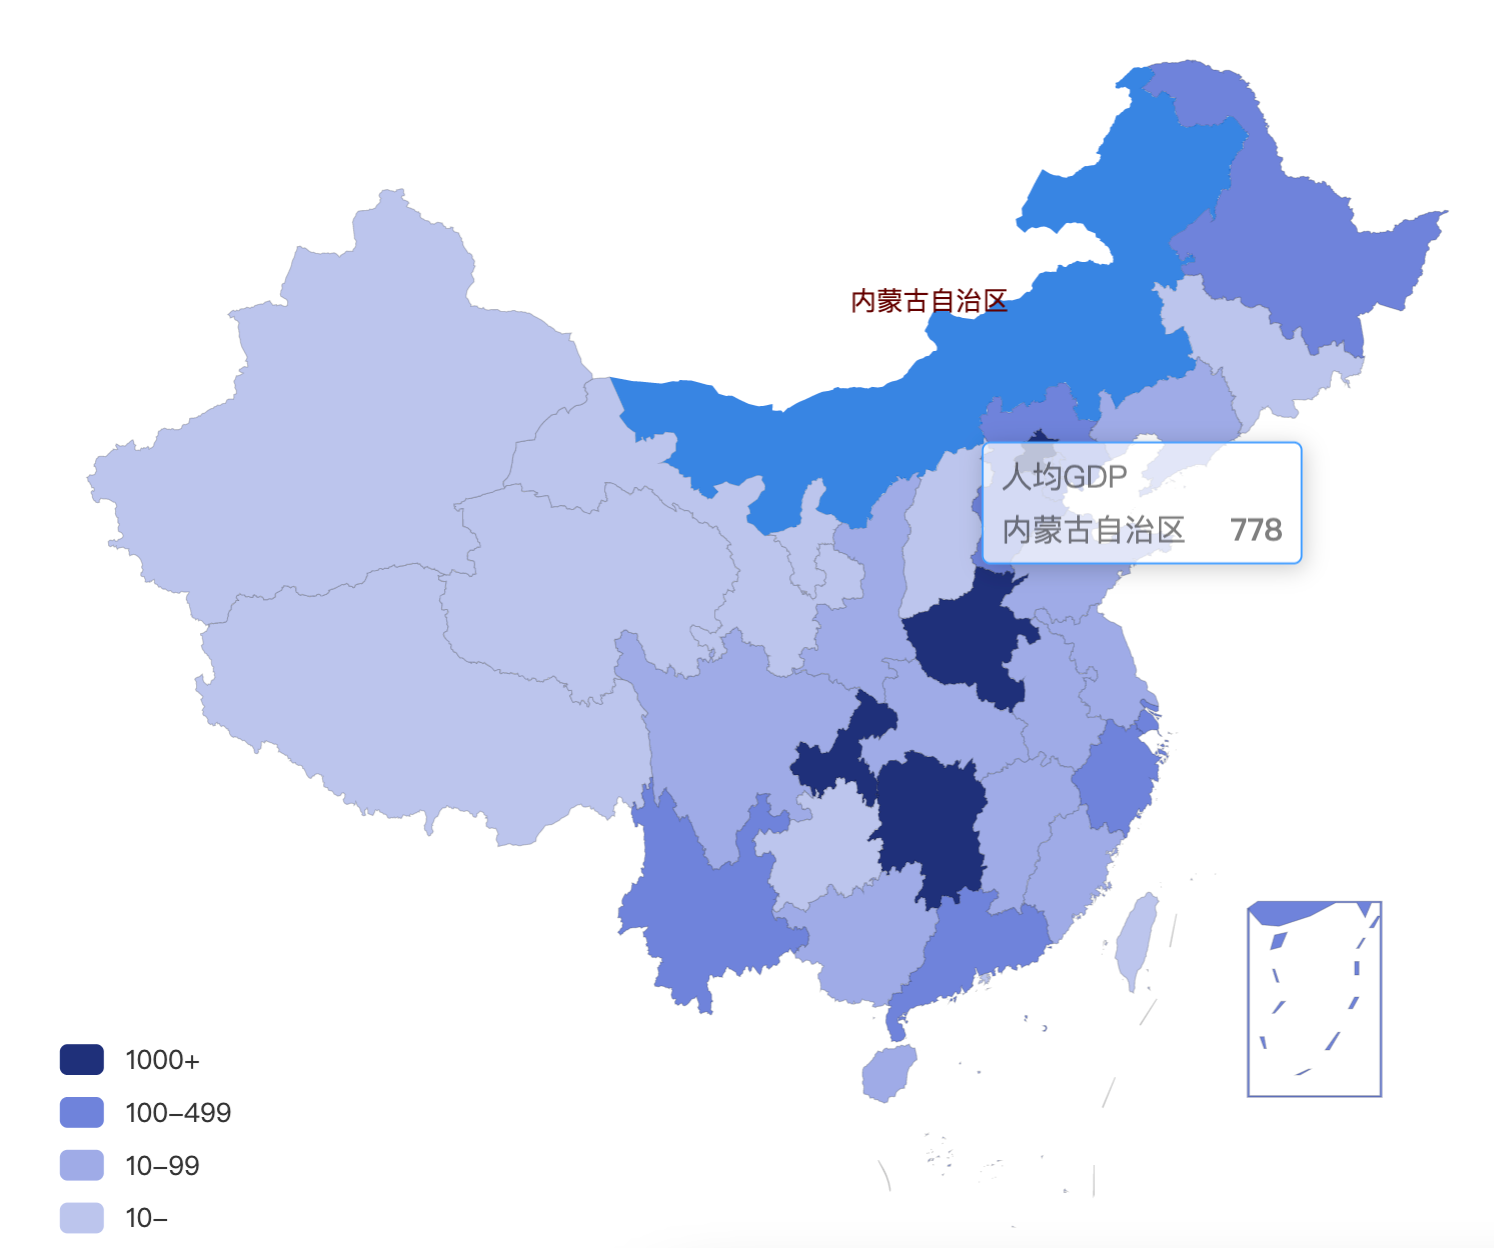
分段式视觉映射
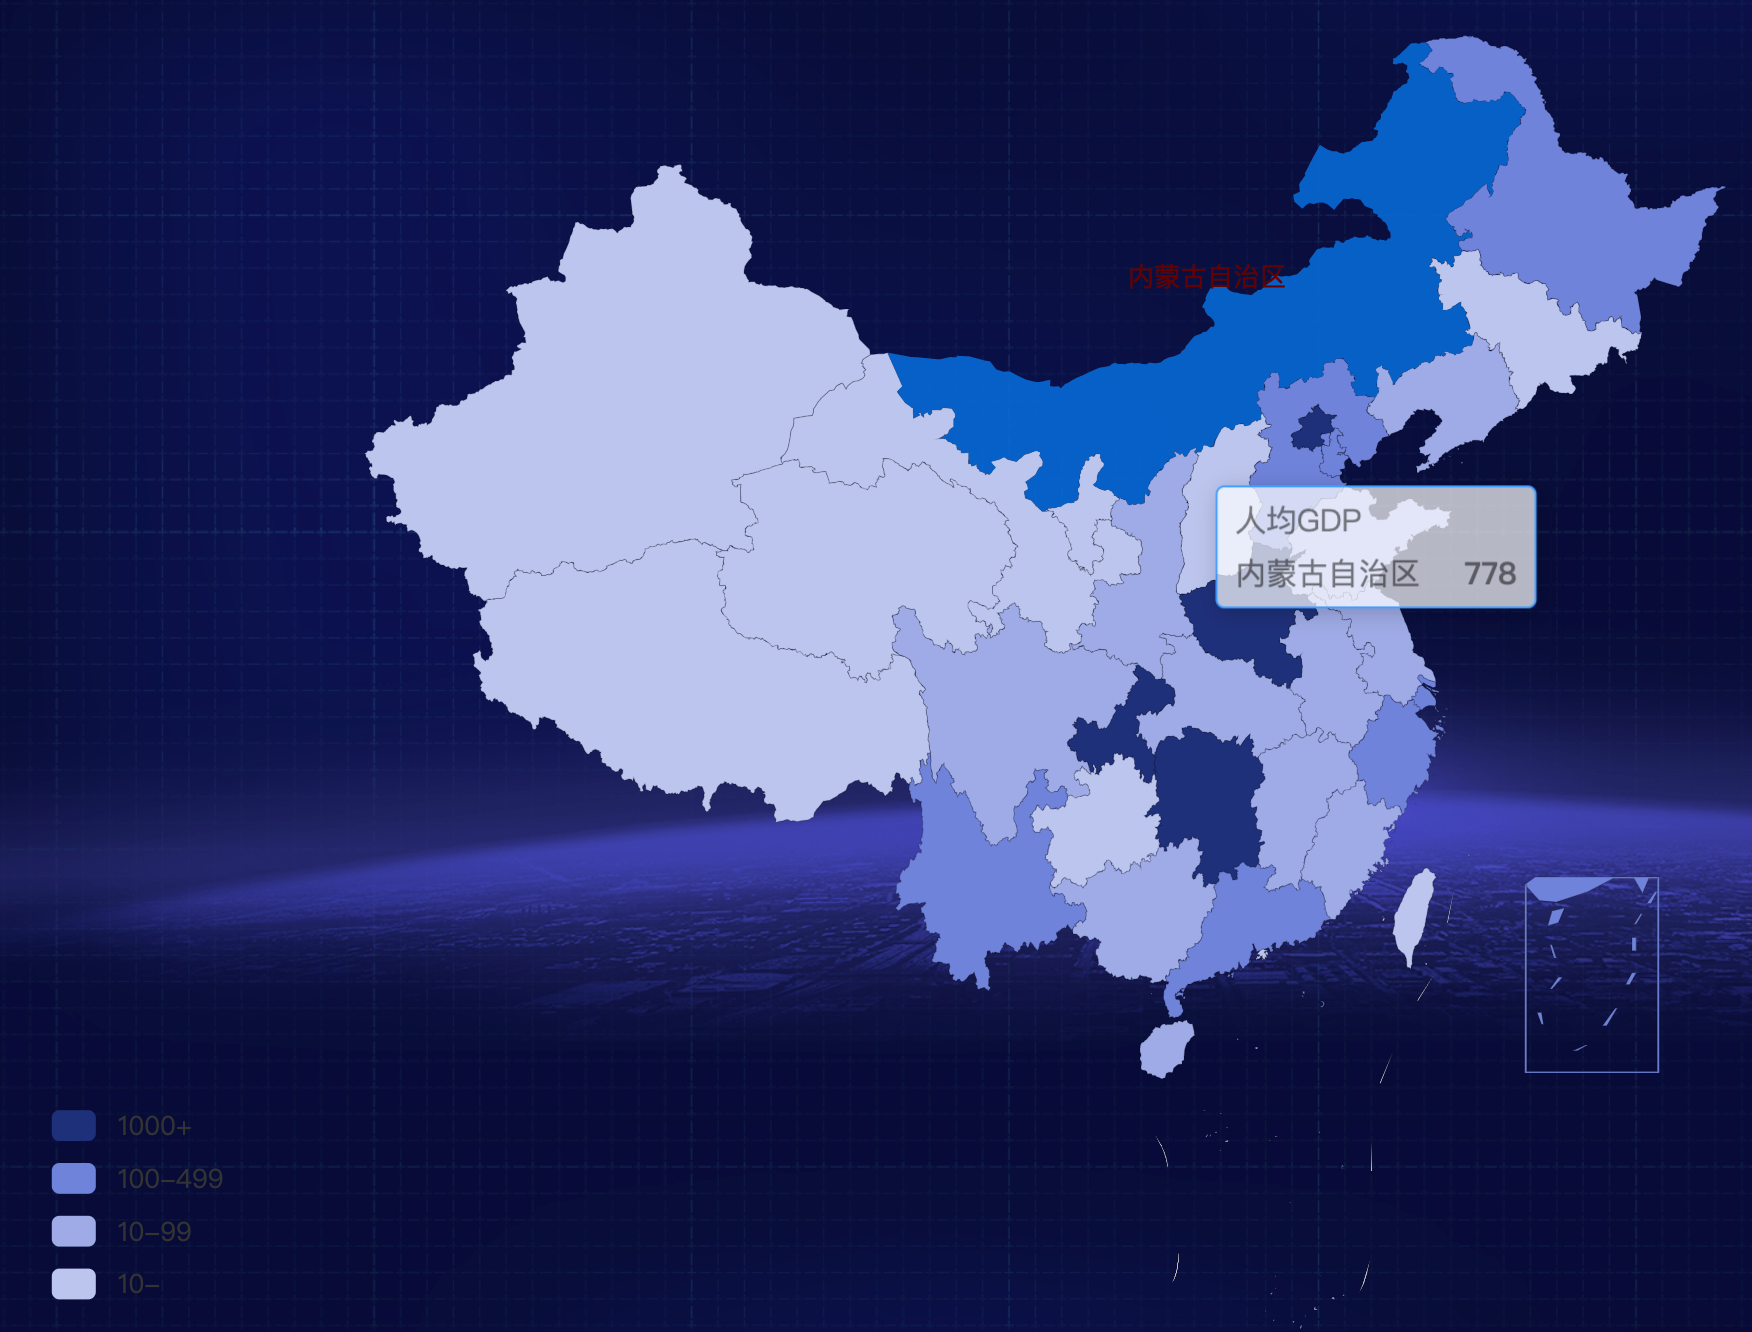
分段式视觉映射, 根据数据大小,各省显示不同颜色
https://echarts.apache.org/zh/option.html#visualMap-piecewise.pieces
�

ChinaMap.jsx
地图按需引入参考 https://echarts.apache.org/examples/zh/editor.html?c=map-usa
import React, { useEffect, useState } from 'react';import {array, number, string, oneOfType} from 'prop-types';import {TooltipComponent,GridComponent,LegendComponent,VisualMapComponent,GeoComponent} from 'echarts/components';import { MapChart } from 'echarts/charts';import { UniversalTransition } from 'echarts/features'import ECharts from '../../ECharts';import chinaOption from './chinaOption'ChinaMap.propTypes = {data: array,xdata: array,height: oneOfType([number, string]),className: string,theme: string,};ChinaMap.defaultProps = {height: '100%',}function ChinaMap({data, xData, height, className, theme}) {const [options, setOptions] = useState({})useEffect(update, [data, xData])function update() {const config = chinaOption({data, xData, theme});setOptions(config);}const attrs = {// renderType: 'svg',className,height,options,components: [VisualMapComponent,GeoComponent,TooltipComponent,GridComponent,LegendComponent,MapChart,UniversalTransition]}return (<ECharts {...attrs} />);}export default ChinaMap;
options
import * as echarts from 'echarts';import {chinaJson} from '../index';// name 一定要和 chinaJson中的 name保持一致,否则渲染错误// name 一定要和 chinaJson中的 name保持一致,否则渲染错误const mockData = [{name: "南海诸岛",value: 100,},{name: "北京市",value: 540},{name: "天津市",value: 130},{name: "上海市",value: 400},{name: "重庆市",value: 750},{name: "河北省",value: 130},{name: "河南省",value: 830},{name: "云南省",value: 110},{name: "辽宁省",value: 19},{name: "黑龙江省",value: 150},{name: "湖南省",value: 690},{name: "安徽省",value: 60},{name: "山东省",value: 39},{name: "新疆维吾尔自治区",value: 4},{name: "江苏省",value: 31},{name: "浙江省",value: 104},{name: "江西省",value: 36},{name: "湖北省",value: 52},{name: "广西壮族自治区",value: 33},{name: "甘肃省",value: 7},{name: "山西省",value: 5},{name: "内蒙古自治区",value: 778},{name: "陕西省",value: 22},{name: "吉林省",value: 4},{name: "福建省",value: 18},{name: "贵州省",value: 5},{name: "广东省",value: 398},{name: "青海省",value: 1},{name: "西藏自治区",value: 2},{name: "四川省",value: 44},{name: "宁夏回族自治区",value: 4},{name: "海南省",value: 22},{name: "台湾省",value: 3},{name: "香港特别行政区",value: 5},{name: "澳门特别行政区",value: 355}];function chinaOption() {echarts.registerMap('china', chinaJson);return {visualMap: {show: true,// type: 'continuous',bottom: 24,left: 24,showLabel: true,// 连续性视觉映射的参数// text: ['高', '低'],// 取值范围的文字// inRange: {// color: ['#e0ffff', '#006edd'] // 取值范围的颜色// },// 分段式视觉映射, 根据数据大小,各省显示不同颜色// https://echarts.apache.org/zh/option.html#visualMap-piecewise.piecespieces: [{gte: 100,label: "1000+",color: "#1f307b"},{gte: 500,lt: 999,label: "500-999",color: "#3c57ce"},{gte: 100,lt: 499,label: "100-499",color: "#6f83db"},{gte: 10,lt: 99,label: "10-99",color: "#9face7"},{lt: 10,label: '10-',color: "#bcc5ee"}]},// 中国地图设置geo: {map: "china",roam: true,zoom: 1.3,scaleLimit: {min: 1, max: 8},top: 120,label: {normal: {show: false,fontSize: 12,color: "rgba(0,0,0,0.65)"}},itemStyle: {normal: {borderColor: "rgba(0, 0, 0, 0.2)"},emphasis: {areaColor: "rgba(0,110,221,0.85)", // 鼠标选择区域颜色color: '#fff',shadowOffsetX: 0,shadowOffsetY: 0,borderWidth: 0}},// 高亮状态下// emphasis: {// label: {// color: '#fff',// }// }},series: [{name: "人均GDP",type: "map",data: mockData,geoIndex: 0,// map: 'china',// emphasis: {// label: {// show: true// }// },}],tooltip: {triggerOn: "mousemove",padding: 8,borderWidth: 1,borderColor: '#409eff',backgroundColor: 'rgba(255,255,255,0.7)',textStyle: {color: 'rgba(0,0,0,.5)',},},}}export default chinaOption;

