核心点
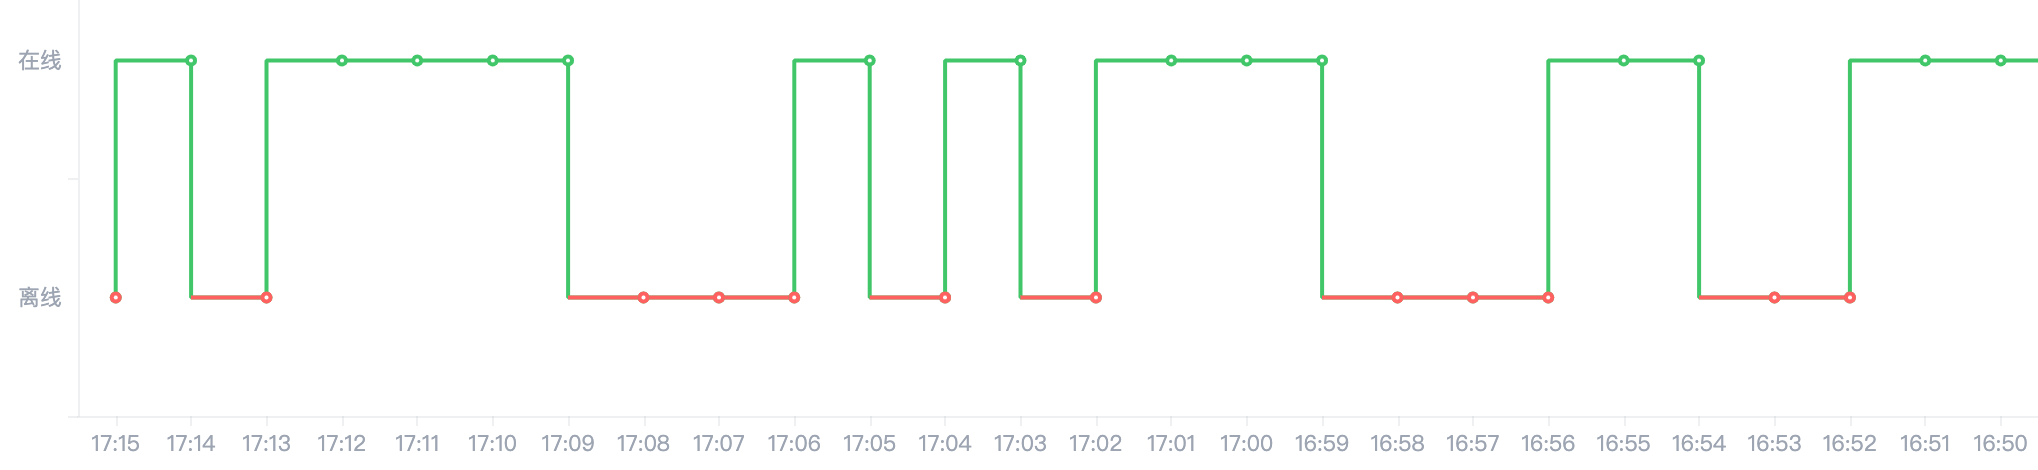
- 分段显示不同的颜色,明显的强调区别的作用
- 拆分为多个series,2个数据源实现在线,离线状态
- 第一个实现在线状态
- 第二个实现离线状态,不同的折线显示不同的颜色即可
- 若是不想让某个点展示,则这个点对应的data数值 null, 或 ‘-‘ 来表示
- yAxis的 type,设置为 category,设置数据源
function onlineToOffline({ dataSource, xAxisData, color = ['#41c669', '#ff6160'] }) {const _options = {color,tooltip: {// trigger: 'item',// formatter: '{a} <br/>{b} : {c}',},xAxis: {type: 'category',boundaryGap: true,data: xAxisData,axisTick: {lineStyle: { color: '#c1c5ca41' },alignWithLabel: true,},axisLine: { lineStyle: { color: '#c1c5ca41' }},axisLabel: { color: '#9da5b2', fontSize: '11' },},grid: {top: 24,right: 8,bottom: 0,left: 0,containLabel: true, // 防止标签溢出},yAxis: {type: 'category',data: ['离线', '在线'],axisLine: { lineStyle: { color: '#c1c5ca41' }},// 改为虚线网格splitLine: { lineStyle: { color: '#c1c5ca41', type: 'dashed' } },axisLabel: { color: '#9da5b2', fontSize: 11 },},series: [{name: '在线',type: 'line',step: 'online',data: [0, 1, 0, 1, 1, 1, 1, 0, 0, 0, 1, 0, 1, 0, 1, 1, 1, 0, 0, 0, 1, 1, 0, 0, 1, 1, 1, 1, 1, 0],itemStyle: {color: color[0],},},{name: '离线',type: 'line',step: 'offline',data: [0, 1, 0, 1, 1, 1, 1, 0, 0, 0, 1, 0, 1, 0, 1, 1, 1, 0, 0, 0, 1, 1, 0, 0, 1, 1, 1, 1, 1, 0].map(it => {return (it === 1) ? null : it}),itemStyle: {color: color[1],},},],};return _options;}export default onlineToOffline;

若有收获,就点个赞吧
0 人点赞
