第六节:细胞类型注释
在本节教程中,我们将进行细胞类型预测分析。我们既可以对单个细胞(每个细胞都获得预测的细胞类型)进行预测,也可以在每个细胞簇上执行。所有方法均基于与其他数据集的相似性比较,可以是sorting分选的单细胞或批量RNA-seq数据集,或针对每种细胞类型使用已知的标记基因。
在这里,我们将从Covid数据中选择一个样本ctrl_13,并预测该样本中的细胞类型。我们利用scPred包中的PBMC参考数据集,使用Seurat包中基于标签转移(label trasfer)的TransferData函数和scPred方法进行细胞类型预测。同时,我们还使用基于每个簇的DEG进行基因集富集分析来预测细胞类型。
即使参考数据集中未包含一些细胞的细胞类型,某些方法也会根据最相似的原则预测每个细胞的细胞类型。当然,这些预测方法也会有一定的不确定性,因此具有较低相似性评分的细胞将无法被分类。目前,已有多种不同的预测细胞类型的方法,这里我们仅介绍其中的一些。
加载所需的R包和数据集
suppressPackageStartupMessages({library(Seurat)library(venn)library(dplyr)library(cowplot)library(ggplot2)library(pheatmap)library(rafalib)library(scPred)})# load the data and select 'ctrl_13` samplealldata <- readRDS("data/results/covid_qc_dr_int_cl.rds")# 提取ctrl_13样本的数据ctrl = alldata[, alldata$orig.ident == "ctrl_13"]# set active assay to RNA and remove the CCA assayctrl@active.assay = "RNA"ctrl[["CCA"]] = NULLctrl## An object of class Seurat## 18121 features across 1129 samples within 1 assay## Active assay: RNA (18121 features, 0 variable features)## 6 dimensional reductions calculated: umap, tsne, harmony, umap_harmony, scanorama, umap_scanorama
获取参考数据集
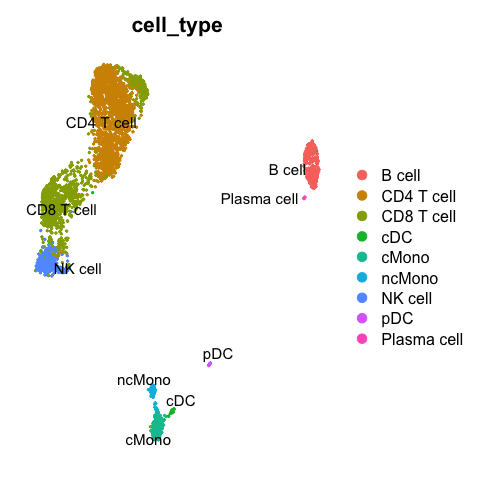
接下来,我们从scPred包中提取PBMC参考数据集,并进行常规的数据标准化、可变基因筛选、归一化和降维处理。
# 提取scPred包中PBMC参考数据集
reference <- scPred::pbmc_1

reference
## An object of class Seurat
## 32838 features across 3500 samples within 1 assay
## Active assay: RNA (32838 features, 0 variable features)
对参考数据集进行预处理
这里,我们使用magittr包中的管道符%>%一次性运行预处理的所有步骤。
reference <- reference %>% NormalizeData() %>% FindVariableFeatures() %>% ScaleData() %>%
                           RunPCA(verbose = F) %>% RunUMAP(dims = 1:30)

DimPlot(reference, group.by = "cell_type", label = TRUE, repel = TRUE) + NoAxes()
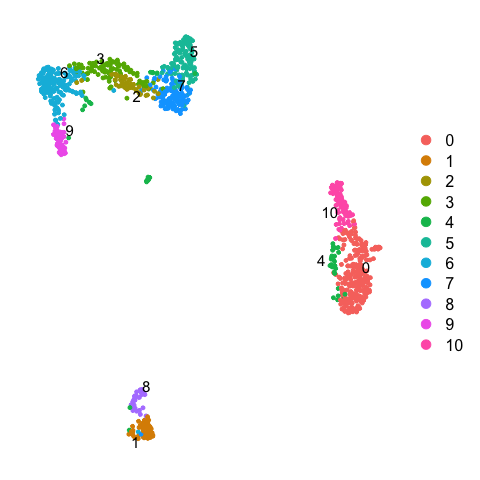
同样的,我们对ctrl_13样本执行相应的操作,并提取先前整合数据中在0.3分辨率下的聚类分群结果。
# Set the identity as louvain with resolution 0.3
ctrl <- SetIdent(ctrl, value = "CCA_snn_res.0.5")

ctrl <- ctrl %>% NormalizeData() %>% FindVariableFeatures() %>% ScaleData() %>% RunPCA(verbose = F) %>% RunUMAP(dims = 1:30)

DimPlot(ctrl, label = TRUE, repel = TRUE) + NoAxes()
使用Seurat包中的标签转移方法进行细胞类型预测
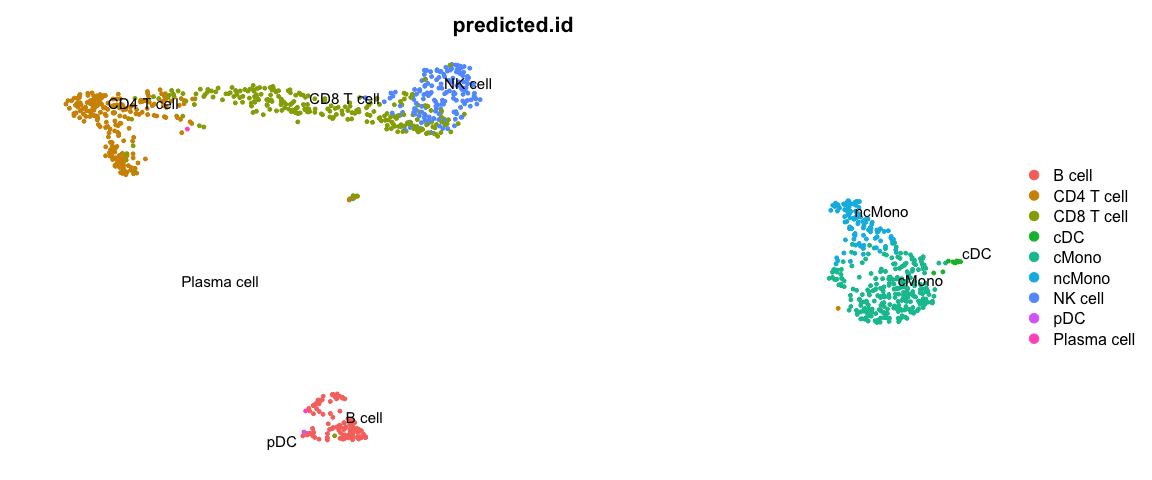
First we will run label transfer using a similar method as in the integration exercise. But, instad of CCA the default for the FindTransferAnchors function is to use “pcaproject”, e.g. the query datset is projected onto the PCA of the reference dataset. Then, the labels of the reference data are predicted.
# 使用FindTransferAnchors函数寻找query和reference数据集之间的anchors
transfer.anchors <- FindTransferAnchors(reference = reference, query = ctrl, dims = 1:30)
# 使用TransferData函数进行标签转移的细胞类型预测
predictions <- TransferData(anchorset = transfer.anchors, refdata = reference$cell_type,
    dims = 1:30)

# 将细胞类型预测的结果添加到metadata中
ctrl <- AddMetaData(object = ctrl, metadata = predictions)

DimPlot(ctrl, group.by = "predicted.id", label = T, repel = T) + NoAxes()
Now plot how many cells of each celltypes can be found in each cluster.
ggplot(ctrl@meta.data, aes(x = CCA_snn_res.0.5, fill = predicted.id)) + geom_bar() + theme_classic()

使用scPred预测细胞类型
scPred will train a classifier based on all principal components. First, getFeatureSpace will create a scPred object stored in the @misc slot where it extracts the PCs that best separates the different celltypes. Then trainModel will do the actual training for each celltype.
reference <- getFeatureSpace(reference, "cell_type")

# ●  Extracting feature space for each cell type...
## DONE!

reference <- trainModel(reference)
## ●  Training models for each cell type...
## maximum number of iterations reached 0.000116588 -0.0001156614DONE!
We can then print how well the training worked for the different celltypes by printing the number of PCs used for each, the ROC value and Sensitivity/Specificity.
get_scpred(reference)
## 'scPred' object
## ✔  Prediction variable = cell_type
## ✔  Discriminant features per cell type
## ✔  Training model(s)
## Summary
##
## |Cell type   |    n| Features|Method    |   ROC|  Sens|  Spec|
## |:-----------|----:|--------:|:---------|-----:|-----:|-----:|
## |B cell      |  280|       50|svmRadial | 1.000| 0.964| 1.000|
## |CD4 T cell  | 1620|       50|svmRadial | 0.997| 0.971| 0.975|
## |CD8 T cell  |  945|       50|svmRadial | 0.985| 0.902| 0.978|
## |cDC         |   26|       50|svmRadial | 0.995| 0.547| 1.000|
## |cMono       |  212|       50|svmRadial | 0.994| 0.958| 0.970|
## |ncMono      |   79|       50|svmRadial | 0.998| 0.582| 1.000|
## |NK cell     |  312|       50|svmRadial | 0.999| 0.936| 0.996|
## |pDC         |   20|       50|svmRadial | 1.000| 0.700| 1.000|
## |Plasma cell |    6|       50|svmRadial | 1.000| 0.800| 1.000|
我们可以通过更改参数和测试不同类型的模型来优化每个数据集的参数,有关更多信息,请访问:https : //powellgenomicslab.github.io/scPred/articles/introduction.html。但是目前,我们将继续使用该模型进行细胞类型预测。
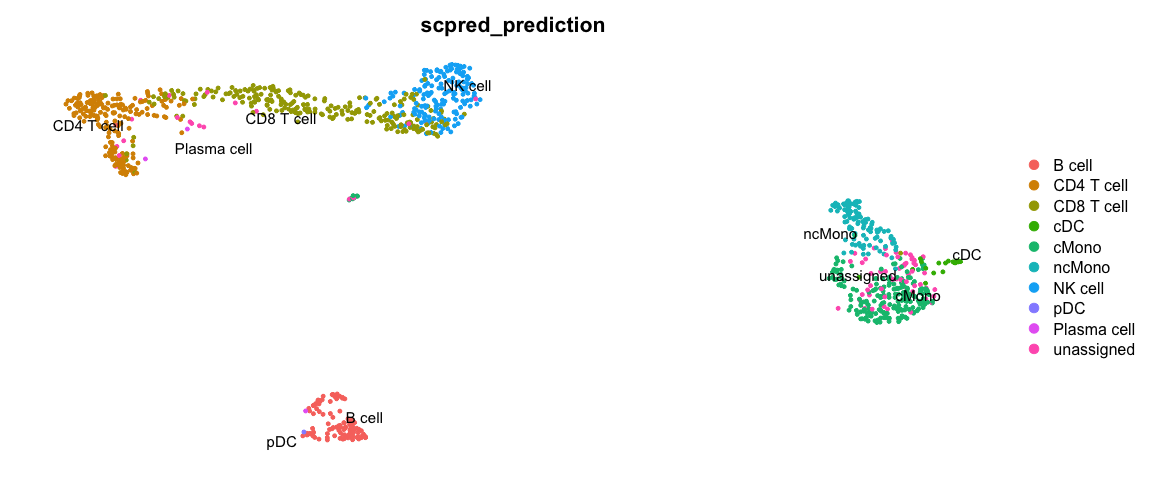
接下来,我们可以根据训练好的数据集来预测细胞类型,其中scPred会基于Harmony将两个数据集对齐,然后执行分类。
ctrl <- scPredict(ctrl, reference)
## ●  Matching reference with new dataset...
##   ─ 2000 features present in reference loadings
##   ─ 1774 features shared between reference and new dataset
##   ─ 88.7% of features in the reference are present in new dataset
## ●  Aligning new data to reference...
## ●  Classifying cells...
## DONE!

DimPlot(ctrl, group.by = "scpred_prediction", label = T, repel = T) + NoAxes()
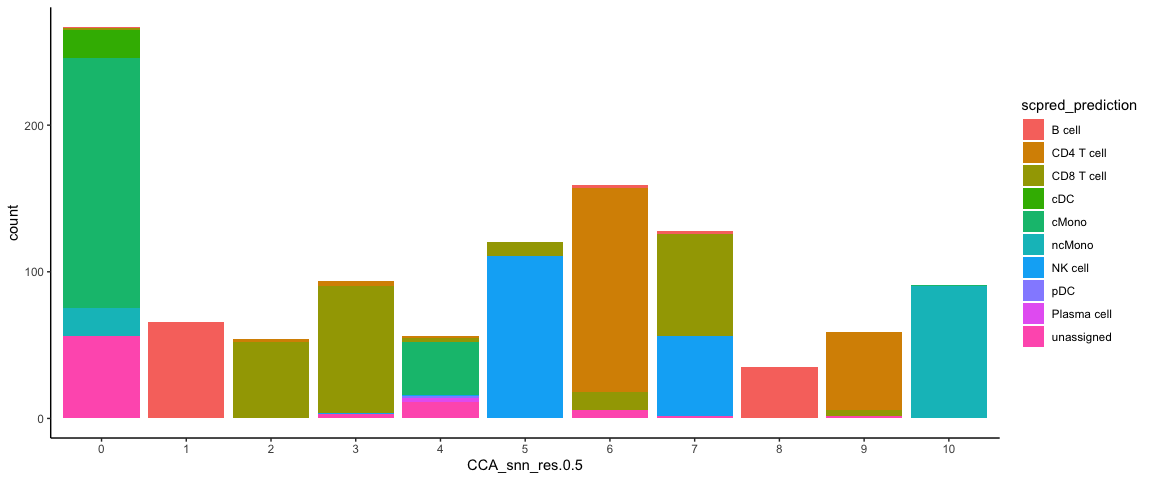
Now plot how many cells of each celltypes can be found in each cluster.
ggplot(ctrl@meta.data, aes(x = CCA_snn_res.0.5, fill = scpred_prediction)) + geom_bar() +
    theme_classic()
比较不同预测方法的结果
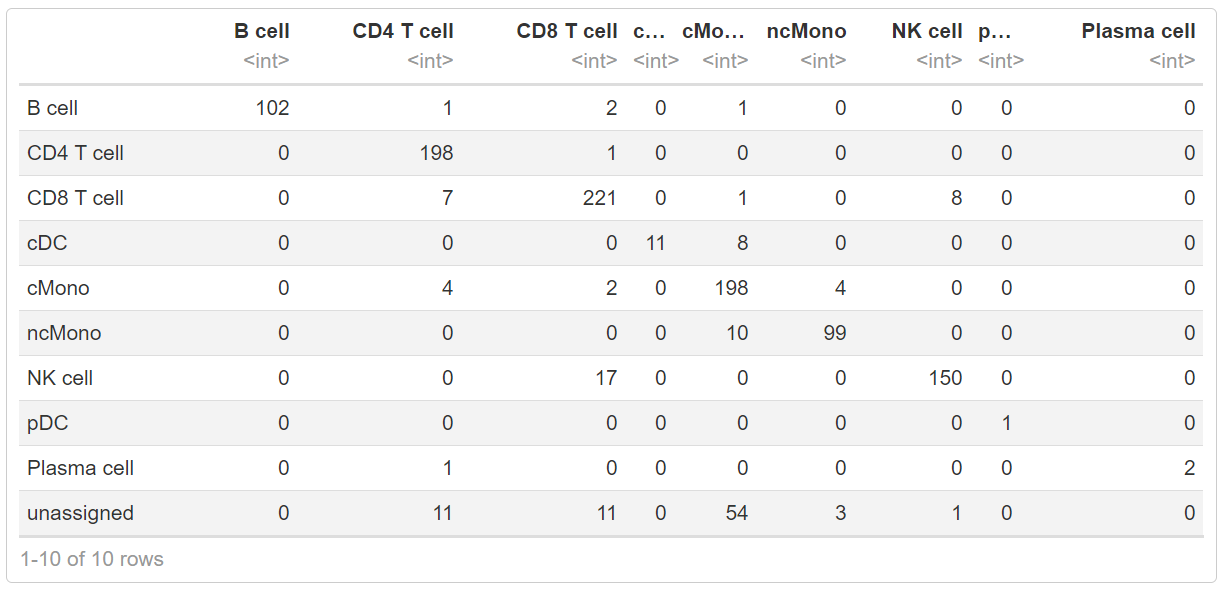
现在,我们将使用scPred包中的crossTab 函数方便的比较这两种分类方法的结果,该函数会得到两种分类结果中的交集。
crossTab(ctrl, "predicted.id", "scpred_prediction")
使用GSEA富集分析预测细胞类型
对于细胞簇水平上的细胞类型预测,我们还可以使用针对特定细胞类型标记基因的GSEA富集预测。类似于我们在差异表达分析中对DEG进行功能富集的方式。有一些可用的细胞类型基因集的数据库,如CellMarker,PanglaoDB或MSigDB。我们还可以查看参考数据集中的DEG与您正在分析的数据集之间的重叠。
使用重叠的DEGs进行基因集的富集
首先,我们提取Covid-19数据集和参考数据集中的top DEGs。
# run differential expression in our dataset, using clustering at resolution 0.3
alldata <- SetIdent(alldata, value = "CCA_snn_res.0.5")

DGE_table <- FindAllMarkers(alldata, logfc.threshold = 0, test.use = "wilcox", min.pct = 0.1,
    min.diff.pct = 0, only.pos = TRUE, max.cells.per.ident = 20, return.thresh = 1,
    assay = "RNA")

# split into a list
DGE_list <- split(DGE_table, DGE_table$cluster)

unlist(lapply(DGE_list, nrow))
##    0    1    2    3    4    5    6    7    8    9   10
## 3153 2483 3394 2837 2573 3956 2150 3753 2465 2142 3342

# Compute differential gene expression in reference dataset (that has cell annotation)
reference <- SetIdent(reference, value = "cell_type")

reference_markers <- FindAllMarkers(reference, min.pct = 0.1, min.diff.pct = 0.2,
    only.pos = T, max.cells.per.ident = 20, return.thresh = 1)

# Identify the top cell marker genes in reference dataset select top 50 with highest foldchange among top 100 signifcant genes.
reference_markers <- reference_markers[order(reference_markers$avg_logFC, decreasing = T), ]
top50_cell_selection <- reference_markers %>% group_by(cluster) %>% top_n(-100, p_val) %>%
    top_n(50, avg_logFC)

# Transform the markers into a list
ref_list = split(top50_cell_selection$gene, top50_cell_selection$cluster)

unlist(lapply(ref_list, length))
##  CD8 T cell  CD4 T cell       cMono      B cell     NK cell         pDC
##          30          14          50          50          50          50
##      ncMono         cDC Plasma cell
##          50          50          50
接下来,我们基于这些细胞类型特异的DEGs进行GSEA富集分析,并检查DEGs在参考数据集中的富集程度。
suppressPackageStartupMessages(library(fgsea))

# run fgsea for each of the clusters in the list
res <- lapply(DGE_list, function(x) {
    gene_rank <- setNames(x$avg_logFC, x$gene)
    fgseaRes <- fgsea(pathways = ref_list, stats = gene_rank, nperm = 10000)
    return(fgseaRes)
})
names(res) <- names(DGE_list)

# You can filter and resort the table based on ES, NES or pvalue
res <- lapply(res, function(x) {
    x[x$pval < 0.1, ]
})
res <- lapply(res, function(x) {
    x[x$size > 2, ]
})
res <- lapply(res, function(x) {
    x[order(x$NES, decreasing = T), ]
})
res
## $`0`
##    pathway         pval        padj        ES      NES nMoreExtreme size
## 1:   cMono 0.0000999900 0.000299970 0.9588744 2.095372            0   48
## 2:  ncMono 0.0000999900 0.000299970 0.8410417 1.833205            0   46
## 3:     cDC 0.0000999900 0.000299970 0.8160502 1.772541            0   43
## 4:     pDC 0.0005017561 0.001128951 0.7652807 1.584164            4   21
## 5:  B cell 0.0069809794 0.012565763 0.7410824 1.493208           68   15
## 6: NK cell 0.0150437919 0.022565688 0.7579453 1.475439          145   11
##                                     leadingEdge
## 1:      S100A8,S100A9,LYZ,S100A12,VCAN,FCN1,...
## 2:     CTSS,TYMP,CST3,S100A11,AIF1,SERPINA1,...
## 3:              LYZ,GRN,TYMP,CST3,AIF1,CPVL,...
## 4:         GRN,MS4A6A,CST3,MPEG1,CTSB,TGFBI,...
## 5: NCF1,LY86,MARCH1,HLA-DRB5,POU2F2,PHACTR1,...
## 6:       TYROBP,FCER1G,SRGN,CCL3,CD63,MYO1F,...
##
## $`1`
##        pathway         pval        padj        ES      NES nMoreExtreme size
## 1:      B cell 0.0000999900 0.000408455 0.8973600 1.988512            0   46
## 2:         cDC 0.0001021138 0.000408455 0.8750203 1.778727            0   14
## 3:         pDC 0.0011068625 0.002951633 0.7719359 1.612224           10   18
## 4: Plasma cell 0.0631477722 0.101036436 0.7333284 1.389860          590    8
## 5:      ncMono 0.0913272011 0.121769601 0.8427419 1.344760          694    3
##                                             leadingEdge
## 1:      CD79A,TCL1A,LINC00926,MS4A1,CD79B,TNFRSF13C,...
## 2: CD74,HLA-DQB1,HLA-DRA,HLA-DPB1,HLA-DRB1,HLA-DQA1,...
## 3:               CD74,TCF4,BCL11A,IRF8,HERPUD1,SPIB,...
## 4:                PLPP5,ISG20,HERPUD1,MZB1,ITM2C,JCHAIN
## 5:                                  HLA-DPA1,POU2F2,LYN
##
## $`2`
##       pathway         pval         padj        ES      NES nMoreExtreme size
## 1: CD8 T cell 0.0001001603 0.0003505609 0.9432365 2.276503            0   29
## 2:    NK cell 0.0001000801 0.0003505609 0.8661551 2.108346            0   32
## 3: CD4 T cell 0.0007128431 0.0016633005 0.9256514 1.721886            5    5
## 4:        pDC 0.0398826342 0.0697946099 0.7225340 1.474840          366    8
##                            leadingEdge
## 1:   GZMH,CD8A,CD3D,CD3G,CD8B,CCL5,...
## 2: CCL5,NKG7,GZMA,FGFBP2,CCL4,GZMM,...
## 3:                      CD3G,CD3E,IL7R
## 4:               C12orf75,GZMB,SELENOS
##
## $`3`
##       pathway         pval         padj        ES      NES nMoreExtreme size
## 1: CD8 T cell 0.0001002205 0.0003006615 0.9553147 2.173136            0   25
## 2:    NK cell 0.0001001302 0.0003006615 0.8360990 1.915575            0   27
## 3: CD4 T cell 0.0026475455 0.0052950910 0.8663678 1.674383           23    7
##                           leadingEdge
## 1: DUSP2,CCL5,CD3D,LYAR,CD8A,CD3E,...
## 2: CCL5,KLRB1,GZMM,CMC1,CST7,GZMA,...
## 3:        CD3E,CD3G,IL7R,PIK3IP1,TCF7
##
## $`4`
##    pathway         pval       padj        ES      NES nMoreExtreme size
## 1:   cMono 0.0005000500 0.00270081 0.7200941 1.556501            4   45
## 2:  ncMono 0.0006001801 0.00270081 0.7215360 1.545517            5   38
## 3:  B cell 0.0191673788 0.04312660 0.9013244 1.505237          156    4
## 4:     cDC 0.0049014704 0.01470441 0.6806718 1.448777           48   34
## 5:     pDC 0.0843953838 0.15191169 0.6245503 1.295140          840   22
##                                 leadingEdge
## 1:   CST3,FCER1G,COTL1,LYZ,STXBP2,AP1S2,...
## 2: OAZ1,TIMP1,CST3,FKBP1A,IFITM3,FCER1G,...
## 3:                     PDLIM1,HLA-DRB5,NCF1
## 4: GAPDH,CST3,FCER1G,COTL1,LYZ,HLA-DRB5,...
## 5:       PTCRA,CST3,TXN,CTSB,APP,MS4A6A,...
##
## $`5`
##        pathway         pval         padj        ES      NES nMoreExtreme size
## 1:     NK cell 0.0000999900 0.0004019697 0.9377894 2.439144            0   50
## 2:  CD8 T cell 0.0001004924 0.0004019697 0.9138145 2.225902            0   23
## 3:         pDC 0.0018019928 0.0048053141 0.8029287 1.747492           16   10
## 4:      ncMono 0.0115903265 0.0231806531 0.7906541 1.605347          103    7
## 5: Plasma cell 0.0228548516 0.0365677626 0.5842785 1.450093          227   28
##                                  leadingEdge
## 1:        SPON2,GNLY,PRF1,GZMB,CD7,CLIC3,...
## 2:       GNLY,PRF1,GZMB,NKG7,FGFBP2,CTSW,...
## 3: GZMB,C12orf75,RRBP1,PLAC8,ALOX5AP,HSP90B1
## 4:                   FCGR3A,IFITM2,RHOC,HES4
## 5:  CD38,FKBP11,SLAMF7,SDF2L1,PRDM1,PPIB,...
##
## $`6`
##       pathway         pval         padj        ES      NES nMoreExtreme size
## 1: CD4 T cell 0.0001020616 0.0006123699 0.9154707 1.793599            0   13
## 2: CD8 T cell 0.0011968230 0.0035904689 0.8968754 1.622288           10    7
##                          leadingEdge
## 1: IL7R,LTB,LDHB,RCAN3,MAL,NOSIP,...
## 2:      IL32,CD3E,CD3D,CD2,CD3G,CD8B
##
## $`7`
##        pathway         pval         padj        ES      NES nMoreExtreme size
## 1:     NK cell 0.0000999900 0.0004013646 0.9150850 2.398852            0   46
## 2:  CD8 T cell 0.0001003412 0.0004013646 0.9281782 2.318084            0   26
## 3:      ncMono 0.0024107450 0.0064286534 0.8617933 1.703177           20    6
## 4:         pDC 0.0130282809 0.0260565618 0.7292142 1.595377          122   10
## 5: Plasma cell 0.0451813264 0.0722901222 0.5447121 1.375779          450   29
##                                   leadingEdge
## 1:        FGFBP2,GNLY,NKG7,CST7,GZMB,CTSW,...
## 2:        FGFBP2,GNLY,NKG7,CST7,GZMB,CTSW,...
## 3:                         FCGR3A,IFITM2,RHOC
## 4:  GZMB,C12orf75,HSP90B1,ALOX5AP,RRBP1,PLAC8
## 5: PRDM1,FKBP11,HSP90B1,PPIB,SPCS2,SDF2L1,...
##
## $`8`
##        pathway         pval         padj        ES      NES nMoreExtreme size
## 1:      B cell 0.0000999900 0.0004571312 0.8983372 1.896468            0   45
## 2:         cDC 0.0001015847 0.0004571312 0.8787620 1.717309            0   14
## 3:         pDC 0.0005035247 0.0015105740 0.8235666 1.638689            4   17
## 4: Plasma cell 0.0116822430 0.0175233645 0.7578645 1.481047          114   14
##                                             leadingEdge
## 1:        CD79A,MS4A1,BANK1,CD74,TNFRSF13C,HLA-DQA1,...
## 2: CD74,HLA-DQA1,HLA-DRA,HLA-DPB1,HLA-DQB1,HLA-DPA1,...
## 3:             CD74,JCHAIN,SPIB,HERPUD1,TCF4,CCDC50,...
## 4:                JCHAIN,HERPUD1,ISG20,ITM2C,PEBP1,MZB1
##
## $`9`
##       pathway         pval         padj        ES      NES nMoreExtreme size
## 1: CD4 T cell 0.0001023227 0.0006139364 0.9248473 1.981064            0   13
## 2: CD8 T cell 0.0668711656 0.1587804395 0.7936868 1.374165          544    4
##                             leadingEdge
## 1: IL7R,TCF7,PIK3IP1,TSHZ2,LTB,LEF1,...
## 2:                   CD3E,CD3G,CD3D,CD2
##
## $`10`
##    pathway       pval         padj        ES      NES nMoreExtreme size
## 1:  ncMono 0.00009999 0.0002666667 0.9578305 2.052171            0   49
## 2:   cMono 0.00010000 0.0002666667 0.8907972 1.877527            0   35
## 3:     cDC 0.00009999 0.0002666667 0.8272454 1.750653            0   38
## 4: NK cell 0.00255050 0.0051009998 0.8054483 1.571513           24   13
## 5:     pDC 0.04759980 0.0761596766 0.6792488 1.351779          470   16
## 6:  B cell 0.07367357 0.0945474534 0.6570759 1.307652          728   16
##                                               leadingEdge
## 1:                CDKN1C,LST1,FCGR3A,AIF1,COTL1,MS4A7,...
## 2:               LST1,AIF1,COTL1,SERPINA1,FCER1G,PSAP,...
## 3:                   LST1,AIF1,COTL1,FCER1G,CST3,SPI1,...
## 4:             FCGR3A,FCER1G,RHOC,TYROBP,IFITM2,MYO1F,...
## 5:                   CST3,NPC2,PLD4,MPEG1,VAMP8,TGFBI,...
## 6: HLA-DPA1,POU2F2,HLA-DRB5,HLA-DRA,HLA-DPB1,HLA-DRB1,...
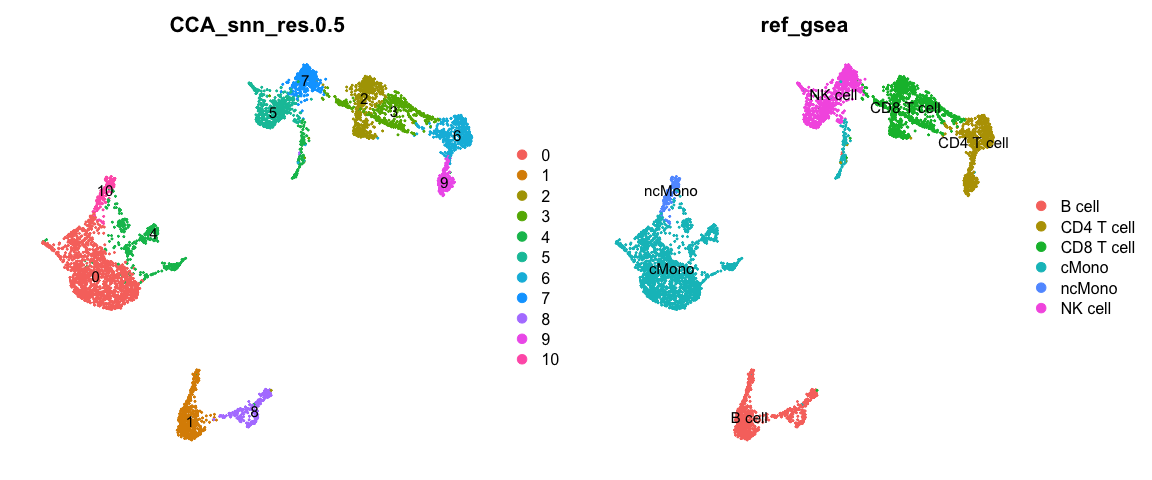
现在,我们可以根据每个细胞簇富集的最优结果对它们进行重命名。OBS!请注意,如果某些cluster富集到的所有基因集的p值都不好,那么这个预测的结果将会不太可靠。同样,如果我们使用的基因集无法涵盖所有的细胞类型,那么预测的结果可能只是最相似的细胞类型。
new.cluster.ids <- unlist(lapply(res, function(x) {
    as.data.frame(x)[1, 1]
}))

alldata$ref_gsea <- new.cluster.ids[as.character(alldata@active.ident)]

cowplot::plot_grid(ncol = 2, DimPlot(alldata, label = T, group.by = "CCA_snn_res.0.5") +
    NoAxes(), DimPlot(alldata, label = T, group.by = "ref_gsea") + NoAxes())
将富集预测的结果与ctrl_13样本中的其他细胞类型预测方法进行比较。
ctrl$ref_gsea = alldata$ref_gsea[alldata$orig.ident == "ctrl_13"]

cowplot::plot_grid(ncol = 3, DimPlot(ctrl, label = T, group.by = "ref_gsea") + NoAxes() +
    ggtitle("GSEA"), DimPlot(ctrl, label = T, group.by = "predicted.id") + NoAxes() +
    ggtitle("LabelTransfer"), DimPlot(ctrl, label = T, group.by = "scpred_prediction") +
    NoAxes() + ggtitle("scPred"))

使用已知的带有注释的基因集进行富集
首先,我们从CellMarker数据库下载特定细胞类型的基因集。
# Download gene marker list
if (!dir.exists("data/CellMarker_list/")) {
    dir.create("data/CellMarker_list")
    download.file(url = "http://bio-bigdata.hrbmu.edu.cn/CellMarker/download/Human_cell_markers.txt",
        destfile = "./data/CellMarker_list/Human_cell_markers.txt")
    download.file(url = "http://bio-bigdata.hrbmu.edu.cn/CellMarker/download/Mouse_cell_markers.txt",
        destfile = "./data/CellMarker_list/Mouse_cell_markers.txt")
}
读入基因集列表,并做初步的筛选。
# Load the human marker table
markers <- read.delim("data/CellMarker_list/Human_cell_markers.txt")
markers <- markers[markers$speciesType == "Human", ]
markers <- markers[markers$cancerType == "Normal", ]

# Filter by tissue (to reduce computational time and have tissue-specific
# classification) sort(unique(markers$tissueType))
# grep('blood',unique(markers$tissueType),value = T) markers <- markers [
# markers$tissueType %in% c('Blood','Venous blood', 'Serum','Plasma',
# 'Spleen','Bone marrow','Lymph node'), ]

# remove strange characters etc.
celltype_list <- lapply(unique(markers$cellName), function(x) {
    x <- paste(markers$geneSymbol[markers$cellName == x], sep = ",")
    x <- gsub("[[]|[]]| |-", ",", x)
    x <- unlist(strsplit(x, split = ","))
    x <- unique(x[!x %in% c("", "NA", "family")])
    x <- casefold(x, upper = T)
})
names(celltype_list) <- unique(markers$cellName)
# celltype_list <- lapply(celltype_list , function(x) {x[1:min(length(x),50)]} )
celltype_list <- celltype_list[unlist(lapply(celltype_list, length)) < 100]
celltype_list <- celltype_list[unlist(lapply(celltype_list, length)) > 5]
对已知的基因集进行GSEA富集分析。
# run fgsea for each of the clusters in the list
res <- lapply(DGE_list, function(x) {
    gene_rank <- setNames(x$avg_logFC, x$gene)
    fgseaRes <- fgsea(pathways = celltype_list, stats = gene_rank, nperm = 10000)
    return(fgseaRes)
})
names(res) <- names(DGE_list)

# You can filter and resort the table based on ES, NES or pvalue
res <- lapply(res, function(x) {
    x[x$pval < 0.01, ]
})
res <- lapply(res, function(x) {
    x[x$size > 5, ]
})
res <- lapply(res, function(x) {
    x[order(x$NES, decreasing = T), ]
})

# show top 3 for each cluster.
lapply(res, head, 3)
## $`0`
##                   pathway         pval       padj        ES      NES
## 1:             Neutrophil 0.0000999900 0.00427395 0.8225470 1.803093
## 2:             Fibroblast 0.0001042427 0.00427395 0.8978804 1.725605
## 3: CD1C+_B dendritic cell 0.0000999900 0.00427395 0.7846113 1.711199
##    nMoreExtreme size                              leadingEdge
## 1:            0   55 S100A8,S100A9,S100A12,CD14,MNDA,G0S2,...
## 2:            0   10        CD14,VIM,CD36,CKAP4,LRP1,CD44,...
## 3:            0   49  S100A8,S100A9,LYZ,S100A12,VCAN,FCN1,...
##
## $`1`
##                         pathway         pval       padj        ES      NES
## 1:            Follicular B cell 0.0001026905 0.01314438 0.8905277 1.776479
## 2: Megakaryocyte erythroid cell 0.0020831163 0.03662375 0.8307946 1.620952
##    nMoreExtreme size                         leadingEdge
## 1:            0   12 MS4A1,CD69,FCER2,CD22,CD40,PAX5,...
## 2:           19   10     CD79A,CD83,CD69,FCER2,LY9,CXCR5
##
## $`2`
##                         pathway         pval         padj        ES      NES
## 1:        CD4+ cytotoxic T cell 0.0000999900 0.0008897005 0.8208075 2.102096
## 2: Megakaryocyte erythroid cell 0.0001005126 0.0008897005 0.8803002 2.071241
## 3:                  CD8+ T cell 0.0001055186 0.0008897005 0.9672513 2.058873
##    nMoreExtreme size                          leadingEdge
## 1:            0   65 GZMH,CCL5,NKG7,KLRG1,GZMA,FGFBP2,...
## 2:            0   22    CD8A,CD3D,CD3G,CD2,CD3E,KLRG1,...
## 3:            0   10     CD8A,CD3D,CD3G,CD8B,CD2,CD3E,...
##
## $`3`
##                         pathway         pval        padj        ES      NES
## 1:                  CD8+ T cell 0.0001023332 0.001457502 0.9558597 2.023154
## 2: Megakaryocyte erythroid cell 0.0001000801 0.001457502 0.8371009 1.911415
## 3:                T helper cell 0.0001012863 0.001457502 0.8699055 1.893383
##    nMoreExtreme size                         leadingEdge
## 1:            0   13   GZMK,CD3D,CD8A,CD3E,CD3G,CD8B,...
## 2:            0   27 CD3D,CD8A,KLRB1,CD3E,KLRG1,CD3G,...
## 3:            0   16  GZMK,CD3D,KLRB1,CD3E,CD3G,IL7R,...
##
## $`4`
##                   pathway         pval       padj        ES      NES
## 1:          Megakaryocyte 0.0001033058 0.01580579 0.9165646 1.785300
## 2: Circulating fetal cell 0.0059165346 0.24682396 0.8357811 1.589161
## 3:               Platelet 0.0080661424 0.24682396 0.7460329 1.521198
##    nMoreExtreme size                         leadingEdge
## 1:            0   11     PPBP,PF4,GP9,ITGA2B,CD9,RASGRP2
## 2:           55    9                   PF4,CD9,ACTB,CD68
## 3:           79   18 GP9,ITGA2B,CD9,CD151,CD63,ICAM2,...
##
## $`5`
##                              pathway         pval        padj        ES
## 1:             CD4+ cytotoxic T cell 0.0000999900 0.002568843 0.8537503
## 2: Effector CD8+ memory T (Tem) cell 0.0000999900 0.002568843 0.8218874
## 3:      Megakaryocyte erythroid cell 0.0001004924 0.002568843 0.8644641
##         NES nMoreExtreme size                            leadingEdge
## 1: 2.269733            0   71    SPON2,GNLY,PRF1,PTGDS,GZMB,NKG7,...
## 2: 2.166913            0   62 SPON2,GNLY,GZMB,FGFBP2,KLRF1,KLRD1,...
## 3: 2.102014            0   23    GZMB,CD7,KLRB1,KLRD1,IL2RB,GZMA,...
##
## $`6`
##             pathway         pval        padj        ES      NES nMoreExtreme
## 1:      CD4+ T cell 0.0001014816 0.005206526 0.8985023 1.769758            0
## 2: Activated T cell 0.0004203005 0.008105796 0.8828033 1.651863            3
## 3:      CD8+ T cell 0.0003074085 0.006916692 0.8470356 1.641751            2
##    size                          leadingEdge
## 1:   14   IL7R,LTB,CD3E,CD3D,CD5,TNFRSF4,...
## 2:    9 CD3E,CD3D,TNFRSF4,CD3G,CD28,CD27,...
## 3:   12      IL7R,CD3E,CD3D,CD5,CD2,CD3G,...
##
## $`7`
##                              pathway       pval        padj        ES      NES
## 1:             CD4+ cytotoxic T cell 0.00009999 0.002383736 0.8720059 2.357424
## 2: Effector CD8+ memory T (Tem) cell 0.00009999 0.002383736 0.8328810 2.242414
## 3:               Natural killer cell 0.00010002 0.002383736 0.8444422 2.197239
##    nMoreExtreme size                           leadingEdge
## 1:            0   74   FGFBP2,GNLY,NKG7,CST7,GZMB,CTSW,...
## 2:            0   68 FGFBP2,GNLY,GZMB,GZMH,KLRF1,KLRD1,...
## 3:            0   41   GNLY,NKG7,GZMB,KLRF1,KLRD1,GZMA,...
##
## $`8`
##              pathway        pval      padj        ES      NES nMoreExtreme size
## 1: Follicular B cell 0.009812022 0.1706815 0.7917685 1.518359           94   11
##                           leadingEdge
## 1: MS4A1,CD24,CD40,CD22,PAX5,EBF1,...
##
## $`9`
##                  pathway         pval        padj        ES      NES
## 1:     Naive CD8+ T cell 0.0000999900 0.006053027 0.7754973 1.914284
## 2:     Naive CD4+ T cell 0.0001000500 0.006053027 0.8116887 1.887479
## 3: Central memory T cell 0.0007809885 0.019694812 0.9093896 1.701239
##    nMoreExtreme size                             leadingEdge
## 1:            0   73 CCR7,TCF7,PIK3IP1,LEF1,TRABD2A,LDHB,...
## 2:            0   29    CCR7,IL7R,TCF7,TSHZ2,TRABD2A,MAL,...
## 3:            6    6                     CCR7,IL7R,CD28,CD27
##
## $`10`
##                         pathway         pval        padj        ES      NES
## 1: Megakaryocyte erythroid cell 0.0001011122 0.008190091 0.8301819 1.653260
## 2:                 Myeloid cell 0.0001002406 0.008190091 0.7868515 1.611696
## 3:                Lymphoid cell 0.0016443988 0.053278520 0.8249257 1.598846
##    nMoreExtreme size                            leadingEdge
## 1:            0   16  FCGR3A,PECAM1,CD68,ITGAX,SPN,CD86,...
## 2:            0   23 FCGR3A,CSF1R,PECAM1,CD68,ITGAX,SPN,...
## 3:           15   12              FCGR3A,CD68,ITGAX,SPN,CD4
可视化基因集富集分析注释到的细胞类型。
new.cluster.ids <- unlist(lapply(res, function(x) {
    as.data.frame(x)[1, 1]
}))
alldata$cellmarker_gsea <- new.cluster.ids[as.character(alldata@active.ident)]

cowplot::plot_grid(ncol = 2, DimPlot(alldata, label = T, group.by = "ref_gsea") +
    NoAxes(), DimPlot(alldata, label = T, group.by = "cellmarker_gsea") + NoAxes())

基于以上分析,您认为这些预测方法可以很好的重叠吗?您在哪里看到最多的不一致之处?
在这种情况下,我们没有任何事实依据,也不能说“夹心法”效果最好。我们应该牢记,任何细胞类型分类方法都只是一种预测,我们仍然需要利用已有的生物学知识来判断预测结果是否有意义。
保存细胞类型预测的结果
saveRDS(ctrl, "data/results/ctrl13_qc_dr_int_cl_celltype.rds")
sessionInfo()
## R version 4.0.3 (2020-10-10)
## Platform: x86_64-apple-darwin13.4.0 (64-bit)
## Running under: macOS Catalina 10.15.5
##
## Matrix products: default
## BLAS/LAPACK: /Users/paulo.czarnewski/.conda/envs/scRNAseq2021/lib/libopenblasp-r0.3.12.dylib
##
## locale:
## [1] en_US.UTF-8/en_US.UTF-8/en_US.UTF-8/C/en_US.UTF-8/en_US.UTF-8
##
## attached base packages:
## [1] stats     graphics  grDevices utils     datasets  methods   base
##
## other attached packages:
##  [1] fgsea_1.16.0    caret_6.0-86    lattice_0.20-41 scPred_1.9.0
##  [5] rafalib_1.0.0   pheatmap_1.0.12 ggplot2_3.3.3   cowplot_1.1.1
##  [9] dplyr_1.0.3     venn_1.9        Seurat_3.2.3    RJSONIO_1.3-1.4
## [13] optparse_1.6.6
##
## loaded via a namespace (and not attached):
##   [1] fastmatch_1.1-0       plyr_1.8.6            igraph_1.2.6
##   [4] lazyeval_0.2.2        splines_4.0.3         BiocParallel_1.24.0
##   [7] listenv_0.8.0         scattermore_0.7       digest_0.6.27
##  [10] foreach_1.5.1         htmltools_0.5.1       fansi_0.4.2
##  [13] magrittr_2.0.1        tensor_1.5            cluster_2.1.0
##  [16] ROCR_1.0-11           limma_3.46.0          recipes_0.1.15
##  [19] globals_0.14.0        gower_0.2.2           matrixStats_0.57.0
##  [22] colorspace_2.0-0      ggrepel_0.9.1         xfun_0.20
##  [25] crayon_1.3.4          jsonlite_1.7.2        spatstat_1.64-1
##  [28] spatstat.data_1.7-0   survival_3.2-7        zoo_1.8-8
##  [31] iterators_1.0.13      glue_1.4.2            polyclip_1.10-0
##  [34] gtable_0.3.0          ipred_0.9-9           leiden_0.3.6
##  [37] kernlab_0.9-29        future.apply_1.7.0    abind_1.4-5
##  [40] scales_1.1.1          DBI_1.1.1             miniUI_0.1.1.1
##  [43] Rcpp_1.0.6            viridisLite_0.3.0     xtable_1.8-4
##  [46] reticulate_1.18       rsvd_1.0.3            stats4_4.0.3
##  [49] lava_1.6.8.1          prodlim_2019.11.13    htmlwidgets_1.5.3
##  [52] httr_1.4.2            getopt_1.20.3         RColorBrewer_1.1-2
##  [55] ellipsis_0.3.1        ica_1.0-2             pkgconfig_2.0.3
##  [58] farver_2.0.3          nnet_7.3-14           uwot_0.1.10
##  [61] deldir_0.2-9          tidyselect_1.1.0      labeling_0.4.2
##  [64] rlang_0.4.10          reshape2_1.4.4        later_1.1.0.1
##  [67] munsell_0.5.0         tools_4.0.3           cli_2.2.0
##  [70] generics_0.1.0        ggridges_0.5.3        evaluate_0.14
##  [73] stringr_1.4.0         fastmap_1.0.1         yaml_2.2.1
##  [76] goftest_1.2-2         ModelMetrics_1.2.2.2  knitr_1.30
##  [79] fitdistrplus_1.1-3    admisc_0.11           purrr_0.3.4
##  [82] RANN_2.6.1            pbapply_1.4-3         future_1.21.0
##  [85] nlme_3.1-151          mime_0.9              formatR_1.7
##  [88] compiler_4.0.3        beeswarm_0.2.3        plotly_4.9.3
##  [91] png_0.1-7             spatstat.utils_1.20-2 tibble_3.0.5
##  [94] stringi_1.5.3         highr_0.8             RSpectra_0.16-0
##  [97] Matrix_1.3-2          vctrs_0.3.6           pillar_1.4.7
## [100] lifecycle_0.2.0       lmtest_0.9-38         RcppAnnoy_0.0.18
## [103] data.table_1.13.6     irlba_2.3.3           httpuv_1.5.5
## [106] patchwork_1.1.1       R6_2.5.0              promises_1.1.1
## [109] KernSmooth_2.23-18    gridExtra_2.3         vipor_0.4.5
## [112] parallelly_1.23.0     codetools_0.2-18      MASS_7.3-53
## [115] assertthat_0.2.1      withr_2.4.0           sctransform_0.3.2
## [118] harmony_1.0           mgcv_1.8-33           parallel_4.0.3
## [121] grid_4.0.3            rpart_4.1-15          timeDate_3043.102
## [124] tidyr_1.1.2           class_7.3-17          rmarkdown_2.6
## [127] Rtsne_0.15            pROC_1.17.0.1         shiny_1.5.0
## [130] lubridate_1.7.9.2     ggbeeswarm_0.6.0
参考来源:https://nbisweden.github.io/workshop-scRNAseq/labs/compiled/seurat/seurat_06_celltype.html

