第五节:基因差异表达分析
在本节教程中,我们将介绍基因差异表达分析的相关知识。在单细胞数据分析中,差异表达分析可以具有多种功能,例如鉴定细胞群的标记基因,以及跨条件(健康与对照)比较的差异调节基因。
加载所需的R包和数据集
suppressPackageStartupMessages({library(Seurat)library(venn)library(dplyr)library(cowplot)library(ggplot2)library(pheatmap)library(enrichR)library(rafalib)})alldata <- readRDS("data/results/covid_qc_dr_int_cl.rds")
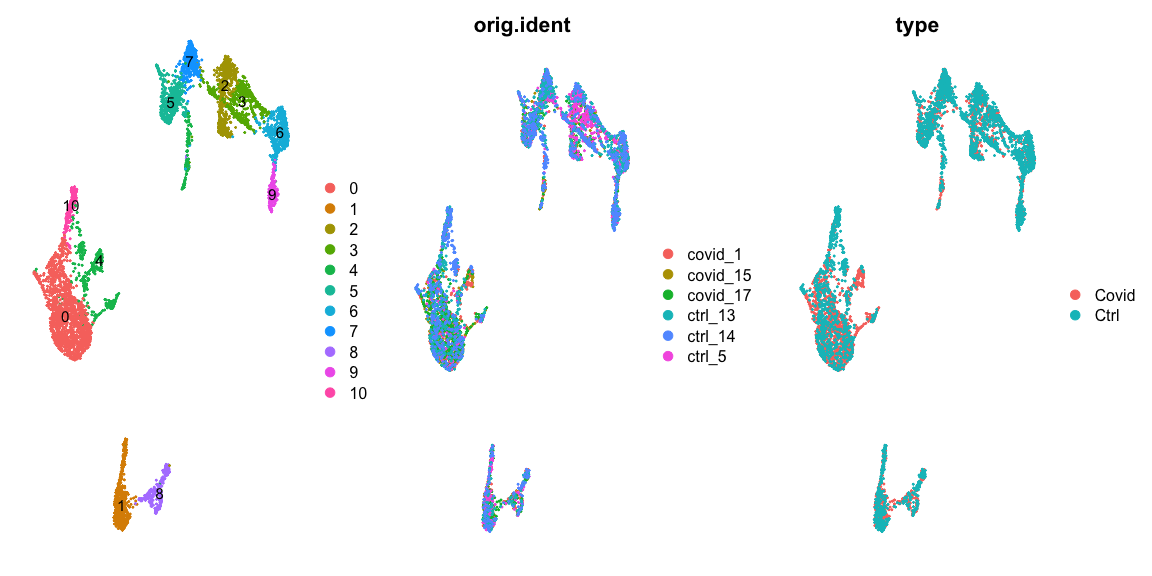
在这里,我们选定louvain图聚类在0.5的分辨率下的聚类分群结果进行后续的差异表达分析。
# Set the identity as louvain with resolution 0.5
sel.clust = "CCA_snn_res.0.5"

alldata <- SetIdent(alldata, value = sel.clust)
table(alldata@active.ident)
##    0    1    2    3    4    5    6    7    8    9   10
## 1453  570  528  494  487  470  446  400  240  230  214
# plot this clustering
plot_grid(ncol = 3, DimPlot(alldata, label = T) + NoAxes(), DimPlot(alldata, group.by = "orig.ident") +
    NoAxes(), DimPlot(alldata, group.by = "type") + NoAxes())
鉴定细胞标记基因
首先,我们计算出每个聚类簇中差异表达排名靠前的基因。我们可以选择不同的计算方法和参数,以完善差异分析的结果。当寻找marker基因时,我们想要筛选出那些在一种细胞类型中高表达而在其他类型中可能不表达的基因。
# Compute differentiall expression
# 使用FindAllMarkers函数计算每个cluster中的差异表达基因
markers_genes <- FindAllMarkers(alldata, logfc.threshold = 0.2, test.use = "wilcox", assay = "RNA",
                                min.pct = 0.1, min.diff.pct = 0.2, only.pos = TRUE, max.cells.per.ident = 50)
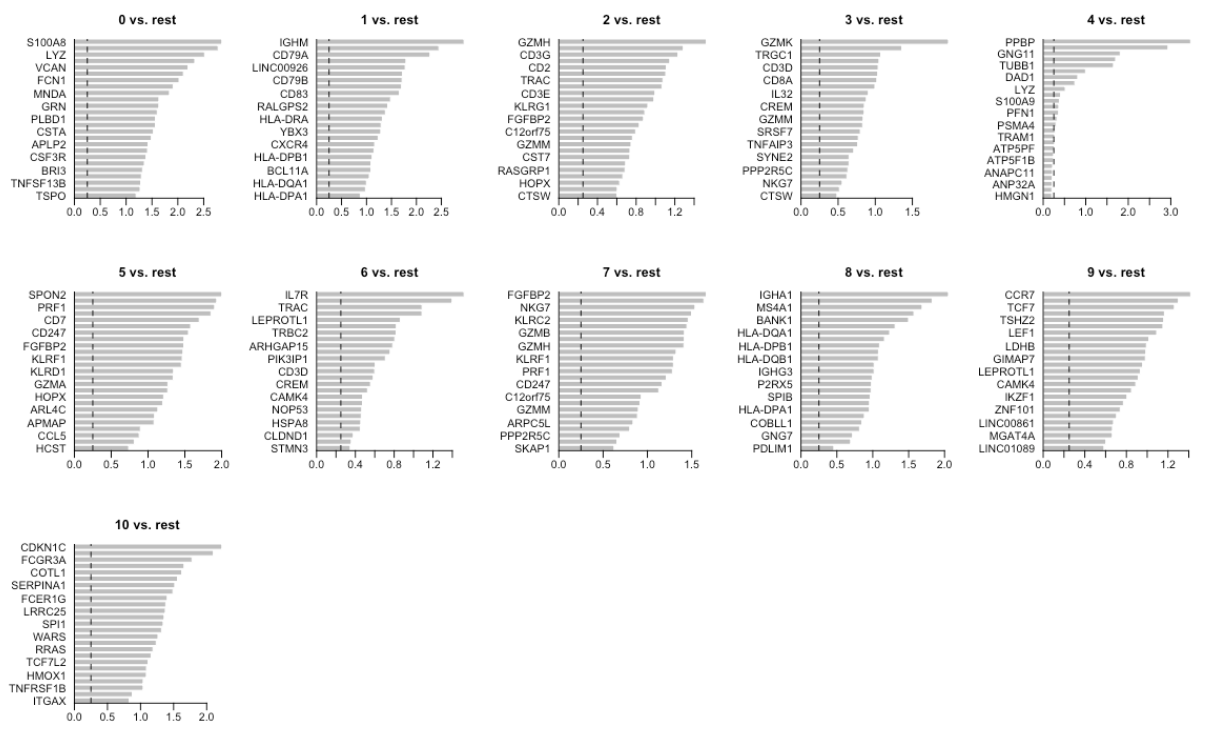
现在,我们可以选择前25个上调的基因进行可视化展示。
top25 <- markers_genes %>% group_by(cluster) %>% top_n(-25, p_val_adj)
top25
#  p_val    avg_logFC    pct.1    pct.2    p_val_adj    cluster    gene
#2.264061e-18    2.1968625    0.964    0.072    4.102704e-14    0    VCAN
#9.762285e-18    2.0240455    0.994    0.135    1.769024e-13    0    FCN1
#9.967076e-18    1.9095912    0.939    0.058    1.806134e-13    0    CD14
#1.105185e-17    2.5175223    1.000    0.260    2.002706e-13    0    LYZ
#2.277970e-17    1.4242183    0.972    0.336    4.127910e-13    0    APLP2
#2.570420e-17    2.7792763    0.997    0.343    4.657858e-13    0    S100A9
#3.653861e-17    1.2712956    0.884    0.097    6.621161e-13    0    MPEG1
#1.199814e-16    2.1078711    0.985    0.122    2.174182e-12    0    AC020656.1
#1.341305e-16    2.8514451    0.993    0.257    2.430579e-12    0    S100A8
#1.725826e-16    1.8378729    0.966    0.111    3.127369e-12    0    MNDA
绘制条形图
mypar(2, 5, mar = c(4, 6, 3, 1))
for (i in unique(top25$cluster)) {
    barplot(sort(setNames(top25$avg_logFC, top25$gene)[top25$cluster == i], F), horiz = T,
        las = 1, main = paste0(i, " vs. rest"), border = "white", yaxs = "i")
    abline(v = c(0, 0.25), lty = c(1, 2))
}
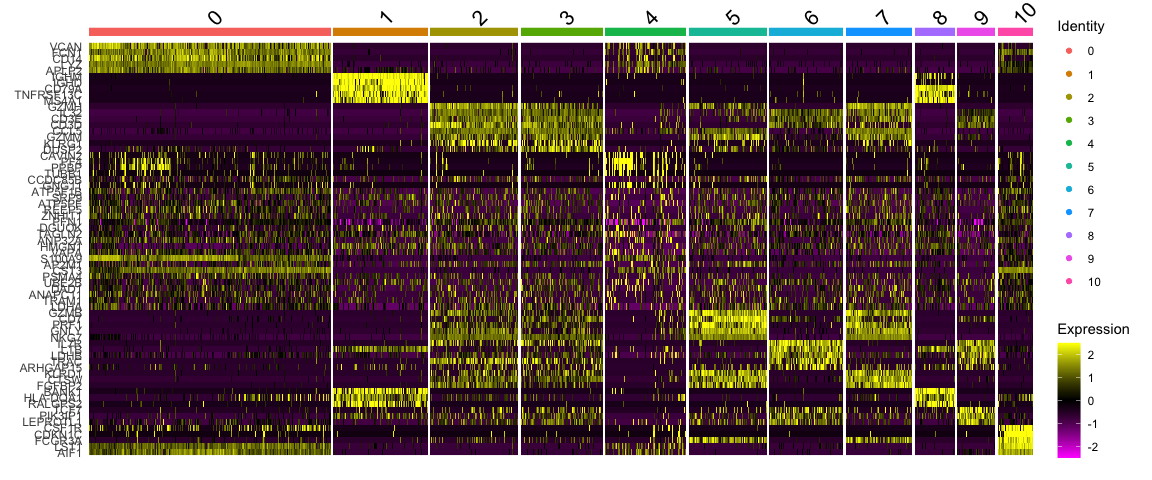
选择top5基因绘制热图
top5 <- markers_genes %>% group_by(cluster) %>% top_n(-5, p_val_adj)

# create a scale.data slot for the selected genes
alldata <- ScaleData(alldata, features = as.character(unique(top5$gene)), assay = "RNA")
DoHeatmap(alldata, features = as.character(unique(top5$gene)), group.by = sel.clust, assay = "RNA")
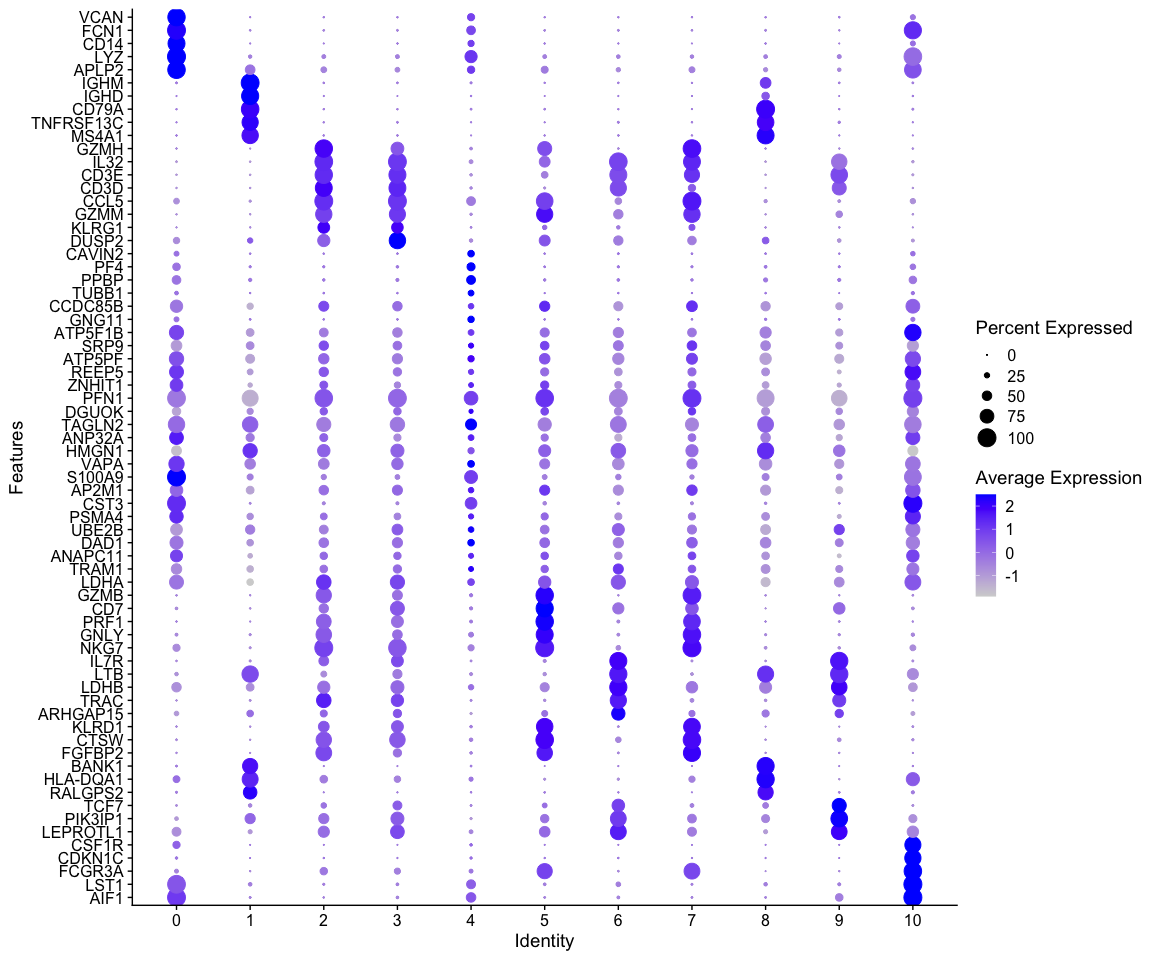
绘制气泡图
# 使用DotPlot函数绘制气泡图
DotPlot(alldata, features = rev(as.character(unique(top5$gene))), group.by = sel.clust,
    assay = "RNA") + coord_flip()
绘制小提琴图
# take top 3 genes per cluster/
top3 <- top5 %>% group_by(cluster) %>% top_n(-3, p_val)

# set pt.size to zero if you do not want all the points to hide the violin
# shapes, or to a small value like 0.1
VlnPlot(alldata, features = as.character(unique(top3$gene)), ncol = 5, group.by = sel.clust,
    assay = "RNA", pt.size = 0)
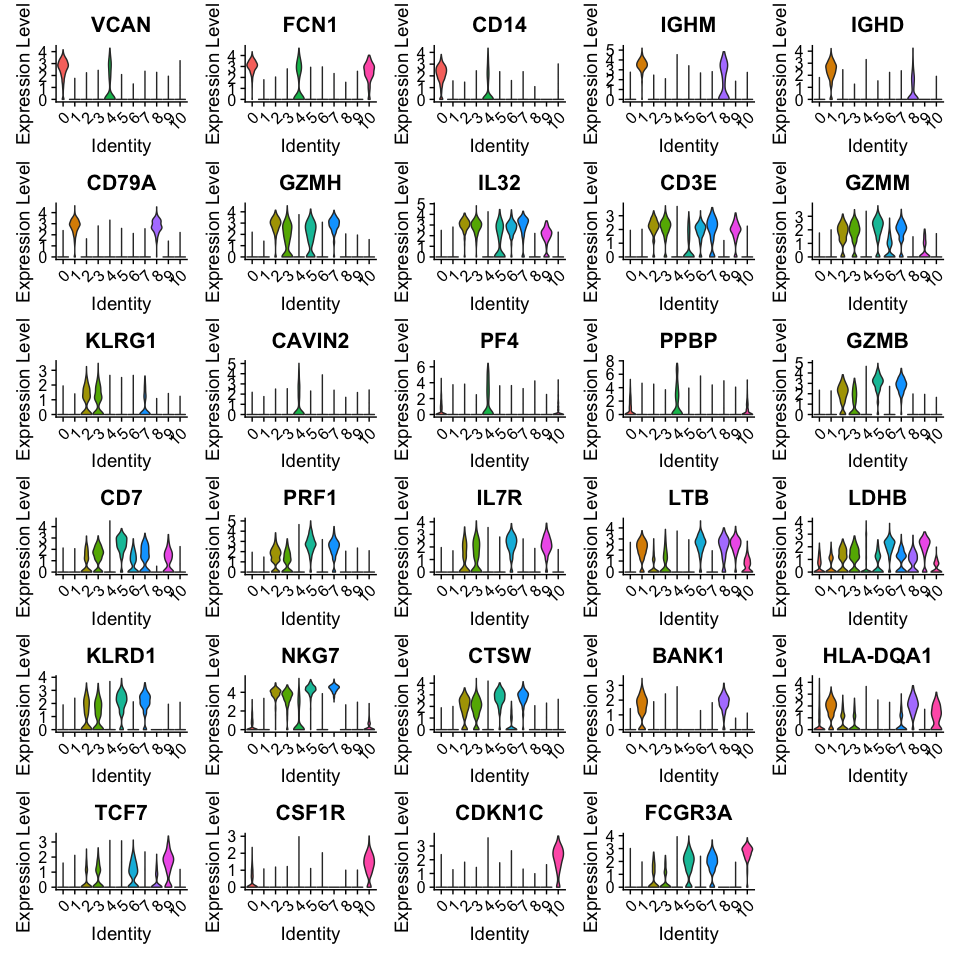
注意:针对以上差异分析内容,我们还可以选择不同的方法进行计算,如“wilcox”(Wilcoxon Rank Sum test), “bimod” (Likelihood-ratio test), “roc” (Identifies ‘markers’ of gene expression using ROC analysis),“t” (Student’s t-test),“negbinom” (negative binomial generalized linear model),“poisson” (poisson generalized linear model), “LR” (logistic regression), “MAST” (hurdle model), “DESeq2” (negative binomial distribution).
跨条件比较的差异表达分析
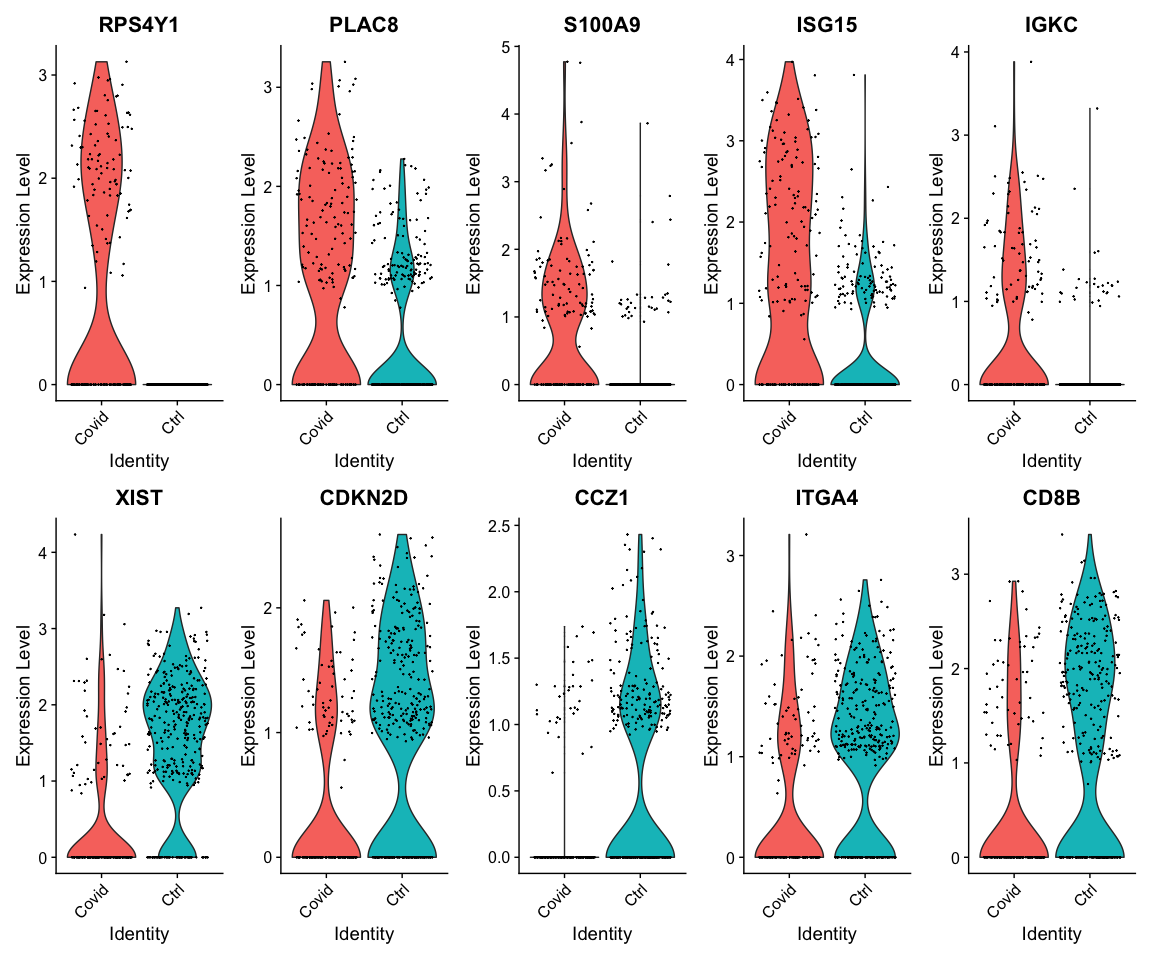
在我们的数据中,有来自患者和健康对照人群两大类,我们想知道在特定细胞类型中哪些基因的影响最大。因此,我们可以对Covid / Ctrl两组数据进行跨条件比较的差异表达分析。
# select all cells in cluster 2
cell_selection <- subset(alldata, cells = colnames(alldata)[alldata@meta.data[, sel.clust] ==  2])
cell_selection <- SetIdent(cell_selection, value = "type")

# Compute differentiall expression
DGE_cell_selection <- FindAllMarkers(cell_selection, logfc.threshold = 0.2, test.use = "wilcox",
    min.pct = 0.1, min.diff.pct = 0.2, only.pos = TRUE, max.cells.per.ident = 50,
    assay = "RNA")
绘制小提琴图查看差异基因的表达情况
top5_cell_selection <- DGE_cell_selection %>% group_by(cluster) %>% top_n(-5, p_val)

VlnPlot(cell_selection, features = as.character(unique(top5_cell_selection$gene)),
    ncol = 5, group.by = "type", assay = "RNA", pt.size = 0.1)
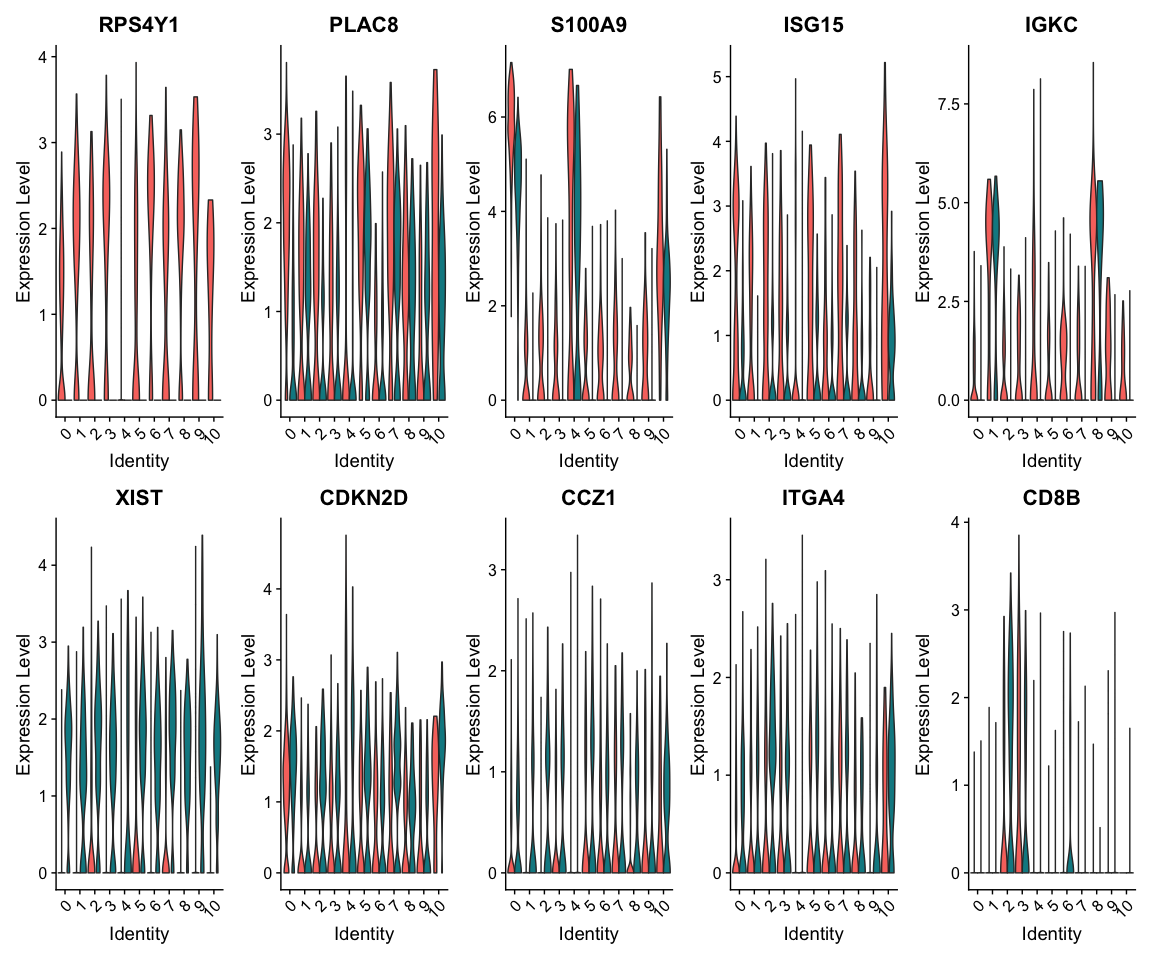
查看差异基因在所有cluster中的分组表达情况
VlnPlot(alldata, features = as.character(unique(top5_cell_selection$gene)), ncol = 5,
    split.by = "type", assay = "RNA", pt.size = 0)
基因集分析
超几何功能富集分析
当我们得到差异表达基因列表时,就可以使用超几何检验进行功能富集分析,这里我们使用enrichR包进行功能富集分析。
# Load additional packages
library(enrichR)

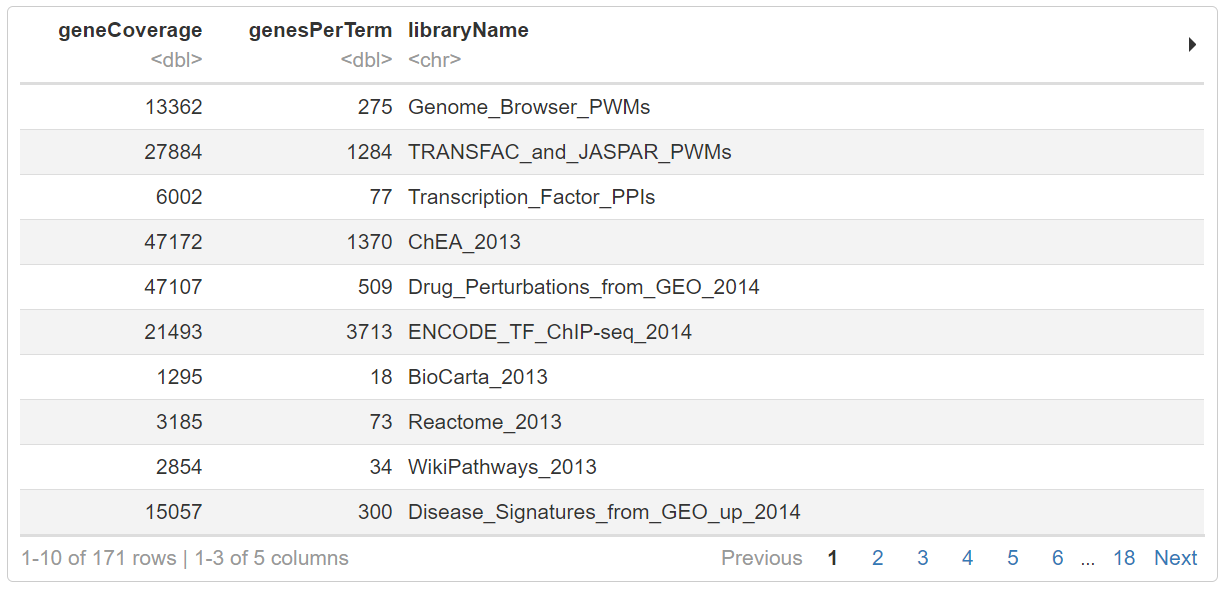
# Check available databases to perform enrichment (then choose one)
enrichR::listEnrichrDbs()
# Perform enrichment
enrich_results <- enrichr(genes = DGE_cell_selection$gene[DGE_cell_selection$cluster ==
    "Covid"], databases = "GO_Biological_Process_2017b")[[1]]
## Uploading data to Enrichr... Done.
##   Querying GO_Biological_Process_2017b... Done.
## Parsing results... Done.
一些感兴趣的数据库:
GO_Biological_Process_2017bKEGG_2019_HumanKEGG_2019_MouseWikiPathways_2019_HumanWikiPathways_2019_Mouse
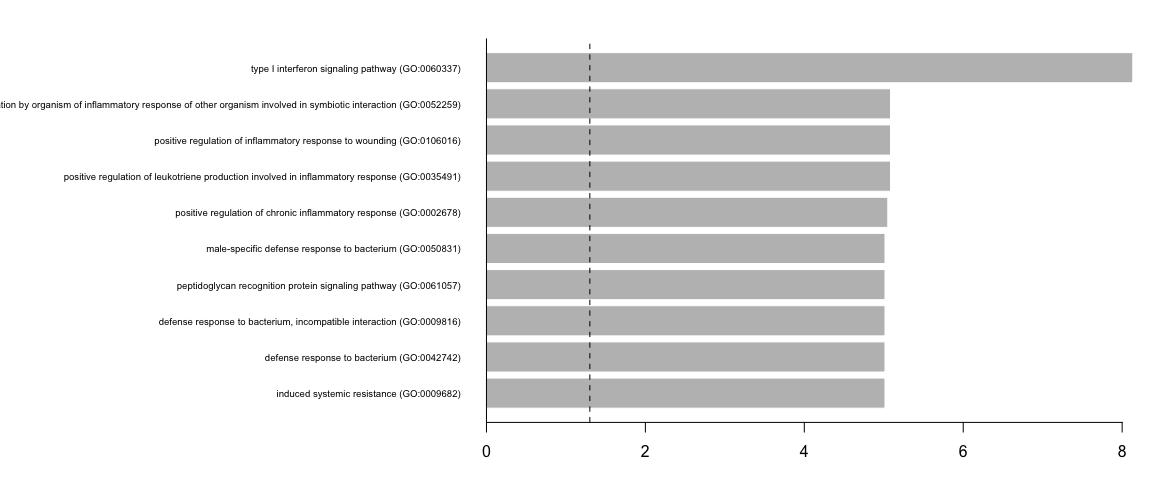
我们可以使用简单的条形图来可视化富集分析的结果
par(mfrow = c(1, 1), mar = c(3, 25, 2, 1))
barplot(height = -log10(enrich_results$P.value)[10:1], names.arg = enrich_results$Term[10:1],
    horiz = TRUE, las = 1, border = FALSE, cex.names = 0.6)
abline(v = c(-log10(0.05)), lty = 2)
abline(v = 0, lty = 1)
基因集富集分析(GSEA)
除了使用超几何检验进行富集分析外,我们还可以执行基因集富集分析(GSEA),该功能对排序后的基因列表(通常基于倍数变化)进行评分,并通过置换检验来计算某个特定的基因集是否显著的富集到上调的还是下调的基因中。
# 计算差异表达基因
DGE_cell_selection <- FindMarkers(cell_selection, ident.1 = "Covid", logfc.threshold = -Inf,
                                  test.use = "wilcox", min.pct = 0.1, min.diff.pct = 0, only.pos = FALSE, max.cells.per.ident = 50, assay = "RNA")

# Create a gene rank based on the gene expression fold change
# 根据差异倍数对基因进行排序
gene_rank <- setNames(DGE_cell_selection$avg_logFC, casefold(rownames(DGE_cell_selection), upper = T))
得到排好序的差异基因列表后,我们就可以对其进行基因集的富集分析。我们可以从分子特征数据库(MSigDB)中获取相应的基因集,这里以KEGG代谢通路富集为例。
# install.packages('msigdbr')
library(msigdbr)

# Download gene sets
msigdbgmt <- msigdbr::msigdbr("Homo sapiens")
msigdbgmt <- as.data.frame(msigdbgmt)

# List available gene sets
unique(msigdbgmt$gs_subcat)
##  [1] "MIR:MIR_Legacy"  "TFT:TFT_Legacy"  "CGP"             "TFT:GTRD"
##  [5] ""                "CP:BIOCARTA"     "CGN"             "GO:MF"
##  [9] "GO:BP"           "GO:CC"           "HPO"             "CP:KEGG"
## [13] "MIR:MIRDB"       "CM"              "CP"              "CP:PID"
## [17] "CP:REACTOME"     "CP:WIKIPATHWAYS"

# Subset which gene set you want to use.
msigdbgmt_subset <- msigdbgmt[msigdbgmt$gs_subcat == "CP:WIKIPATHWAYS", ]
gmt <- lapply(unique(msigdbgmt_subset$gs_name), function(x) {
    msigdbgmt_subset[msigdbgmt_subset$gs_name == x, "gene_symbol"]
})

names(gmt) <- unique(paste0(msigdbgmt_subset$gs_name, "_", msigdbgmt_subset$gs_exact_source))
接下来,我们进行GSEA富集分析。得到的结果中会包含多个不同代谢通路的富集情况,我们可以对这些通路进行排序和过滤,仅展示最重要的代谢通路。我们可以按p-value或NES值对它们进行排序和过滤。
library(fgsea)

# Perform enrichemnt analysis
fgseaRes <- fgsea(pathways = gmt, stats = gene_rank,
                  minSize = 15, maxSize = 500,  nperm = 10000)

fgseaRes <- fgseaRes[order(fgseaRes$RES, decreasing = T), ]

# Filter the results table to show only the top 10 UP or DOWN regulated processes
# (optional)
top10_UP <- fgseaRes$pathway[1:10]

# Nice summary table (shown as a plot)
dev.off()
plotGseaTable(gmt[top10_UP], gene_rank, fgseaRes, gseaParam = 0.5)
## "","p_val","avg_logFC","pct.1","pct.2","p_val_adj","cluster","gene"
## "VCAN",2.26406050074545e-18,2.19686246834267,0.964,0.072,4.10270403340083e-14,"0","VCAN"
## "FCN1",9.76228453901092e-18,2.02404548581854,0.994,0.135,1.76902358131417e-13,"0","FCN1"
## "CD14",9.96707632855414e-18,1.90959124343176,0.939,0.058,1.8061339014973e-13,"0","CD14"
## "LYZ",1.10518526809416e-17,2.51752231699128,1,0.26,2.00270622431342e-13,"0","LYZ"
## "APLP2",2.27797041995035e-17,1.42421829154358,0.972,0.336,4.12791019799203e-13,"0","APLP2"
## "S100A9",2.57041990836472e-17,2.77927631368357,0.997,0.343,4.6578579159477e-13,"0","S100A9"
## "MPEG1",3.65386053599734e-17,1.27129564857088,0.884,0.097,6.62116067728078e-13,"0","MPEG1"
## "AC020656.1",1.19981360229422e-16,2.10787107628474,0.985,0.122,2.17418222871735e-12,"0","AC020656.1"
## "S100A8",1.34130508577447e-16,2.8514451433658,0.993,0.257,2.43057894593192e-12,"0","S100A8"
## "MNDA",1.72582559901868e-16,1.83787286513408,0.966,0.111,3.12736856798175e-12,"0","MNDA"
## "CSTA",1.95052415941971e-16,1.52842274057699,0.953,0.082,3.53454482928446e-12,"0","CSTA"
## "TYMP",2.33058390521209e-16,1.60278457009931,0.981,0.296,4.22325109463483e-12,"0","TYMP"
## "S100A12",2.96694584422187e-16,2.32785948742408,0.939,0.069,5.37640256431445e-12,"0","S100A12"
## "NCF2",4.76129446813577e-16,1.29612848623007,0.913,0.098,8.62794170570882e-12,"0","NCF2"
## "S100A11",1.45270665495142e-15,1.48753121077731,0.991,0.46,2.63244972943746e-11,"0","S100A11"
## "PLBD1",1.7606666199921e-15,1.56695692268896,0.856,0.066,3.19050398208769e-11,"0","PLBD1"
## "TSPO",2.29679670794202e-15,1.1932694569082,0.986,0.563,4.16202531446173e-11,"0","TSPO"
## "TNFSF13B",2.7508922871735e-15,1.28293955643987,0.886,0.085,4.9848919135871e-11,"0","TNFSF13B"
## "BRI3",3.18917499088416e-15,1.31778444541193,0.988,0.452,5.77910400098119e-11,"0","BRI3"
## "GRN",5.60438207582128e-15,1.63288864506976,0.967,0.174,1.01557007595957e-10,"0","GRN"
## "CSF3R",8.43482246596123e-15,1.38474196303786,0.926,0.087,1.52847417905684e-10,"0","CSF3R"
## "DUSP6",9.00960709980655e-15,1.63444829183343,0.828,0.103,1.63263090255594e-10,"0","DUSP6"
## "SERPINA1",1.04571152790341e-14,1.35247892492229,0.971,0.115,1.89493385971377e-10,"0","SERPINA1"
## "MS4A6A",1.06273950651256e-14,1.56597113708651,0.932,0.063,1.92579025975142e-10,"0","MS4A6A"
## "CYBB",1.33277817727406e-14,1.41435759146114,0.953,0.159,2.41512733503832e-10,"0","CYBB"
## "CFP",1.85094570039818e-14,1.09123390164341,0.855,0.089,3.35409870369153e-10,"0","CFP"
## "IGSF6",2.15961777805468e-14,1.15146027588538,0.782,0.071,3.91344337561288e-10,"0","IGSF6"
## "TALDO1",2.21894474063566e-14,1.16470313175123,0.957,0.353,4.02094976450588e-10,"0","TALDO1"
## "CTSS",3.93304535224592e-14,1.67034752638023,0.998,0.57,7.12707148280483e-10,"0","CTSS"
## "NAMPT",4.06179589121295e-14,1.69262915955195,0.943,0.242,7.36038033446699e-10,"0","NAMPT"
## "TKT",5.33889287865753e-14,1.31633400735535,0.979,0.42,9.6746077854153e-10,"0","TKT"
## "AIF1",7.38214607324845e-14,1.45756262888725,0.992,0.18,1.33771868993335e-09,"0","AIF1"
## "LILRA5",1.26075588622411e-13,0.981857624374599,0.766,0.075,2.28461574142671e-09,"0","LILRA5"
## "FGL2",1.27635506727916e-13,1.34945590284596,0.917,0.138,2.31288301741656e-09,"0","FGL2"
## "TIMP2",1.59612347621965e-13,0.991012230366151,0.818,0.08,2.89233535125763e-09,"0","TIMP2"
## "MEGF9",1.59668377892485e-13,0.767342234766623,0.628,0.078,2.89335067578972e-09,"0","MEGF9"
## "CD68",2.09471521369e-13,1.16673787964521,0.93,0.123,3.79583343872765e-09,"0","CD68"
保存基因差异表达分析的结果
saveRDS(alldata, "data/3pbmc_qc_dr_int_cl_dge.rds")
write.csv(markers_genes)
sessionInfo()
## R version 4.0.3 (2020-10-10)
## Platform: x86_64-apple-darwin13.4.0 (64-bit)
## Running under: macOS Catalina 10.15.5
##
## Matrix products: default
## BLAS/LAPACK: /Users/paulo.czarnewski/.conda/envs/scRNAseq2021/lib/libopenblasp-r0.3.12.dylib
##
## locale:
## [1] en_US.UTF-8/en_US.UTF-8/en_US.UTF-8/C/en_US.UTF-8/en_US.UTF-8
##
## attached base packages:
## [1] stats     graphics  grDevices utils     datasets  methods   base
##
## other attached packages:
##  [1] fgsea_1.16.0    msigdbr_7.2.1   rafalib_1.0.0   enrichR_2.1
##  [5] pheatmap_1.0.12 ggplot2_3.3.3   cowplot_1.1.1   dplyr_1.0.3
##  [9] venn_1.9        Seurat_3.2.3    RJSONIO_1.3-1.4 optparse_1.6.6
##
## loaded via a namespace (and not attached):
##   [1] Rtsne_0.15            colorspace_2.0-0      rjson_0.2.20
##   [4] deldir_0.2-9          ellipsis_0.3.1        ggridges_0.5.3
##   [7] spatstat.data_1.7-0   farver_2.0.3          leiden_0.3.6
##  [10] listenv_0.8.0         getopt_1.20.3         ggrepel_0.9.1
##  [13] codetools_0.2-18      splines_4.0.3         knitr_1.30
##  [16] polyclip_1.10-0       jsonlite_1.7.2        ica_1.0-2
##  [19] cluster_2.1.0         png_0.1-7             uwot_0.1.10
##  [22] shiny_1.5.0           sctransform_0.3.2     compiler_4.0.3
##  [25] httr_1.4.2            assertthat_0.2.1      Matrix_1.3-2
##  [28] fastmap_1.0.1         lazyeval_0.2.2        limma_3.46.0
##  [31] later_1.1.0.1         formatR_1.7           admisc_0.11
##  [34] htmltools_0.5.1       tools_4.0.3           rsvd_1.0.3
##  [37] igraph_1.2.6          gtable_0.3.0          glue_1.4.2
##  [40] RANN_2.6.1            reshape2_1.4.4        fastmatch_1.1-0
##  [43] Rcpp_1.0.6            spatstat_1.64-1       scattermore_0.7
##  [46] vctrs_0.3.6           nlme_3.1-151          lmtest_0.9-38
##  [49] xfun_0.20             stringr_1.4.0         globals_0.14.0
##  [52] mime_0.9              miniUI_0.1.1.1        lifecycle_0.2.0
##  [55] irlba_2.3.3           goftest_1.2-2         future_1.21.0
##  [58] MASS_7.3-53           zoo_1.8-8             scales_1.1.1
##  [61] promises_1.1.1        spatstat.utils_1.20-2 parallel_4.0.3
##  [64] RColorBrewer_1.1-2    curl_4.3              yaml_2.2.1
##  [67] reticulate_1.18       pbapply_1.4-3         gridExtra_2.3
##  [70] rpart_4.1-15          stringi_1.5.3         BiocParallel_1.24.0
##  [73] rlang_0.4.10          pkgconfig_2.0.3       matrixStats_0.57.0
##  [76] evaluate_0.14         lattice_0.20-41       ROCR_1.0-11
##  [79] purrr_0.3.4           tensor_1.5            labeling_0.4.2
##  [82] patchwork_1.1.1       htmlwidgets_1.5.3     tidyselect_1.1.0
##  [85] parallelly_1.23.0     RcppAnnoy_0.0.18      plyr_1.8.6
##  [88] magrittr_2.0.1        R6_2.5.0              generics_0.1.0
##  [91] DBI_1.1.1             pillar_1.4.7          withr_2.4.0
##  [94] mgcv_1.8-33           fitdistrplus_1.1-3    survival_3.2-7
##  [97] abind_1.4-5           tibble_3.0.5          future.apply_1.7.0
## [100] crayon_1.3.4          KernSmooth_2.23-18    plotly_4.9.3
## [103] rmarkdown_2.6         grid_4.0.3            data.table_1.13.6
## [106] digest_0.6.27         xtable_1.8-4          tidyr_1.1.2
## [109] httpuv_1.5.5          munsell_0.5.0         viridisLite_0.3.0
参考来源:https://nbisweden.github.io/workshop-scRNAseq/labs/compiled/seurat/seurat_05_dge.html

