在本教程中,我们将学习使用Signac包进行DNA序列的motif富集分析。Signac包可以使用两种互补的方法进行motif分析:一种是通过在一组差异可及性peaks中找到overrepresented的基序motifs,另一种是在不同细胞组之间执行差异基序活性(motif activity)分析的方法。
安装并加载所需的R包
if (!requireNamespace("BiocManager", quietly = TRUE))install.packages("BiocManager")BiocManager::install("JASPAR2018")BiocManager::install("TFBSTools")library(Signac)library(Seurat)library(JASPAR2018)library(TFBSTools)library(BSgenome.Mmusculus.UCSC.mm10)library(patchwork)set.seed(1234)
加载所需的数据集
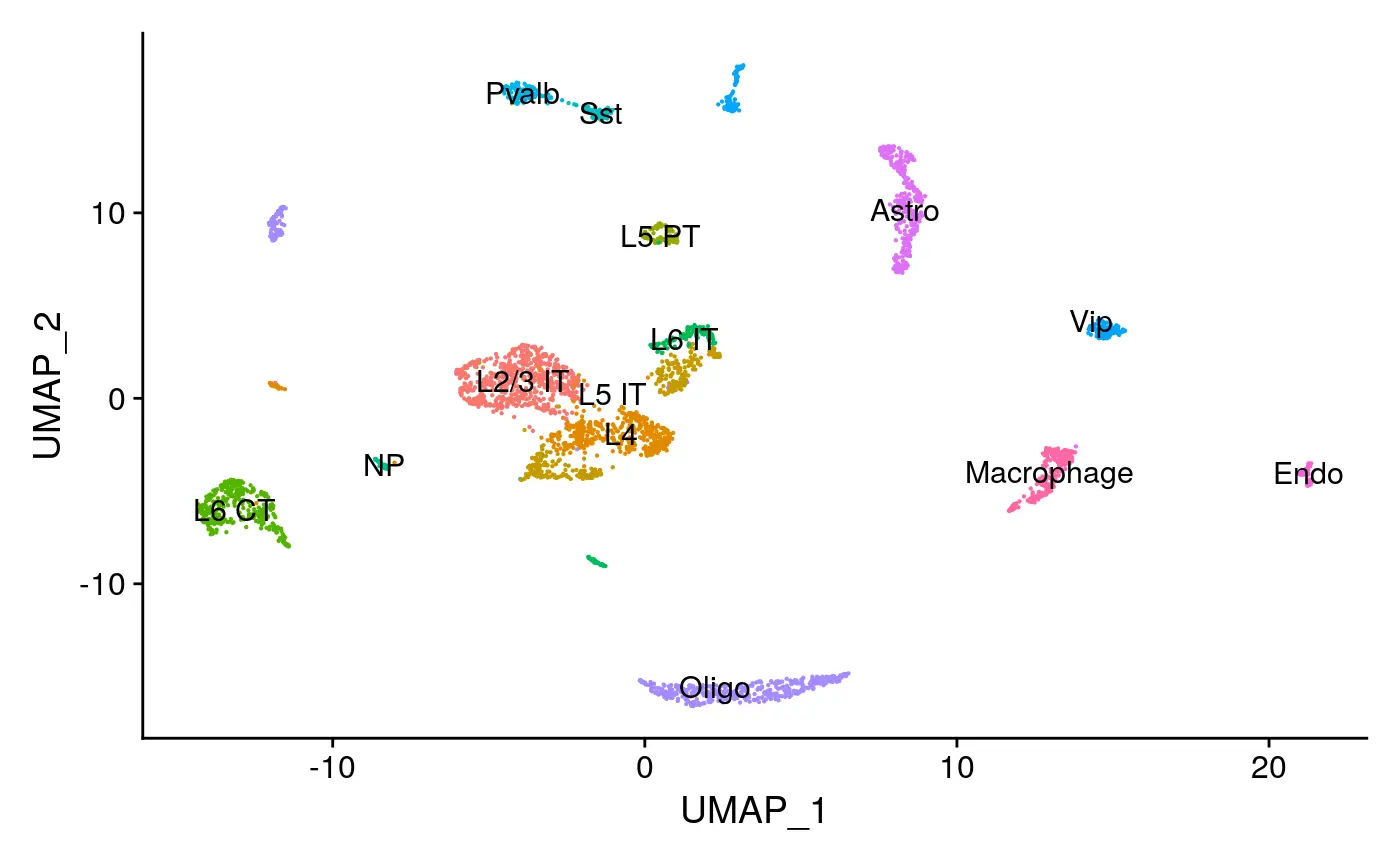
mouse_brain <- readRDS("../vignette_data/adult_mouse_brain.rds")mouse_brain## An object of class Seurat## 178653 features across 3503 samples within 2 assays## Active assay: peaks (157203 features, 157203 variable features)## 1 other assay present: RNA## 2 dimensional reductions calculated: lsi, umapp1 <- DimPlot(mouse_brain, label = TRUE, pt.size = 0.1) + NoLegend()p1

构建Motif类
为了有助于Signac进行motif富集分析,我们需要创建一个Motif类来存储所有必需的信息,其中包括位置权重矩阵(PWM)或位置频率矩阵(PFM)的列表以及motif出现矩阵。在这里,我们构造了一个Motif对象,并将其添加到我们的小鼠大脑数据集中。可以使用AddMotifObject函数将motif对象添加到Seurat对象的assay中:
# Get a list of motif position frequency matrices from the JASPAR database# 使用getMatrixSet函数从JASPAR数据库中提取Motif的PFM矩阵信息pfm <- getMatrixSet(x = JASPAR2018,opts = list(species = 9606, all_versions = FALSE))# Scan the DNA sequence of each peak for the presence of each motif# 使用CreateMotifMatrix函数构建Motif矩阵对象motif.matrix <- CreateMotifMatrix(features = StringToGRanges(rownames(mouse_brain), sep = c(":", "-")),pwm = pfm,genome = 'mm10',sep = c(":", "-"),use.counts = FALSE)# Create a new Mofif object to store the results# 使用CreateMotifObject函数构建Motif对象motif <- CreateMotifObject(data = motif.matrix,pwm = pfm)# Add the Motif object to the assay# 使用AddMotifObject函数将Motif类添加到Seurat对象中mouse_brain[['peaks']] <- AddMotifObject(object = mouse_brain[['peaks']],motif.object = motif)
为了找出overrepresented的motifs基序,我们还需要计算peaks的一些序列特征,例如GC含量,序列长度和二核苷酸频率。我们可以使用RegionStats函数计算这些信息,并将结果存储在Seurat对象的元数据中。
# 使用RegionStats函数计算peaks区域的序列特生mouse_brain <- RegionStats(object = mouse_brain,genome = BSgenome.Mmusculus.UCSC.mm10,sep = c(":", "-"))
Finding overrepresented motifs
为了鉴定出潜在的重要细胞类型特异性调控序列,我们可以富集出在不同细胞类型之间差异可及性的peaks中overrepresented的DNA基序。
这里,我们首先鉴定出Pvalb和Sst细胞类群之间的差异可及性peaks。然后,对它们进行一次超几何测试检验,以检验在给定频率下偶然观察到基序的可能性,并与GC含量匹配的背景峰进行比较。
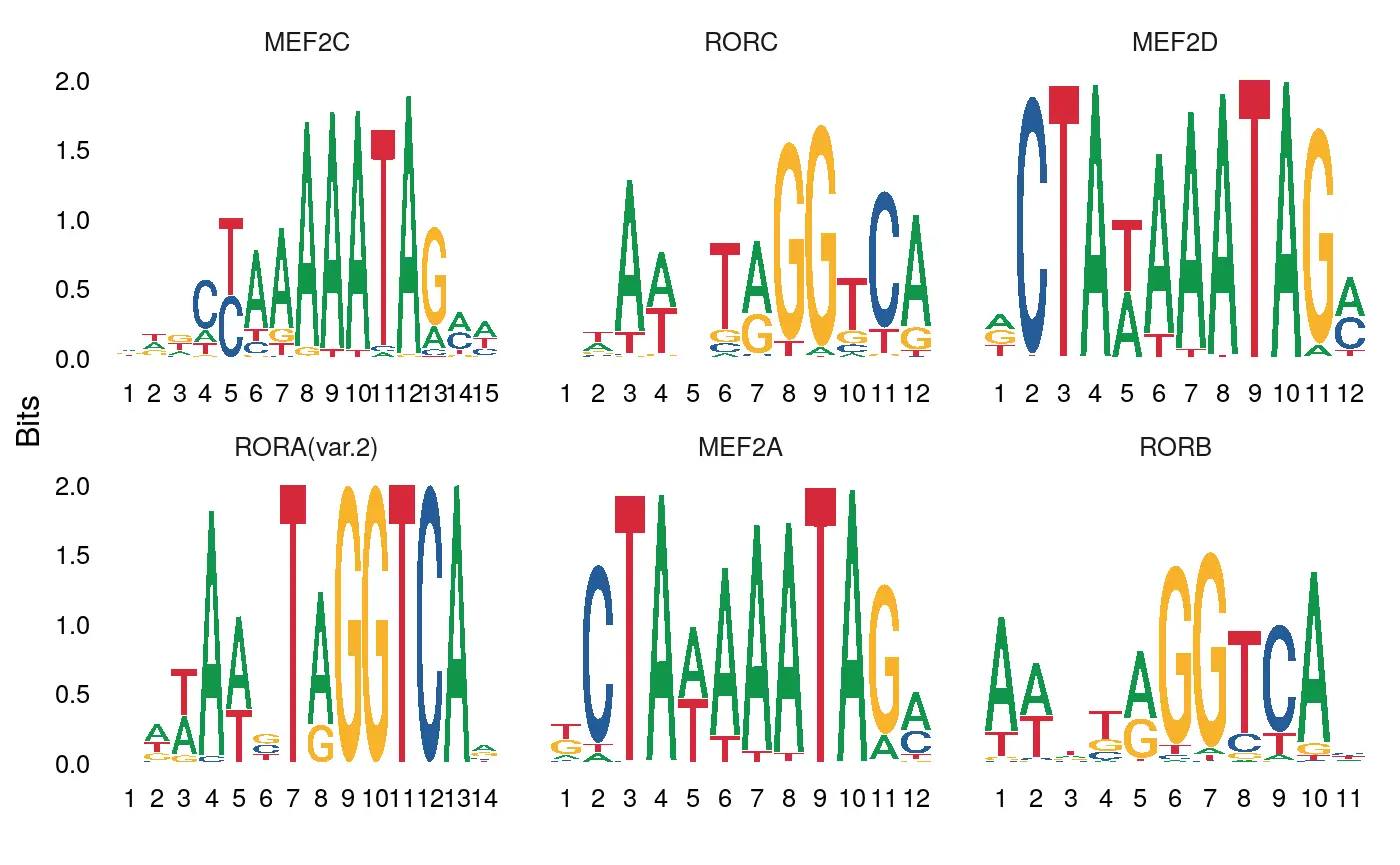
# 使用FindMarkers函数鉴定差异可及性peaksda_peaks <- FindMarkers(object = mouse_brain,ident.1 = 'Pvalb',ident.2 = 'Sst',only.pos = TRUE,test.use = 'LR',latent.vars = 'nCount_peaks')# Test the differentially accessible peaks for overrepresented motifs# 使用FindMotifs函数进行motif富集分析enriched.motifs <- FindMotifs(object = mouse_brain,features = head(rownames(da_peaks), 1000))# 查看motif富集分析的结果# sort by p-value and fold changeenriched.motifs <- enriched.motifs[order(enriched.motifs[, 7], -enriched.motifs[, 6]), ]head(enriched.motifs)## motif observed background percent.observed percent.background## MA0497.1 MA0497.1 431 9019 43.1 22.5475## MA1151.1 MA1151.1 226 3227 22.6 8.0675## MA0773.1 MA0773.1 304 5421 30.4 13.5525## MA0072.1 MA0072.1 218 3160 21.8 7.9000## MA0052.3 MA0052.3 315 5844 31.5 14.6100## MA1150.1 MA1150.1 211 3108 21.1 7.7700## fold.enrichment pvalue motif.name## MA0497.1 1.911520 1.549646e-48 MEF2C## MA1151.1 2.801363 5.818264e-47 RORC## MA0773.1 2.243129 1.365161e-44 MEF2D## MA0072.1 2.759494 4.091607e-44 RORA(var.2)## MA0052.3 2.156057 6.539737e-43 MEF2A## MA1150.1 2.715573 1.600301e-41 RORB
我们还可以使用MotifPlot函数绘制motif的位置权重矩阵,可视化不同的motif序列。
MotifPlot(object = mouse_brain,motifs = head(rownames(enriched.motifs)))

Computing motif activities
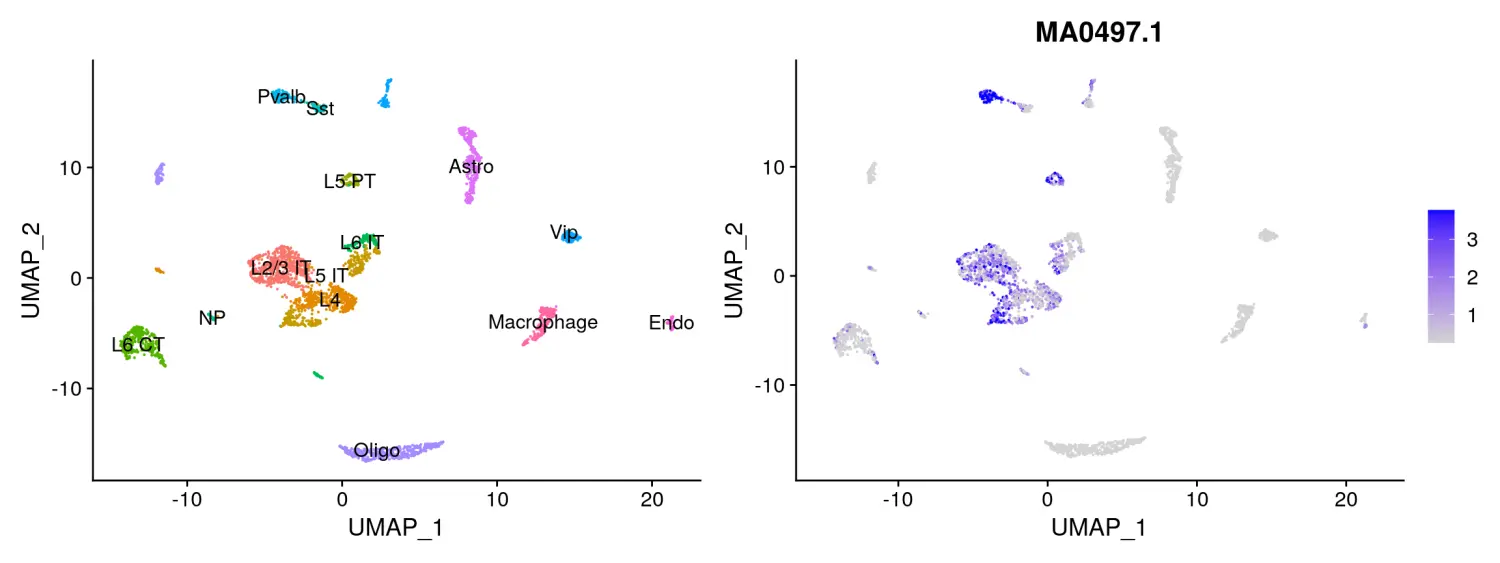
我们还可以通过运行chromVAR计算每个细胞的基序活性得分(motif activity score),这样我们可以查看每个细胞的motif activities,并且还提供了一种识别细胞类型之间差异激活的基序的替代方法。ChromVAR可识别与细胞之间染色质可及性变异相关的基序,有关该方法的完整说明,请参见chromVAR的说明文档。
# 使用RunChromVAR函数计算所有细胞中的motif activitiesmouse_brain <- RunChromVAR(object = mouse_brain,genome = BSgenome.Mmusculus.UCSC.mm10)DefaultAssay(mouse_brain) <- 'chromvar'# look at the activity of Mef2c, the top hit from the overrepresentation testingp2 <- FeaturePlot(object = mouse_brain,features = rownames(enriched.motifs)[[1]],min.cutoff = 'q10',max.cutoff = 'q90',pt.size = 0.1)p1 + p2

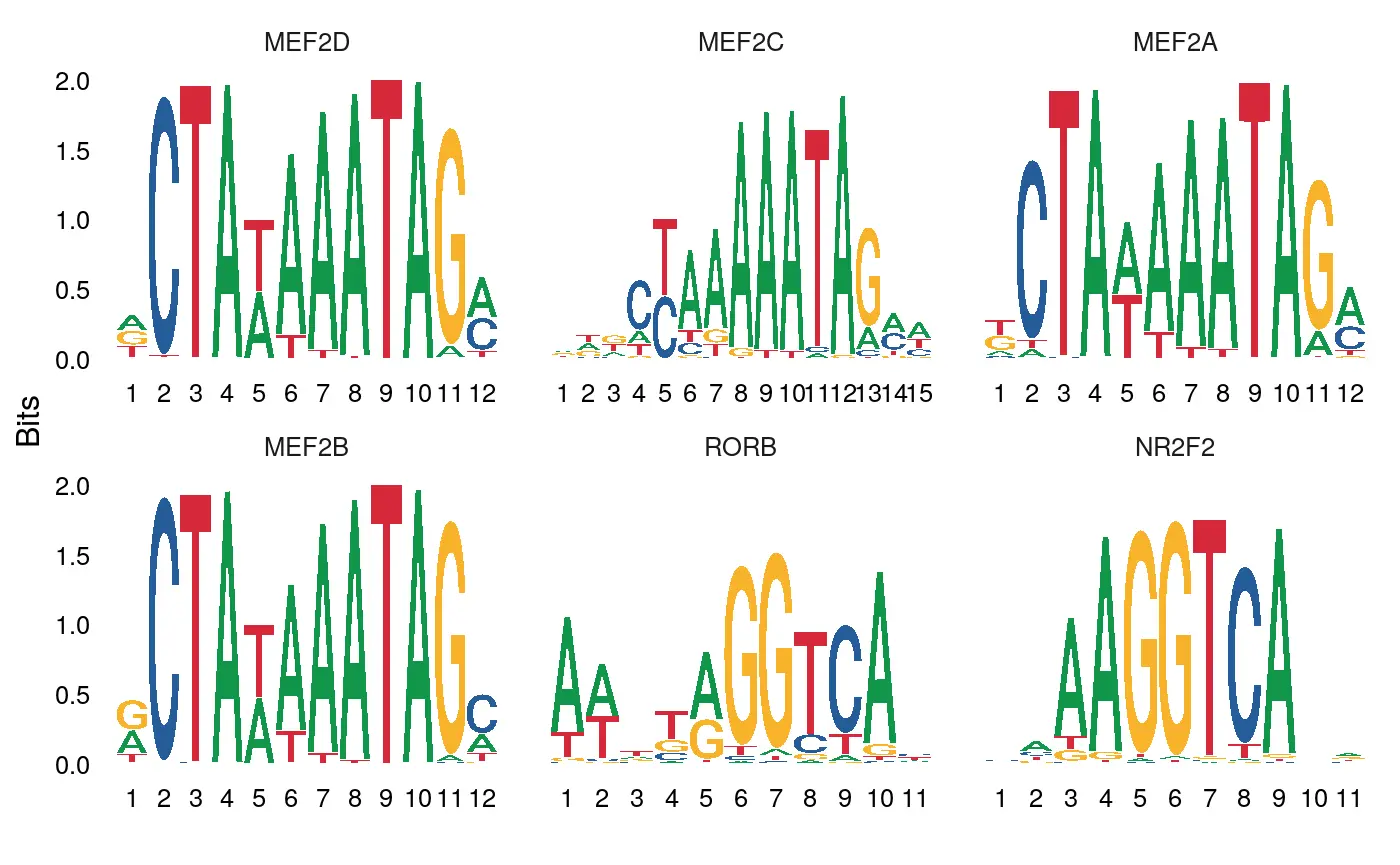
我们还可以直接测试不同细胞类型之间motif的差异活性得分,这和对不同细胞类型之间的差异可及性peaks进行富集测试的结果相类似。
differential.activity <- FindMarkers(object = mouse_brain,ident.1 = 'Pvalb',ident.2 = 'Sst',only.pos = TRUE,test.use = 'LR',latent.vars = 'nCount_peaks')# 使用MotifPlot函数对富集到的motif进行可视化MotifPlot(object = mouse_brain,motifs = head(rownames(differential.activity)),assay = 'peaks')

参考来源:https://satijalab.org/signac/articles/motif_vignette.html

