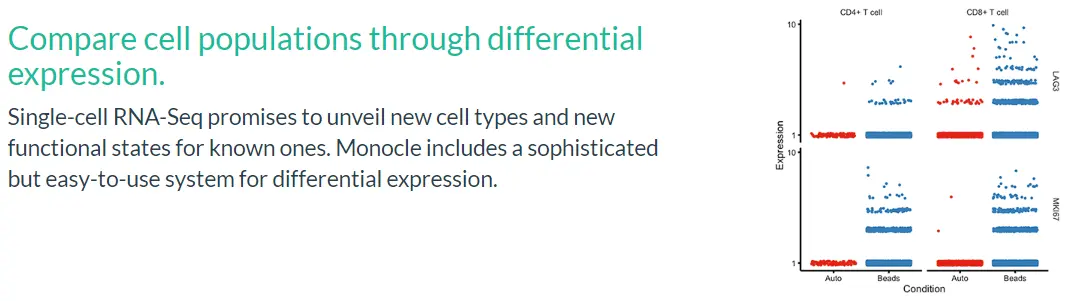
差异基因表达分析是RNA-Seq实验中的常见任务,Monocle2可以帮助我们找到在不同组细胞之间差异表达的基因,并评估这些基因差异表达变化的统计学意义。
Basic Differential Analysis
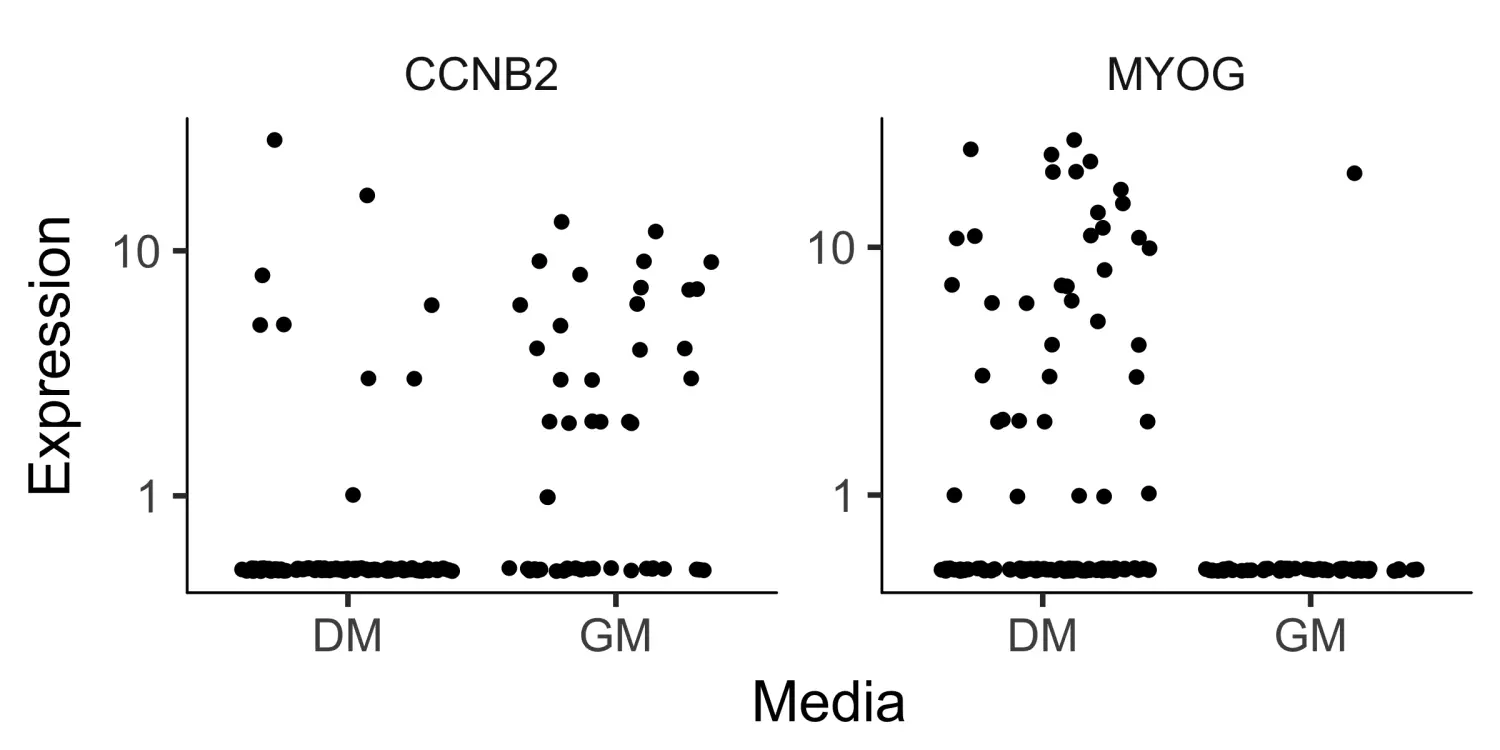
这里,我们查看成肌细胞(myogenesis)数据在不同培养条件下的差异表达基因。
# 选择myogenesis相关的基因集marker_genes <- row.names(subset(fData(HSMM_myo),gene_short_name %in% c("MEF2C", "MEF2D", "MYF5","ANPEP", "PDGFRA","MYOG","TPM1", "TPM2", "MYH2","MYH3", "NCAM1", "TNNT1","TNNT2", "TNNC1", "CDK1","CDK2", "CCNB1", "CCNB2","CCND1", "CCNA1", "ID1")))# 使用differentialGeneTest函数对myogenesis基因集中的基因进行差异表达分析diff_test_res <- differentialGeneTest(HSMM_myo[marker_genes,],fullModelFormulaStr = "~Media")# Select genes that are significant at an FDR < 10%# 筛选显著的差异表达基因sig_genes <- subset(diff_test_res, qval < 0.1)# 对marker基因的表达进行可视化MYOG_ID1 <- HSMM_myo[row.names(subset(fData(HSMM_myo),gene_short_name %in% c("MYOG", "CCNB2"))),]plot_genes_jitter(MYOG_ID1,grouping = "Media",ncol= 2)
Finding Genes that Distinguish Cell Type or State
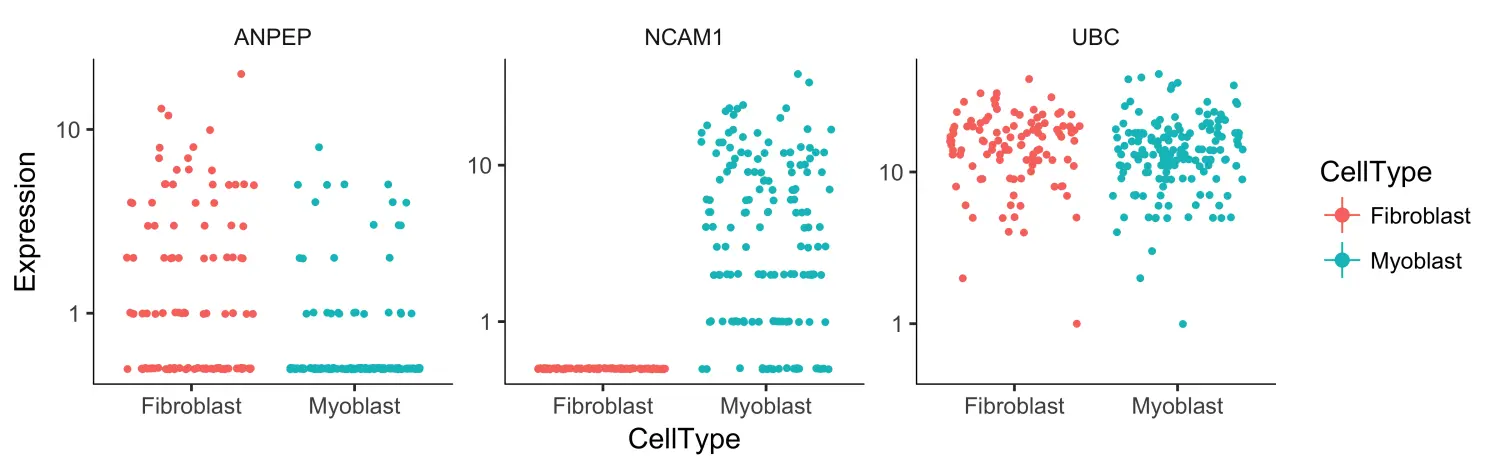
接下来,我们根据几个关键的marker基因将成肌细胞(myoblasts)与成纤维细胞(fibroblasts)区分开来,使用Monocle2查看成纤维细胞和成肌细胞之间差异表达的基因。
# 选择marker基因to_be_tested <- row.names(subset(fData(HSMM),gene_short_name %in% c("UBC", "NCAM1", "ANPEP")))cds_subset <- HSMM[to_be_tested,]# 使用differentialGeneTest函数对不同细胞类型进行差异表达分析diff_test_res <- differentialGeneTest(cds_subset,fullModelFormulaStr = "~CellType")diff_test_res[,c("gene_short_name", "pval", "qval")]# 基因表达可视化plot_genes_jitter(cds_subset,grouping = "CellType",color_by = "CellType",nrow= 1,ncol = NULL,plot_trend = TRUE)
Finding Genes that Change as a Function of Pseudotime
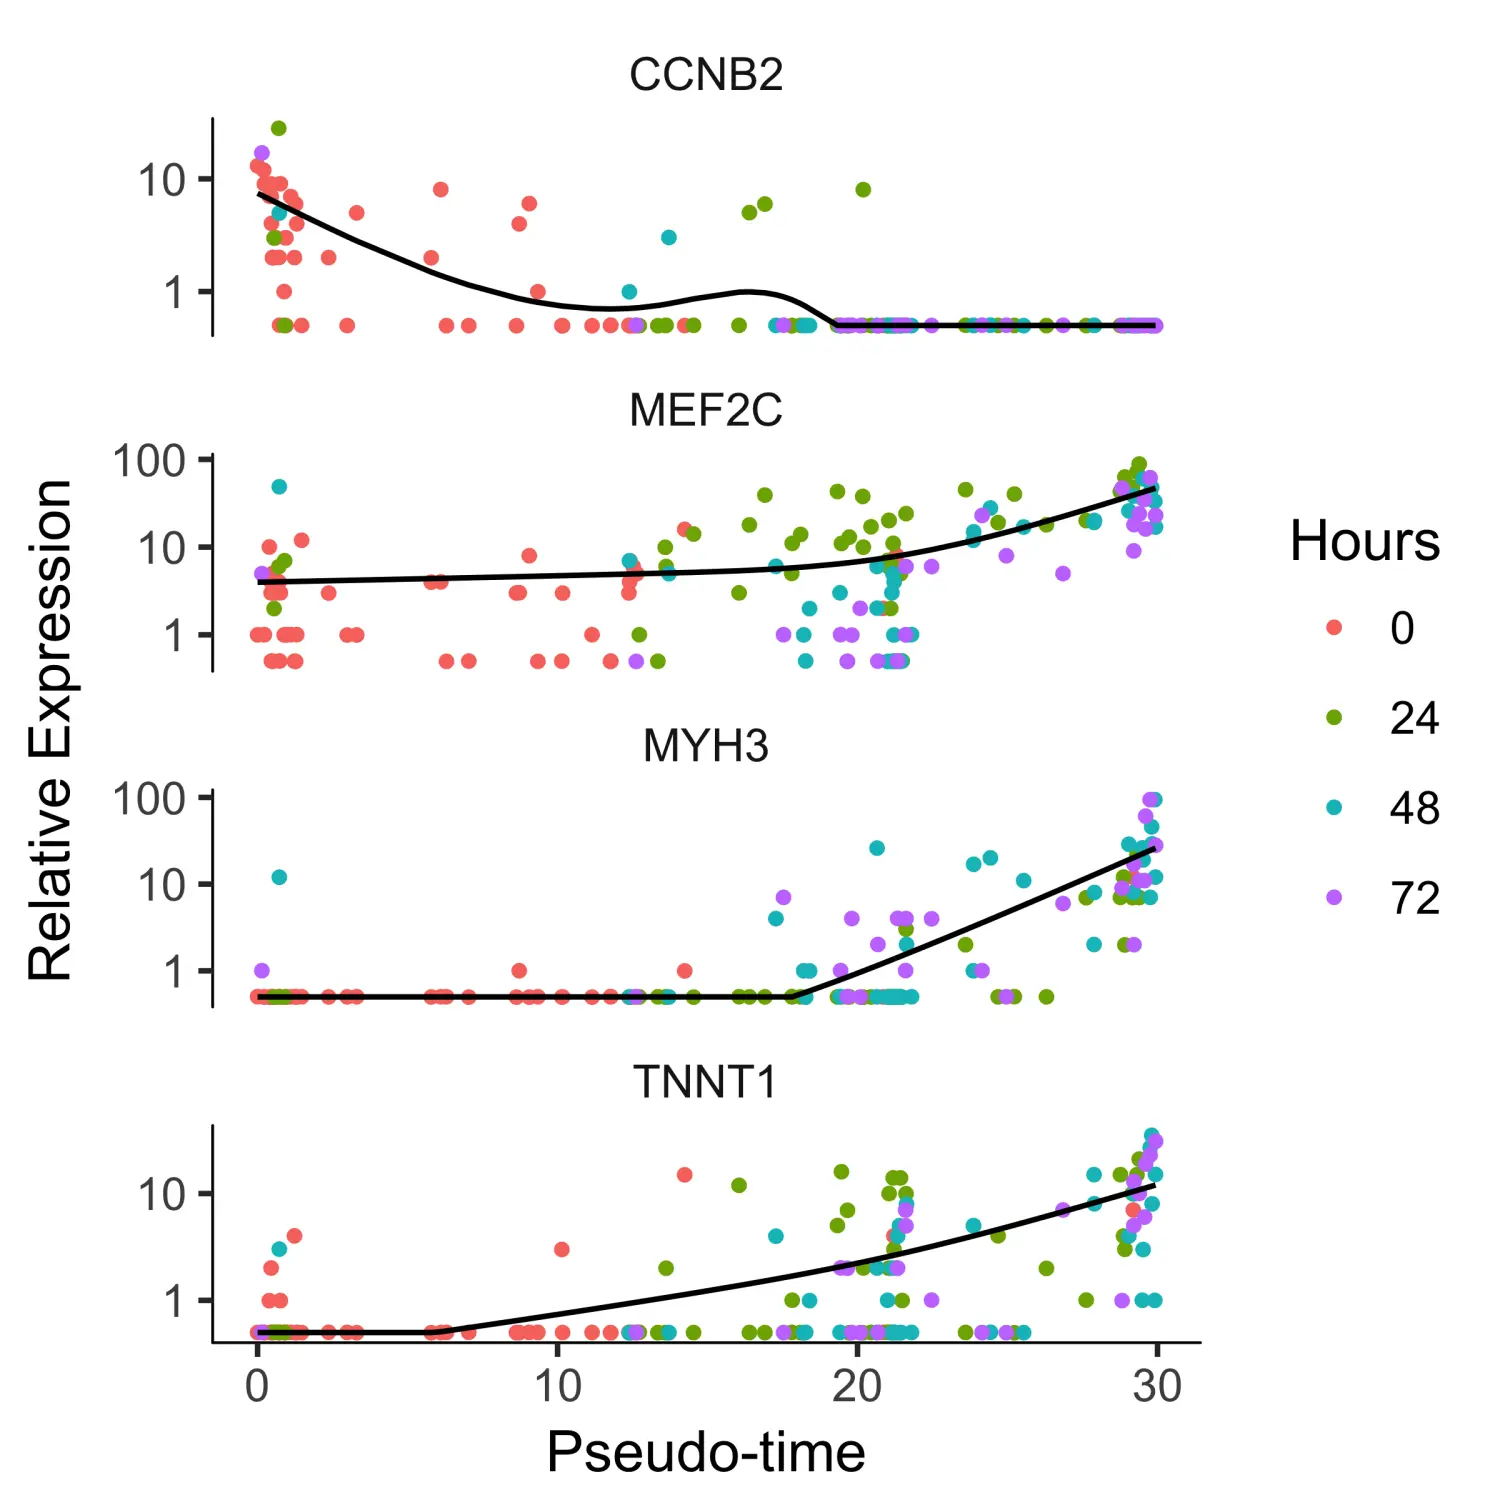
Monocle2还可以基于拟时序分析的结果查看随着细胞进展而变化的基因。同样,我们需要指定用于差异分析的模型。这个模型比我们之前用来查看CellType之间差异的模型要复杂一些。Monocle2为每个细胞分配一个“伪时间”值,该值记录了其在实验过程中的进度。Monocle2使用VGAM软件包将基因的表达水平建模为伪时间的平滑非线性函数。
to_be_tested <- row.names(subset(fData(HSMM),gene_short_name %in% c("MYH3", "MEF2C", "CCNB2", "TNNT1")))cds_subset <- HSMM_myo[to_be_tested,]# 使用differentialGeneTest函数进行差异表达分析diff_test_res <- differentialGeneTest(cds_subset,fullModelFormulaStr = "~sm.ns(Pseudotime)")# 使用plot_genes_in_pseudotime函数对基因的表达水平进行可视化plot_genes_in_pseudotime(cds_subset,color_by = "Hours")
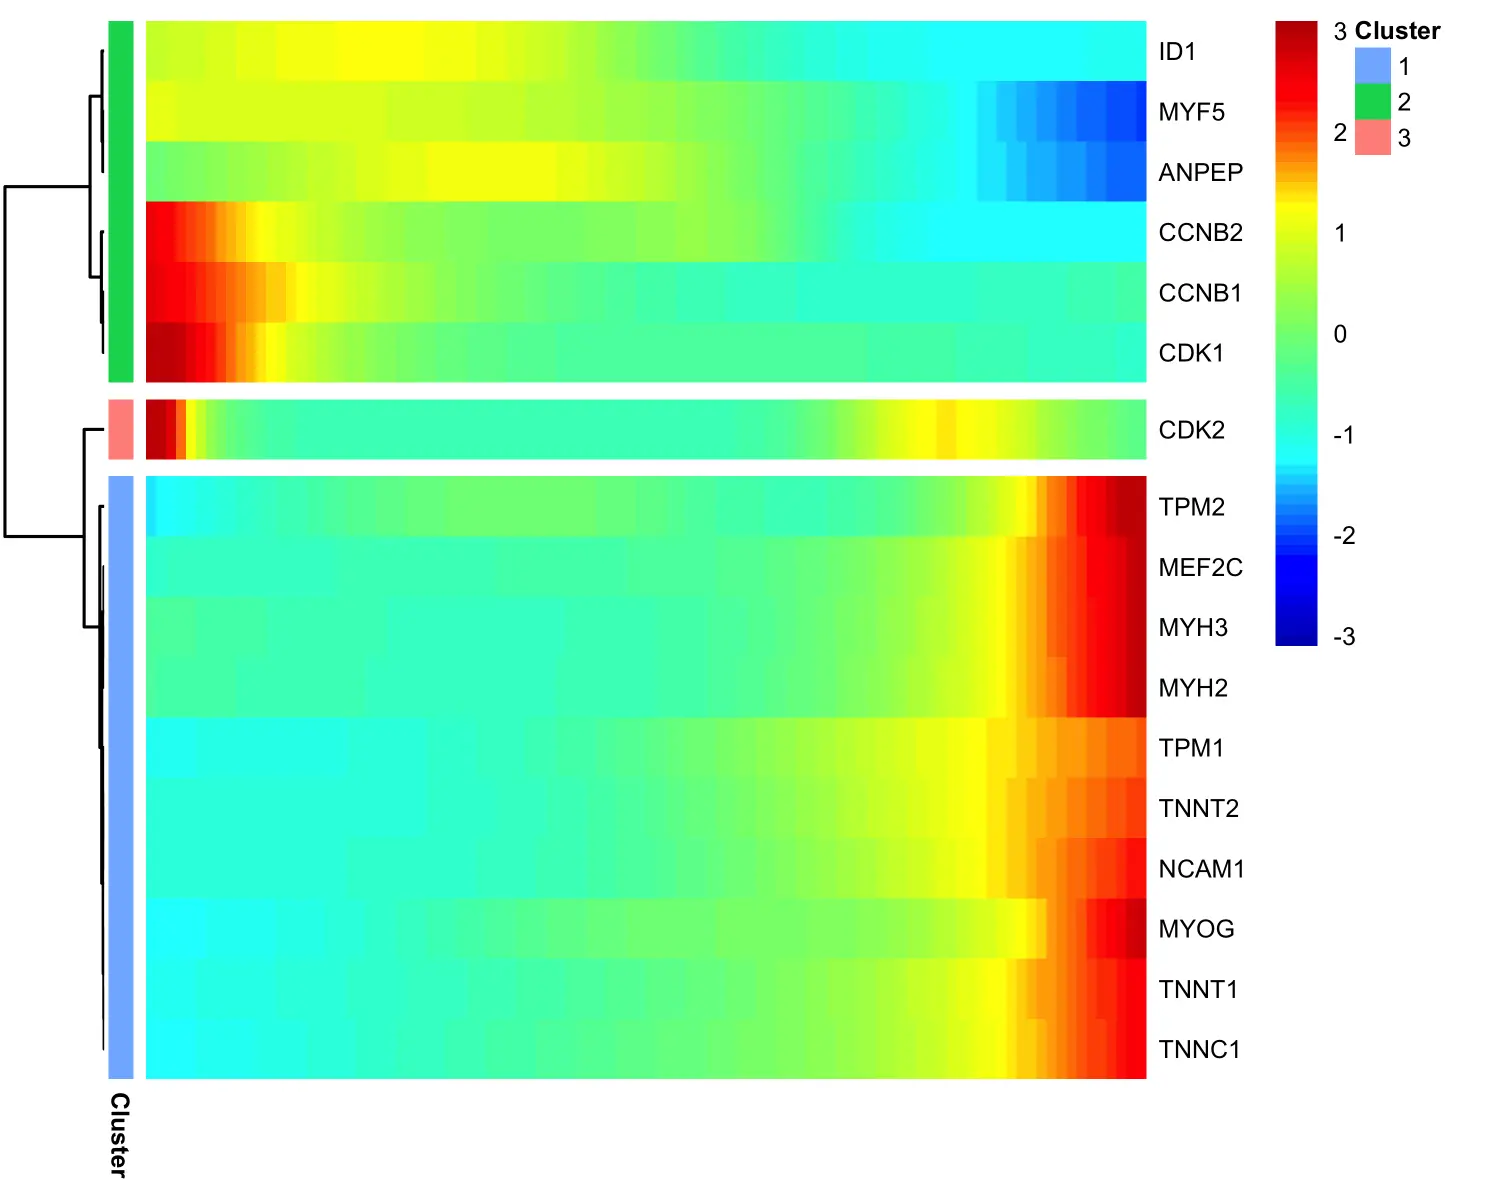
Clustering Genes by Pseudotemporal Expression Pattern
Monocle2可以对具有相似表达趋势的基因进行分组,并对其进行可视化展示。Monocle2使用plot_pseudotime_heatmap函数基于CellDataSet对象(通常仅包含重要基因的子集)生成平滑的表达曲线,类似于plot_genes_in_pseudotime函数。然后,将这些基因进行聚类,并使用pheatmap包对其进行热图绘制。
# 差异表达分析diff_test_res <- differentialGeneTest(HSMM_myo[marker_genes,],fullModelFormulaStr = "~sm.ns(Pseudotime)")# 选择显著的差异基因sig_gene_names <- row.names(subset(diff_test_res, qval < 0.1))# 使用plot_pseudotime_heatmap函数进行聚类分组可视化plot_pseudotime_heatmap(HSMM_myo[sig_gene_names,],num_clusters = 3,cores = 1,show_rownames = T)
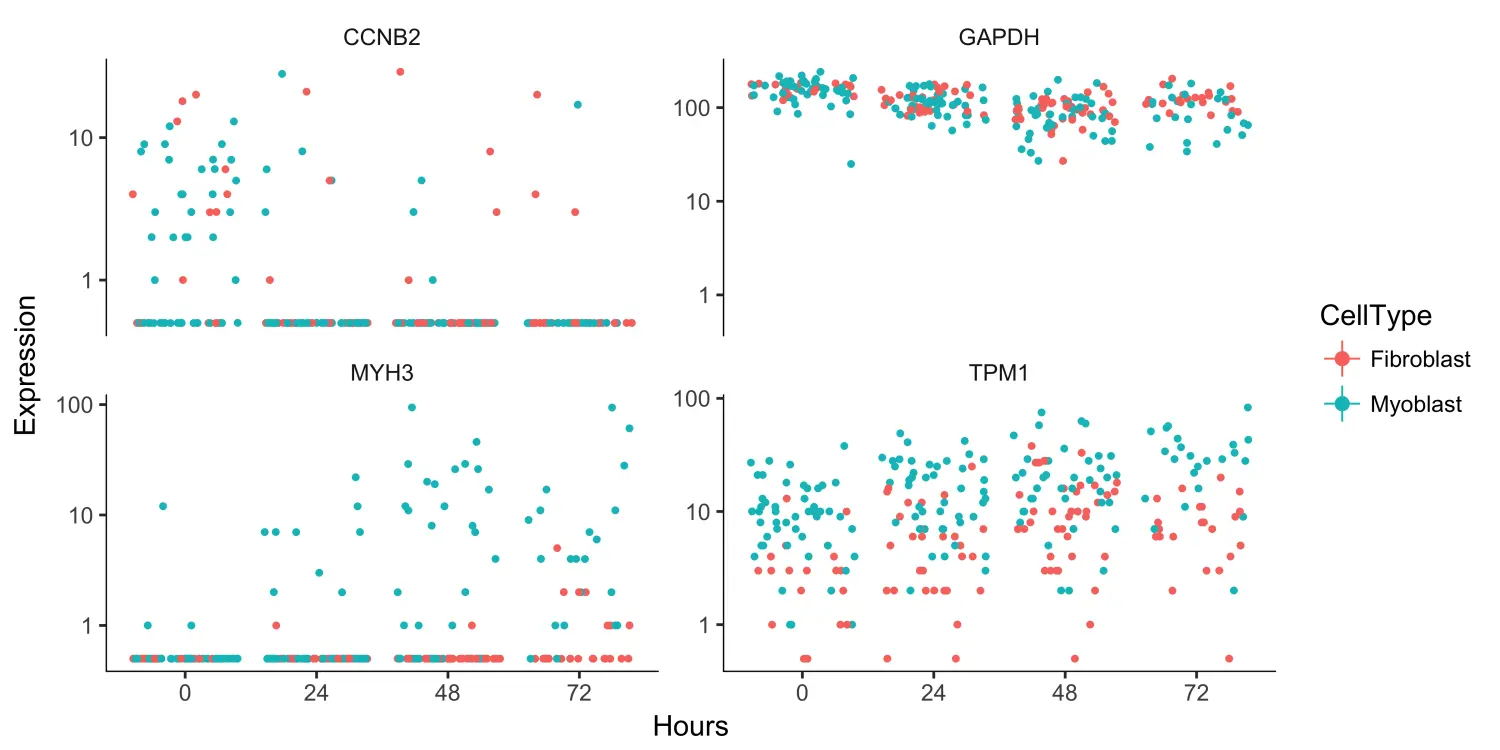
Multi-Factorial Differential Expression Analysis
Monocle2还可以在存在多种因素的情况下执行差异表达分析,这可以帮助我们减去某些因素以查看其他因素的影响。为此,我们必须同时指定完整模型和简化模型。这里,我们指定完整模型捕获CellType和Hours的效果,而简化模型仅捕获Hours的影响。
to_be_tested <- row.names(subset(fData(HSMM),gene_short_name %in% c("TPM1", "MYH3", "CCNB2", "GAPDH")))cds_subset <- HSMM[to_be_tested,]diff_test_res <- differentialGeneTest(cds_subset,fullModelFormulaStr = "~CellType + Hours",reducedModelFormulaStr = "~Hours")plot_genes_jitter(cds_subset,grouping = "Hours",color_by = "CellType",plot_trend = TRUE) +facet_wrap( ~ feature_label, scales= "free_y")
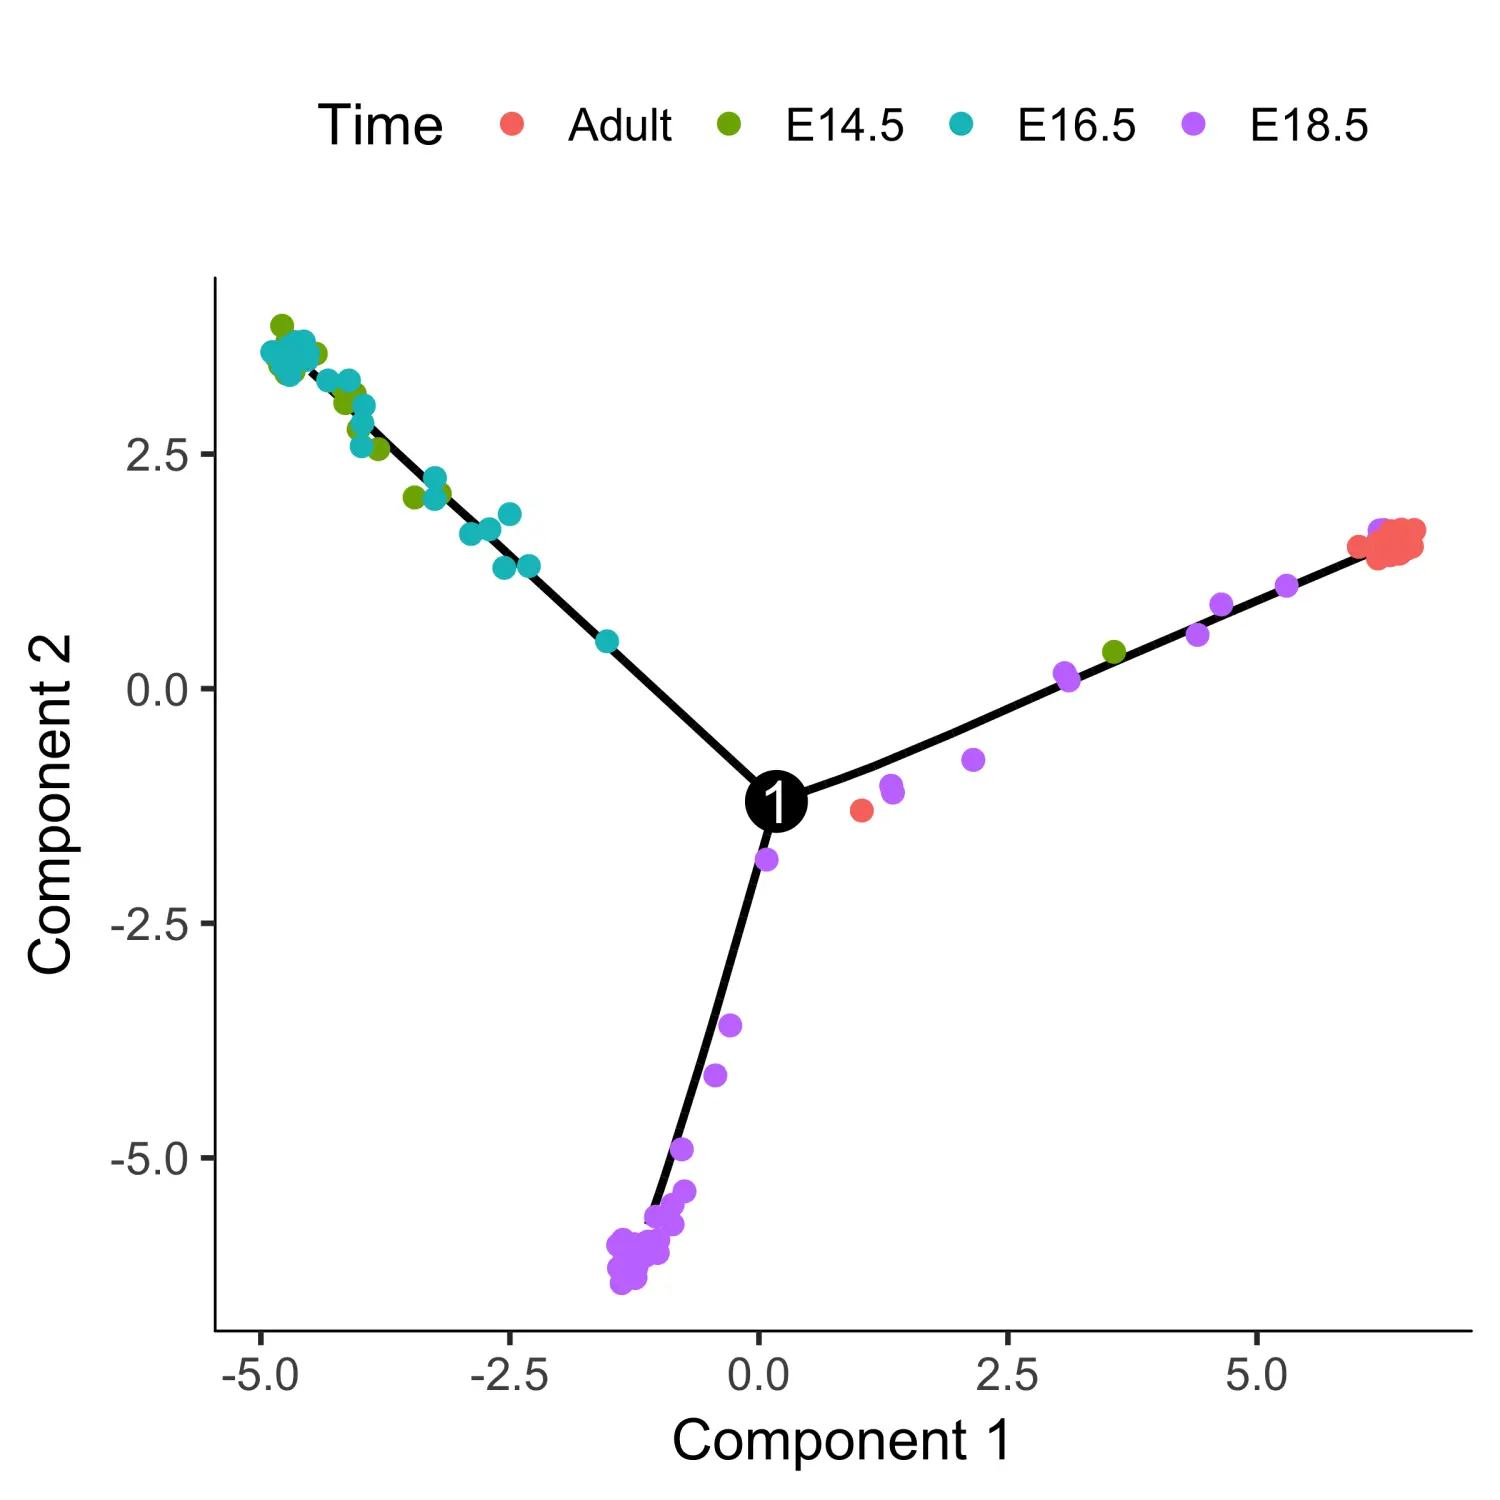
Analyzing Branches in Single-Cell Trajectories
通常,细胞的发育轨迹会存在不同的分支,出现分支是因为细胞执行其他不同的功能。当细胞做出命运选择时,其发育轨迹中就会出现分支:其中,一个发育世系沿着一条路径前进,而另一个世系沿着第二条路径前进。Monocle2提供了一种特殊的统计检验方法:branched expression analysis modeling(BEAM),可以对不同的分支事件进行分析。
lung <- load_lung()plot_cell_trajectory(lung, color_by = "Time")
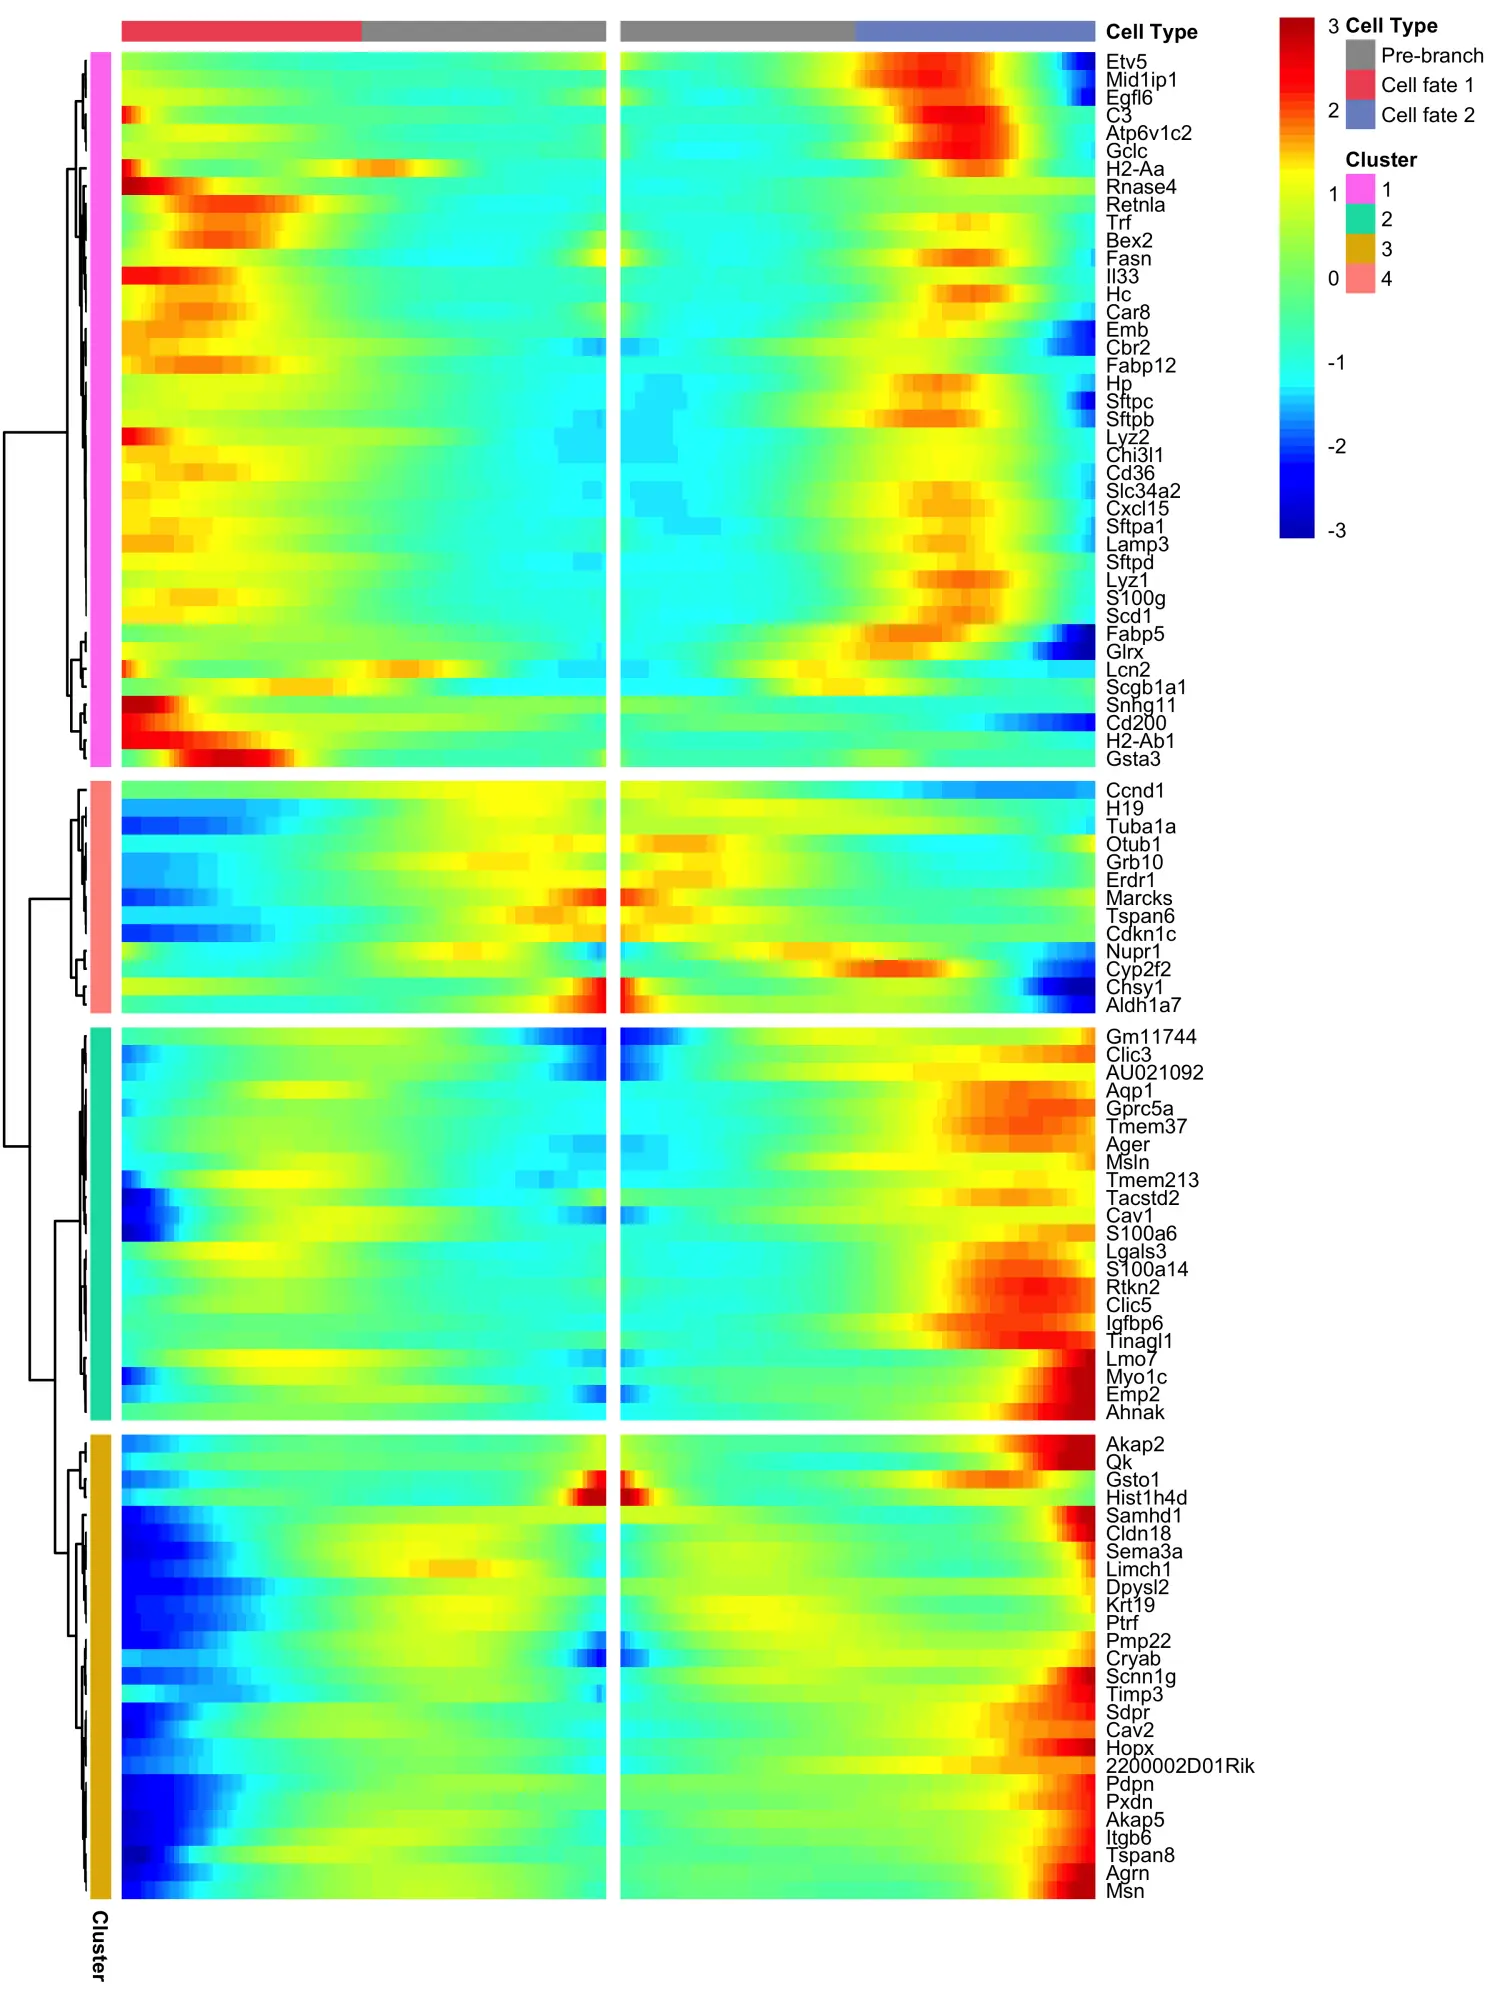
BEAM方法接受一个已通过orderCells函数排序的CellDataSet以及发育轨迹中分支点的名称作为输入,返回每个基因的显着性得分表。得分显着的基因在其表达中被认为是分支依赖性的。
# 使用BEAM函数进行分支表达建模分析BEAM_res <- BEAM(lung, branch_point = 1, cores = 1)BEAM_res <- BEAM_res[order(BEAM_res$qval),]BEAM_res <- BEAM_res[,c("gene_short_name", "pval", "qval")]
我们可以使用plot_genes_branched_heatmap函数绘制特殊类型的热图,可视化所有明显依赖于分支的基因的表达水平的变化。此热图同时显示了两个谱系中基因表达水平的变化,它还要求选择要检查的分支点。其中,列是伪时间中的点,行是基因,伪时间的起始点位于热图的中间。这些基因按层次结构聚类,可以可视化具有相似谱系依赖性表达模式的基因模块。
plot_genes_branched_heatmap(lung[row.names(subset(BEAM_res,qval < 1e-4)),],branch_point = 1,num_clusters = 4,cores = 1,use_gene_short_name = T,show_rownames = T)
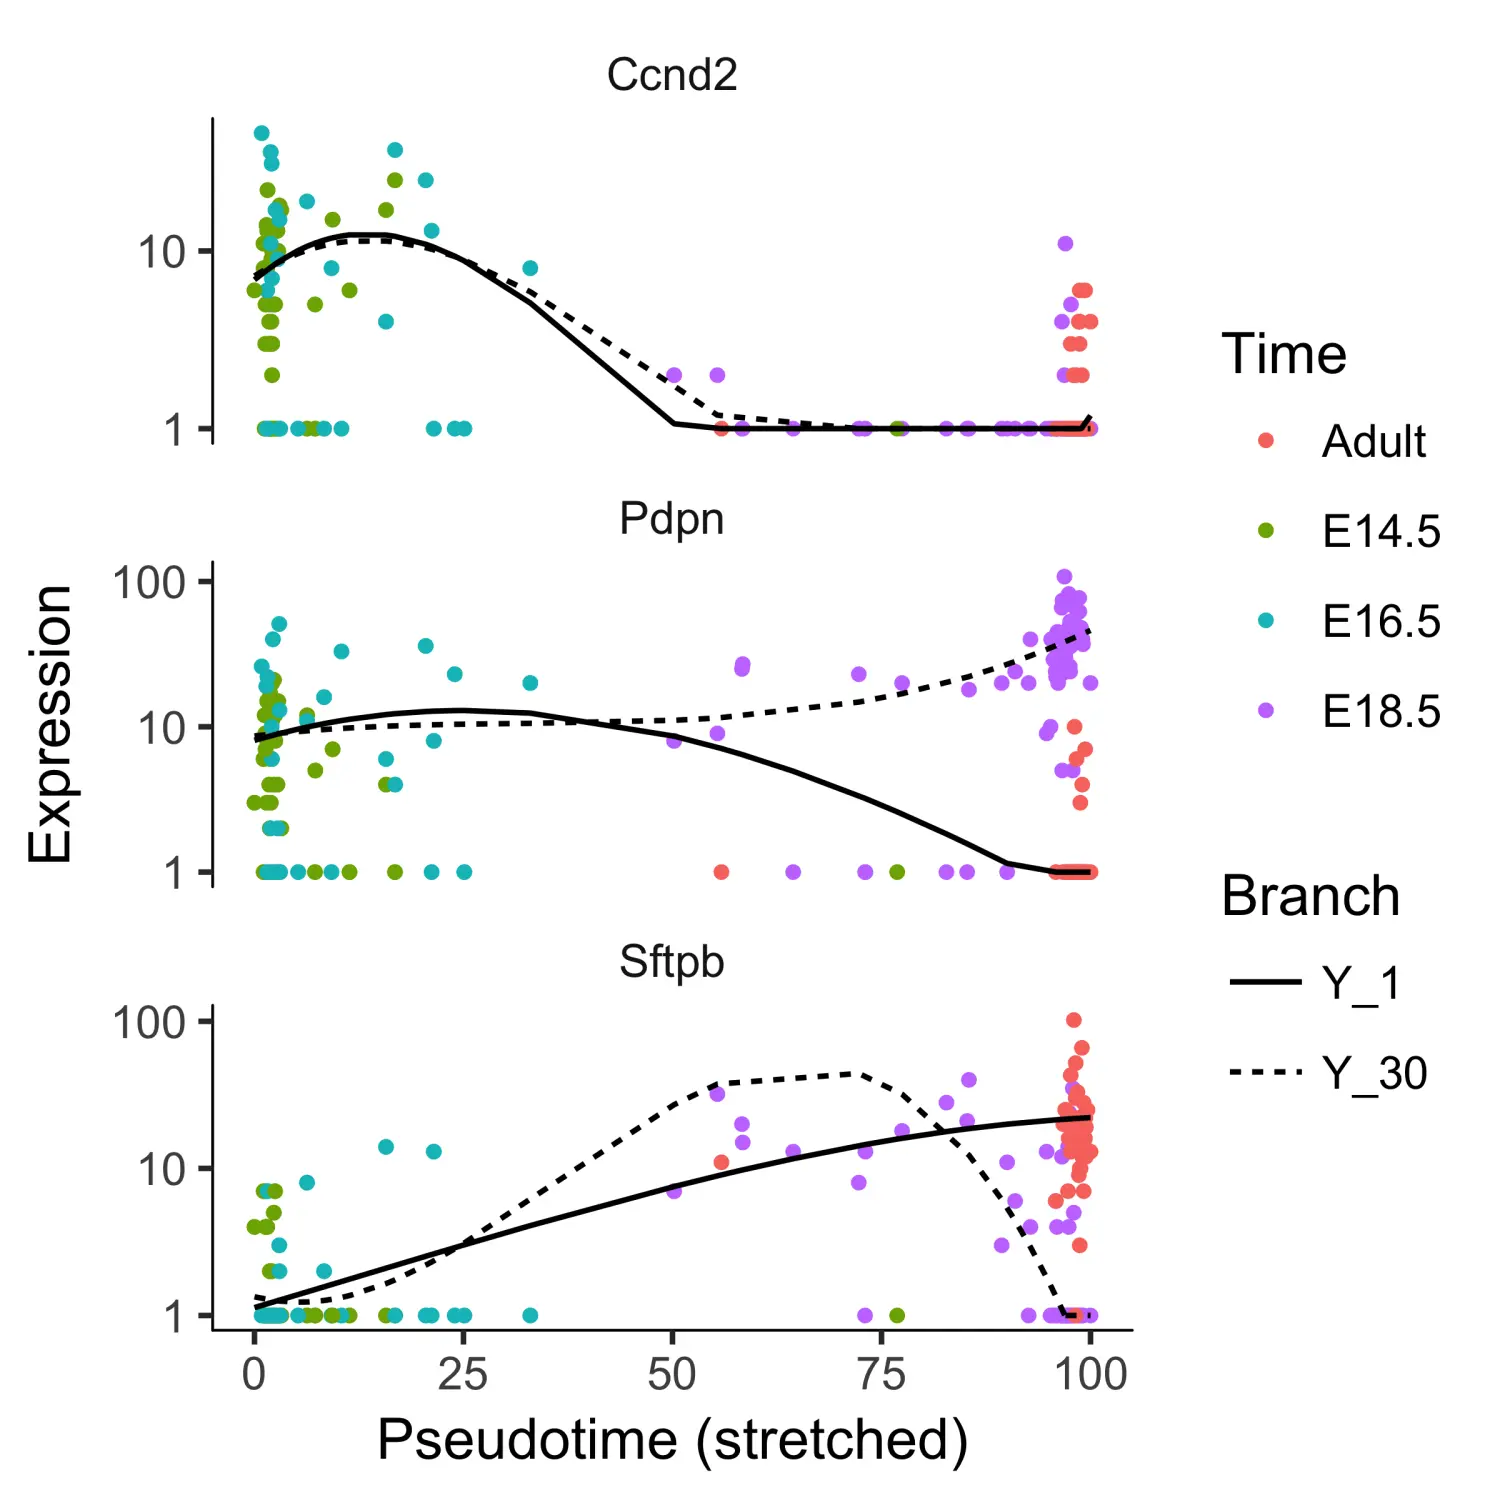
lung_genes <- row.names(subset(fData(lung),gene_short_name %in% c("Ccnd2", "Sftpb", "Pdpn")))plot_genes_branched_pseudotime(lung[lung_genes,],branch_point = 1,color_by = "Time",ncol = 1)
参考来源:http://cole-trapnell-lab.github.io/monocle-release/docs/


若有收获,就点个赞吧
0 人点赞
