Prepare data
Celaref包以SummarizedExperiment对象的数据作为输入,我们可以使用以下信息来手动地构造它。
- Counts Matrix: Number of gene tags per gene per cell. 基因表达矩阵
- Cell information: A sample-sheet table of cell-level information. 细胞分群信息 Only two fields are essential:
1)cell_sample: A unique cell identifier
2)group: The cluster/group to which the cell has been assigned. - Gene information: Optional. 基因信息 A table of extra gene-level information.
1)ID: A unique gene identifier
其中,细胞信息(cell information)表中可以包含任何所需的实验相关数据,如处理条件,实验批次和细胞个体等。基因信息是可选的,因为它可以从基因表达计数矩阵中获取。
celaref包本身不会对细胞进行聚类分群,任何未进行分组的细胞是不会被celaref处理的。因此,我们必须提前使用相关的聚类工具基于转录组表达谱的相似性对细胞做好聚类分群。
对于查询数据集(querying dataset),细胞分组的信息可以是任意名称(如cluster1,cluster2,cluster3等),但对于参考数据集(reference dataset),它们应该是有特定意义的信息(如“巨噬细胞 (macrophages)”等)。
Input data
1) From tables or flat files
The simplest way to load data is with two files.
- A tab-delimited counts matrix(基因表达计数矩阵):

- And a tab-delimited cell info / sample-sheet file of cell-level information, including the group assignment for each cell (‘Cluster’), and any other useful information(细胞分群信息):

我们可以使用load_se_from_files函数读取以上两个文件:
dataset_se <- load_se_from_files(counts_matrix = "counts_matrix_file.tab",cell_info_file = "cell_info_file.tab",group_col_name = "Cluster",cell_col_name = "CellId" )
其中,group_col_name参数指定的是细胞分群信息表(cell_info_file)中细胞分组列的列名,cell_col_name参数指定细胞分群信息表中细胞列的列名。如果缺少细胞信息,则该细胞将会在分析中被删除。这在排除一些细胞或提取细胞子集进行分析时会很有用。发生这种情况时,将发出一条警告消息,显示保留的细胞数。
Optionally, a third file, with gene-level information might be included.
dataset_se <- load_se_from_files(counts_matrix   = "counts_matrix_file.tab",
                                  cell_info_file = "cell_info_file.tab",
                                  gene_info_file = "gene_info_file.tab",
                                  group_col_name = "Cluster")
我们可以使用gene_info_file参数指定基因信息文件,如果提供了基因信息,则第一列(或名为“ID”的列)必须是唯一的,并且基因表达计数矩阵中的每个基因都必须在基因信息表中有一个条目,反之亦然。
或者,如果数据都已经提前加载到R中,则我们可以使用load_se_from_tables函数进行读取,它接受一个数据框而不是文件名。load_se_from_files函数只是load_se_from_tables函数的一个封装(wrapper)。
dataset_se <- load_se_from_tables(counts_matrix   = counts_matrix,
                                  cell_info_table = cell_info_table,
                                  group_col_name  = "Cluster")
2) From 10X pipeline output
如果我们使用10X cellRanger软件处理数据,则会生成一个输出目录,其中包括了计数矩阵文件和细胞聚类分群信息。
To read in a human (GRCh38) dataset using the ‘kmeans_7_clusters’ clustering:
dataset_se <- load_dataset_10Xdata('~/path/to/data/10X_mydata',
                                   dataset_genome = "GRCh38",
                                   clustering_set = "kmeans_7_clusters")
注意,cellRanger软件处理完数据后,会生成多个不同的聚类分群的数据集,存储在10X_mydata/analysis/clustering目录下,可以使用cell loupe browser软件进行查看。
3) Directly with SummarizedExperiment objects
数据加载的简便方法是构建一个SummarizedExperiment对象,该对象中包含了celaref所需的信息,可以处理命名和检查唯一性等。
该对象所需的最小必填字段在“Input data”部分中进行了描述,特别是:
- Within
colData(dataset_se):cell_sampleandgroupcolumns. - Within
rowData(dataset_se):IDcolumn.
注意:细胞分组(group)列是一个因子,而细胞信息(cell_sample)和基因ID列不能是因子。
细胞信息(cell information)和基因信息(gene information)的名称必须和基因表达计数矩阵的列名和行名相匹配。
4) Handling large datasets
许多(如果不是大多数的话)单细胞转录组的数据集都很大,而无法使用基本的密集矩阵(dense matrix)进行适当地处理。我们可以使用以下方法读取大型数据集:
- 提供hdf5支持的delayedArray SummarizedExperiment对象(通过
HDF5Array包中的save/loadHDF5SummarizedExperiment函数),或者将基因表达计数存储在稀疏矩阵(sparse Matrix)中(通过Matrix包),并使用load_se_from_tables函数读取。
library(Matrix)
#a sparse big M Matrix.
dataset_se.1 <- load_se_from_tables(counts_matrix = my_sparse_Matrix,
                                    cell_info_table = cell_info_table,
                                    group_col_name  = "Cluster")

# A hdf5-backed SummarisedExperiment from elsewhere
dataset_se.2 <- loadHDF5SummarizedExperiment("a_SE_dir/")
- 在
contrast_each_group_to_the_rest函数中使用n.group和n.others参数对每个差异比较的数据集进行子集化。这将保留所有“测试”组的细胞,并对其余每个组分别进行子采样计算差异表达。对每个比较分别进行此操作将保留细胞类型的相对比例,这可能在跨实验比较中很有用。
# For consistant subsampling, use set.seed
set.seed(12)
de_table.demo_query.subset <-
   contrast_each_group_to_the_rest(demo_query_se, "subsetted_example",
                                   n.group = 100, n.other = 200)

#> Found one, unnamed, assay in summarizedExperiment object. Assuming this is counts data ('counts')
#> Randomly sub sampling cells for Group1 contrast.
#> Found one, unnamed, assay in summarizedExperiment object. Assuming this is counts data ('counts')
#>
#> Done!
#> Combining coefficients and standard errors
#> Calculating log-fold changes
#> Calculating likelihood ratio tests
#> Refitting on reduced model...
#>
#> Done!
#> Randomly sub sampling cells for Group2 contrast.
#> Found one, unnamed, assay in summarizedExperiment object. Assuming this is counts data ('counts')
#>
#> Done!
#> Combining coefficients and standard errors
#> Calculating log-fold changes
#> Calculating likelihood ratio tests
#> Refitting on reduced model...
#>
#> Done!
#> Randomly sub sampling cells for Group3 contrast.
#> Found one, unnamed, assay in summarizedExperiment object. Assuming this is counts data ('counts')
#>
#> Done!
#> Combining coefficients and standard errors
#> Calculating log-fold changes
#> Calculating likelihood ratio tests
#> Refitting on reduced model...
#>
#> Done!
#> Randomly sub sampling cells for Group4 contrast.
#> Found one, unnamed, assay in summarizedExperiment object. Assuming this is counts data ('counts')
#>
#> Done!
#> Combining coefficients and standard errors
#> Calculating log-fold changes
#> Calculating likelihood ratio tests
#> Refitting on reduced model...
#>
#> Done!
- 对于非常大的数据集,我们最好先缩小数据集(这样可能会丢失细胞类型的比例)。可以使用
subset_cells_by_group函数执行此操作。在此,我们将每个组保留100个(或全部)细胞。
set.seed(12)
demo_query_se.subset <- subset_cells_by_group(demo_query_se, n.group = 100)
#> Randomly sub sampling100 cells per group.
Input filtering and Pre-processing
1) Filtering cells and low-expression genes
在进行基因差异表达分析之前,我们通常需要先删除无信息的低表达基因。而且在单细胞测序中,低表达计数的细胞可能是一些有问题的细胞-可以将其丢弃。同样,对于celaref包,非常小的细胞群体将没有统计能力来检测细胞的相似性。
我们可以使用trim_small_groups_and_low_expression_genes函数删除不符合特定阈值的细胞和基因。该函数的默认值具有较好的包容性,通常需要根据不同的实验或技术进行调整。我们可以使用dim(dataset_se)检查trim_small_groups_and_low_expression_genes过滤后保留的基因和细胞数。
# Default filtering
dataset_se <- trim_small_groups_and_low_expression_genes(dataset_se)

# Also defaults, but specified
dataset_se <- trim_small_groups_and_low_expression_genes(dataset_se,
                                    min_lib_size = 1000,
                                    min_group_membership = 5,
                                    min_detected_by_min_samples = 5)
2) Converting IDs
通常,将不同类型的基因标识符进行转换是比较烦人的。即使使用主要的基因标识符(如ensembl IDs(ENSG00000139618)或gene symbols(SYN1)),也会存在一些不完美的匹配(如缺少ID,多次匹配等)。
如果在创建summaryExperiment对象(即基因信息表/文件)时提供了多个基因ID,则可以使用函数convert_se_gene_ids便捷的对它们进行正常转换。
以下代码将从原始基因ID(例如,如果ID为ensemblID)转换为“GeneSymbol”(应为rowData(dataset_se)中的列名),它会:
- 定义一个基因型数据(genotype data)水平的列
total_count,其中每个基因的read读数总数加起来用作eval_col。 - 删除所有没有与ensembl ID相匹配的GeneSymbol的基因。
- 如果同一个GeneSymbol分配给多个ensembl ID,它将查找eval_col值并选择较大的一个。
# Count and store total reads/gene.
rowData(dataset_se)$total_count <- Matrix::rowSums(assay(dataset_se))

# rowData(dataset_se) must already list column 'GeneSymbol'
dataset_se <- convert_se_gene_ids(dataset_se, new_id='GeneSymbol', eval_col = 'total_count')
Within-experiment differential expression
将数据加载到summaryExperiment对象后,需要先在数据集中对不同的组进行差异分析,然后才能进行跨数据集比较。这是最耗时的步骤,但每个数据集只需要执行一次。
本质上,我们希望对数据集中的每个组的所有基因从“最大”到“最小”进行排序。celaref包使用MAST(Finak et al.2015)计算每个组与其它组之间的差异表达。这将提供相对于组织其余部分或样本作为背景的所有事物的相对表达。一个独立的实验会有其自身的偏差,但是如果运气好的话,相同的基因对于相同的细胞类型应该是“独特的”。对于单细胞RNA-seq测序数据,可能会存在有许多表达为零和缺失的细胞,因此celaref主要专注于表达较高的基因。根据对log2FC的最保守(“内部”)95%置信区间,将基因按从高到低的顺序排列。该排名是预期效果大小(log2FC值-对于低表达基因可能会急剧改变)和统计功效(p值排名)之间的简单折衷。
进行细胞过滤后,我们可以使用contrast_each_group_to_the_rest函数来完成此操作:
# 使用trim_small_groups_and_low_expression_genes函数进行细胞过滤
demo_query_se.filtered <- trim_small_groups_and_low_expression_genes(demo_query_se)

# 使用contrast_each_group_to_the_rest函数进行差异比较
de_table.demo_query <- contrast_each_group_to_the_rest(demo_query_se.filtered, "a_demo_query")

#>
#> Done!
#> Combining coefficients and standard errors
#> Calculating log-fold changes
#> Calculating likelihood ratio tests
#> Refitting on reduced model...
#>
#> Done!
#> Found one, unnamed, assay in summarizedExperiment object. Assuming this is counts data ('counts')
#>
#> Done!
#> Combining coefficients and standard errors
#> Calculating log-fold changes
#> Calculating likelihood ratio tests
#> Refitting on reduced model...
#>
#> Done!
#> Found one, unnamed, assay in summarizedExperiment object. Assuming this is counts data ('counts')
#>
#> Done!
#> Combining coefficients and standard errors
#> Calculating log-fold changes
#> Calculating likelihood ratio tests
#> Refitting on reduced model...
#>
#> Done!
#> Found one, unnamed, assay in summarizedExperiment object. Assuming this is counts data ('counts')
#>
#> Done!
#> Combining coefficients and standard errors
#> Calculating log-fold changes
#> Calculating likelihood ratio tests
#> Refitting on reduced model...
#>
#> Done!
Reference datasets are prepared with the same command, there’s no difference in the result.
demo_ref_se.filtered <- trim_small_groups_and_low_expression_genes(demo_ref_se)

de_table.demo_ref   <- contrast_each_group_to_the_rest(demo_ref_se.filtered,   "a_demo_reference")

#>
#> Done!
#> Combining coefficients and standard errors
#> Calculating log-fold changes
#> Calculating likelihood ratio tests
#> Refitting on reduced model...
#>
#> Done!
#> Found one, unnamed, assay in summarizedExperiment object. Assuming this is counts data ('counts')
#>
#> Done!
#> Combining coefficients and standard errors
#> Calculating log-fold changes
#> Calculating likelihood ratio tests
#> Refitting on reduced model...
#>
#> Done!
#> Found one, unnamed, assay in summarizedExperiment object. Assuming this is counts data ('counts')
#>
#> Done!
#> Combining coefficients and standard errors
#> Calculating log-fold changes
#> Calculating likelihood ratio tests
#> Refitting on reduced model...
#>
#> Done!
#> Found one, unnamed, assay in summarizedExperiment object. Assuming this is counts data ('counts')
#>
#> Done!
#> Combining coefficients and standard errors
#> Calculating log-fold changes
#> Calculating likelihood ratio tests
#> Refitting on reduced model...
#>
#> Done!
For clarity, the results objects have names starting with de_table, but they are simply tibble (data.frame-like) objects that look like this:
As for what it contains, the important fields are:
ID: Gene IDfdr: The multiple hypothesis corrected p-value (BH method)log2FC: Log2 fold-change of for this gene’s expression in the (test group) - (rest of sample)ci_inner: The inner (most conservative/nearest 0) 95% confidence interval of log2FC. This is used to rank genes from most-to-least overrepresented in this group, with respect to the rest of the sample.group: Group being tested (all are tested by default)sig_up: Is this gene significantly (fdr <=0.01) enriched (log2FC > 0) in this group.rank: Numerical rank of ci_inner from most (1) to least (n).rescaled_rank: Rank rescaled from most (0) to least (1) - used in analyses and plotting.dataset: Name of this dataset
由于差异表达分析的计算是一个非常耗时的步骤(如,几个小时,具体取决于数据大小),该函数还提供了并行计算的方法。如果指定了num_cores参数,则可以并行处理多个组。为了获得最佳结果,应将num_cores数设置为查询中的组数,只要系统资源允许即可。
Running comparisions
Compare groups to reference
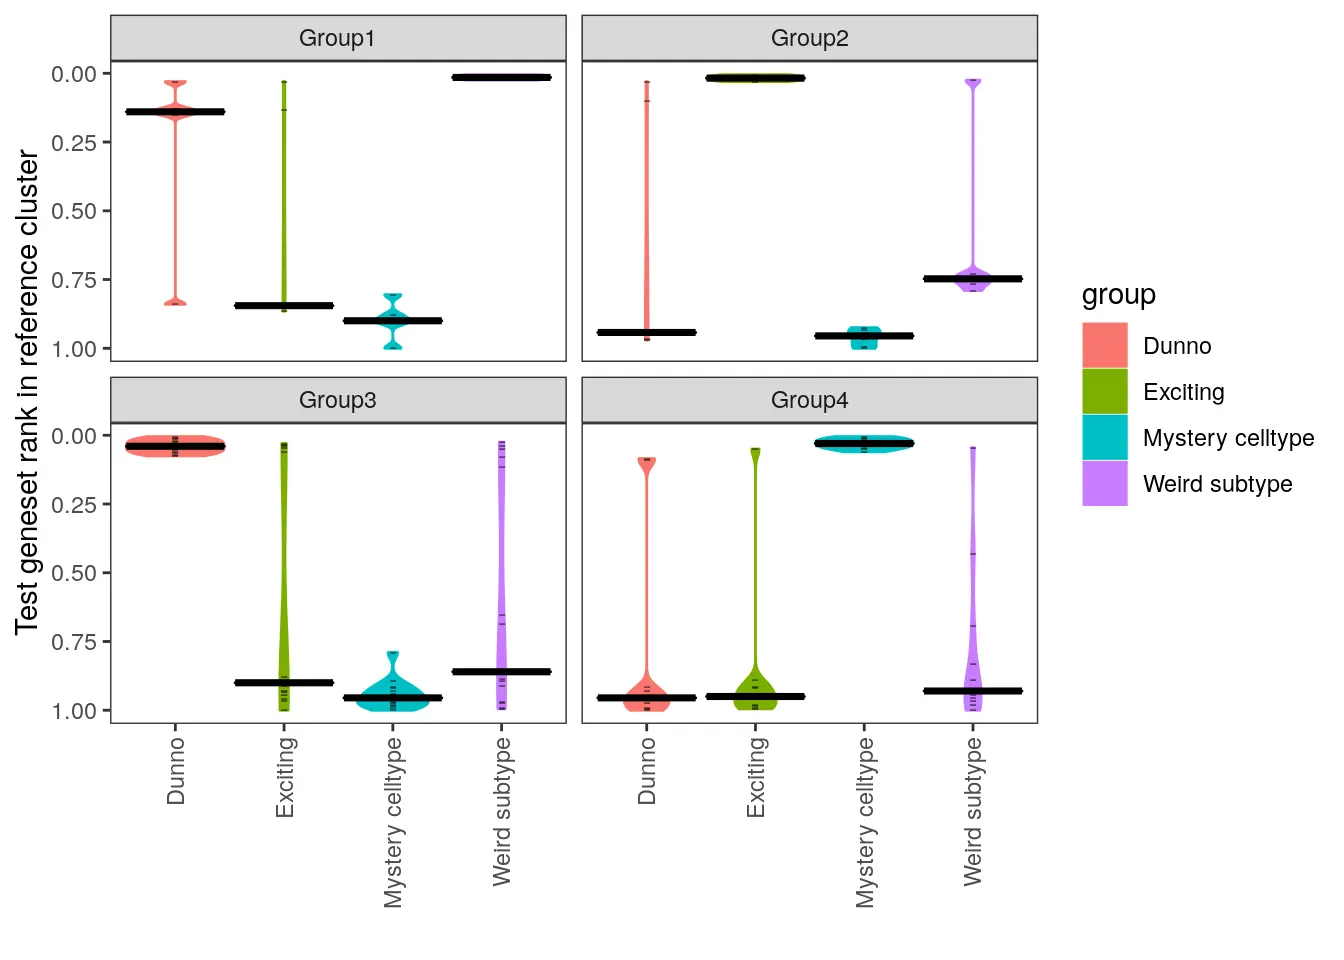
将查询数据集与其自身进行比较之后,可以将组与参考数据集进行比较。celaref的主要输出是查询组中“top”基因在参考组中排序等级的小提琴图,在每个参考组中用小提琴图表示其“top”基因的排名。
我们可以使用make_ranking_violin_plot函数绘制此图。(注意,必须按名称而不是位置指定de_table.test和de_table.ref参数。)
make_ranking_violin_plot(de_table.test=de_table.demo_query, de_table.ref=de_table.demo_ref)

#> Warning: `fun.y` is deprecated. Use `fun` instead.
#> Warning: `fun.ymin` is deprecated. Use `fun.min` instead.
#> Warning: `fun.ymax` is deprecated. Use `fun.max` instead.

为了汇总该图的数据,我们可以使用get_the_up_genes_for_all_possible_groups函数进行提取,并保存输出结果。
get_the_up_genes_for_all_possible_groups函数主要做以下两件事:
- 为查询数据集中的每个组识别“top”基因。即,在该组织/样品的背景下,对于该细胞类型/组而言,最明显的是什么。这被定义为内部log2FC的95%置信区间>= 1的前100个基因。
- 在每个参考组中查找“top”基因的重新排序后的排名(从最高到最低内部log2FC的95%CI)。
Compare groups within a single dataset
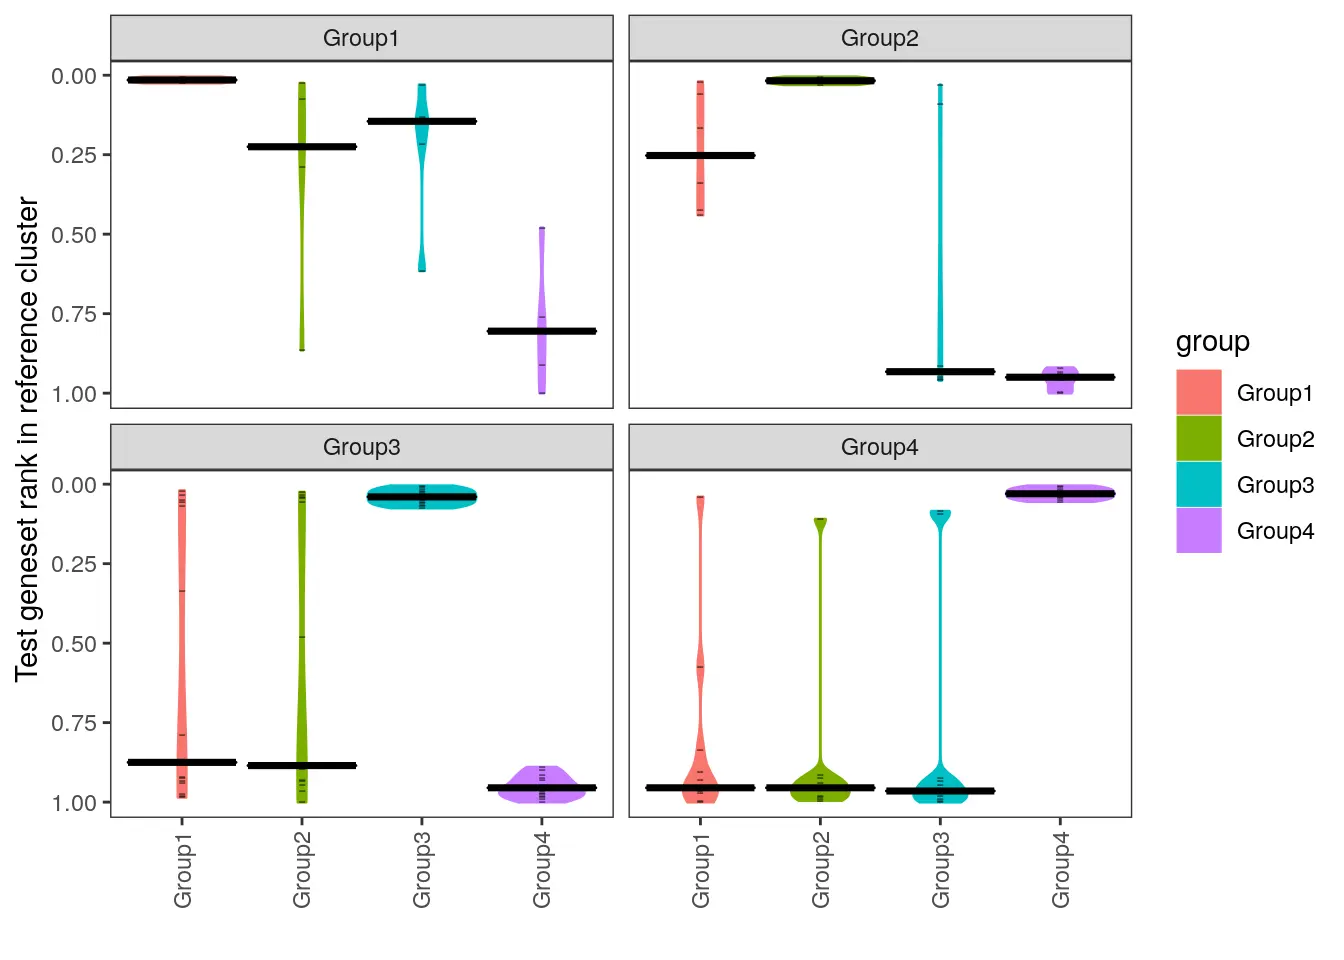
将数据集与其自身进行比较通常也很有用。我们只需为de_table.test和de_table.ref指定相同的数据集即可,这将显示各组之间的相似程度。无法相互区分的细胞群可能表明定义了太多的cluster。
make_ranking_violin_plot(de_table.test=de_table.demo_query, de_table.ref=de_table.demo_query)

#> Warning: `fun.y` is deprecated. Use `fun` instead.
#> Warning: `fun.ymin` is deprecated. Use `fun.min` instead.
#> Warning: `fun.ymax` is deprecated. Use `fun.max` instead.

Make labels for groups
最后,celaref基于比较的结果为查询数据集中的不同细胞组分配注释的标签名。
group_names_table <- make_ref_similarity_names(de_table.demo_query, de_table.demo_ref)

关于“num_steps”参数的说明:
函数make_ref_similarity_names接受可选参数“num_steps”。它不会影响“shortlab”中注释的标签,只会影响额外的“similar_non_match”列。如果将其设置得太小(例如1),则可能会错过相似的不匹配组。如果设置为“NA”将进行全面性测试,但是对于许多参考组而言,这可能会很慢。
Special case: Saving get_the_up_genes_for_all_possible_groups output
我们可以使用get_the_up_genes_for_all_possible_groups函数提取细胞分群注释的结果,并绘制小提琴图查看细胞分组的标签。
de_table.marked.query_vs_ref <- get_the_up_genes_for_all_possible_groups(
   de_table.test=de_table.demo_query ,
   de_table.ref=de_table.demo_ref)

# Have to do do the reciprocal table too for labelling.
de_table.marked.ref_vs_query<- get_the_up_genes_for_all_possible_groups(
   de_table.test=de_table.demo_ref ,
   de_table.ref=de_table.demo_query)

kable(head(de_table.marked.query_vs_ref))

Equivalent plots and labels:
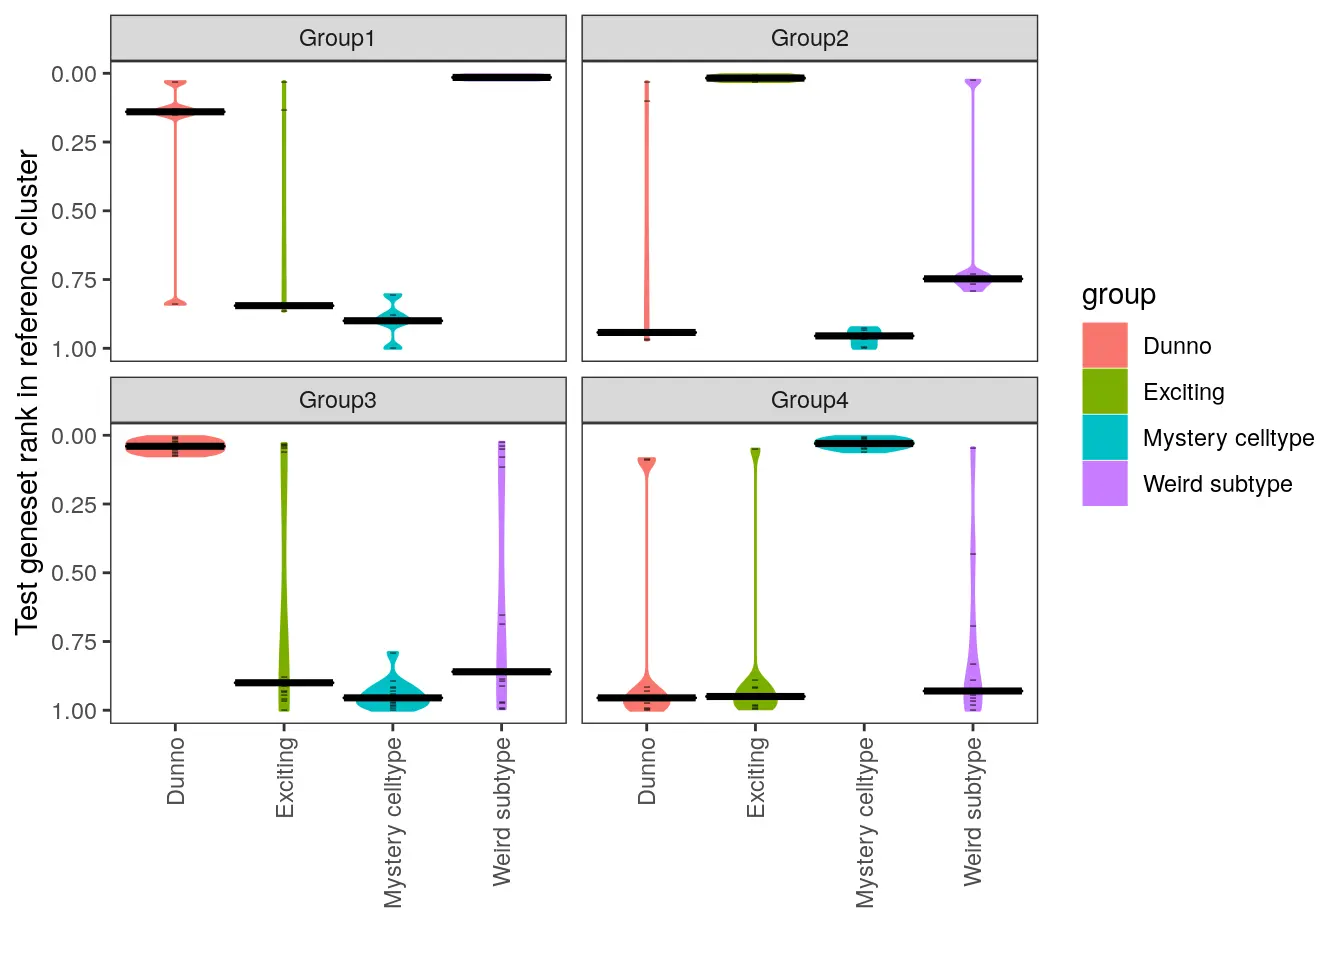
make_ranking_violin_plot(de_table.marked.query_vs_ref)

#> Warning: `fun.y` is deprecated. Use `fun` instead.
#> Warning: `fun.ymin` is deprecated. Use `fun.min` instead.
#> Warning: `fun.ymax` is deprecated. Use `fun.max` instead.

#use make_ref_similarity_names_using_marked instead:
similarity_label_table <- make_ref_similarity_names_using_marked(de_table.marked.query_vs_ref, de_table.recip.marked=de_table.marked.ref_vs_query)

kable(similarity_label_table)

参考来源:http://www.bioconductor.org/packages/release/bioc/vignettes/celaref/inst/doc/celaref_doco.html

