▼Seurat包系列学习笔记▼:
Seurat包学习笔记(一):Guided Clustering Tutorial
Seurat包学习笔记(二):Integration and Label Transfer
Seurat包学习笔记(三):Analysis of spatial datasets
Seurat包学习笔记(四):Using sctransform in Seurat
Seurat包学习笔记(五):Using Seurat with multi-modal data
Seurat包学习笔记(六):scATAC-seq + scRNA-seq integration
Seurat包学习笔记(七):Stimulated vs Control PBMCs
Seurat包学习笔记(八):Cell-Cycle Scoring and Regression
Seurat包学习笔记(九):Differential expression testing
Seurat包学习笔记(十):New data visualization methods in v3.0
Seurat CheatSheet思维导图
Seurat对象解读思维导图
Shiny是一个能够方便构建交互式网页应用的R包,仅用几行代码就可以轻松地构建一个简单的web应用程序。
Shiny应用程序主要分为两个部分:用户界面定义和服务端脚本。它们既可以由单个脚本 app.R 构成,也可以分成两个独立的脚本 ui.R 和 server.R。
安装shiny及其扩展包
# 设置安装包镜像options(repos="https://mirrors.tuna.tsinghua.edu.cn/CRAN/")install.packages("shiny")install.packages("shinythemes")install.packages("shinydashboard")
运行内置示例应用
可以使用runExample()函数查看shiny包中内置的一些应用程序,里面包含了11个示例的web应用,我们可以通过这些示例应用进行初步的学习。
# 加载shiny包
library(shiny)

# List all available examples
# 查看内置的示例应用
runExample()
Valid examples are "01_hello", "02_text", "03_reactivity", "04_mpg", "05_sliders", "06_tabsets", "07_widgets", "08_html", "09_upload", "10_download", "11_timer"
# 运行示例应用"01_hello"
runExample("01_hello")
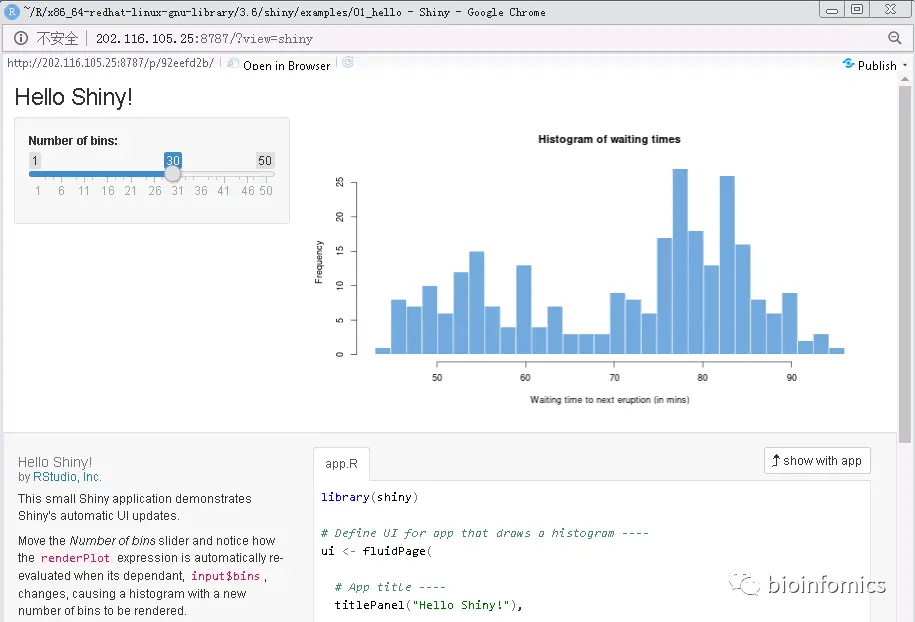
运行完代码后,就会通过浏览器弹出一个web应用的窗口,可以交互式的调整生成的图形。
查看该示例web应用的源代码app.R
library(shiny)

# Define UI for app that draws a histogram ----
ui <- fluidPage(

  # App title ----
  titlePanel("Hello Shiny!"),

  # Sidebar layout with input and output definitions ----
  sidebarLayout(

    # Sidebar panel for inputs ----
    sidebarPanel(

      # Input: Slider for the number of bins ----
      sliderInput(inputId = "bins",
                  label = "Number of bins:",
                  min = 1,
                  max = 50,
                  value = 30)

    ),

    # Main panel for displaying outputs ----
    mainPanel(

      # Output: Histogram ----
      plotOutput(outputId = "distPlot")

    )
  )
)

# Define server logic required to draw a histogram ----
server <- function(input, output) {

  # Histogram of the Old Faithful Geyser Data ----
  # with requested number of bins
  # This expression that generates a histogram is wrapped in a call
  # to renderPlot to indicate that:
  #
  # 1. It is "reactive" and therefore should be automatically
  #    re-executed when inputs (input$bins) change
  # 2. Its output type is a plot
  output$distPlot <- renderPlot({

    x    <- faithful$waiting
    bins <- seq(min(x), max(x), length.out = input$bins + 1)

    hist(x, breaks = bins, col = "#75AADB", border = "white",
         xlab = "Waiting time to next eruption (in mins)",
         main = "Histogram of waiting times")

    })

}

# Create Shiny app ----
shinyApp(ui = ui, server = server)
使用ShinySeurat可视化单细胞测序数据
前段时间根据shiny官网提供的教程学习了下使用shiny搭建交互式的web应用,我学习模仿了一些教程利用Shiny基于Seurat的分析结果搭建了一个单细胞测序数据可视化的交互平台
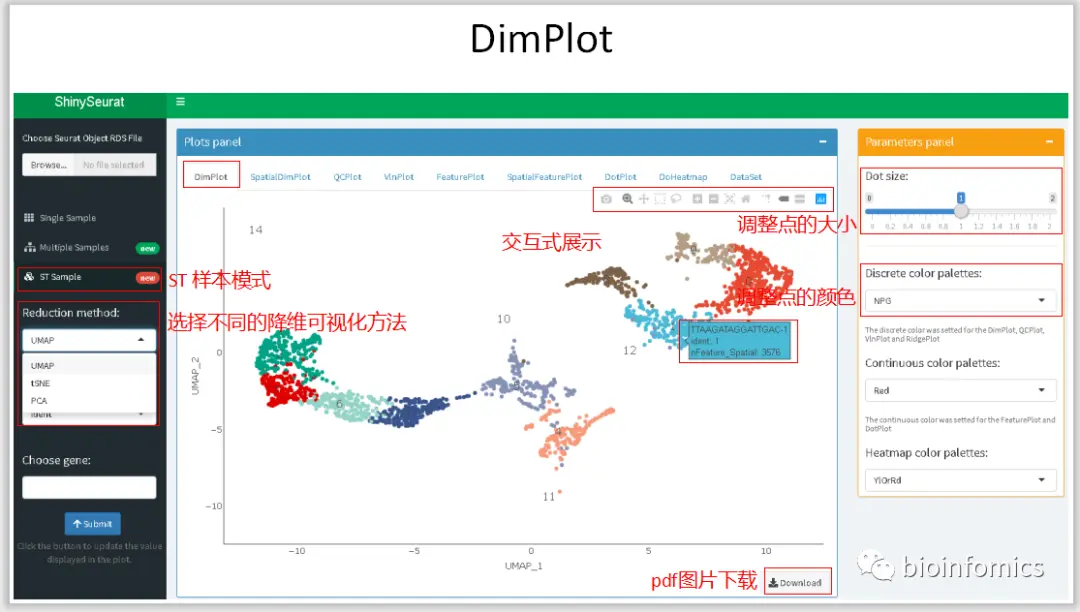
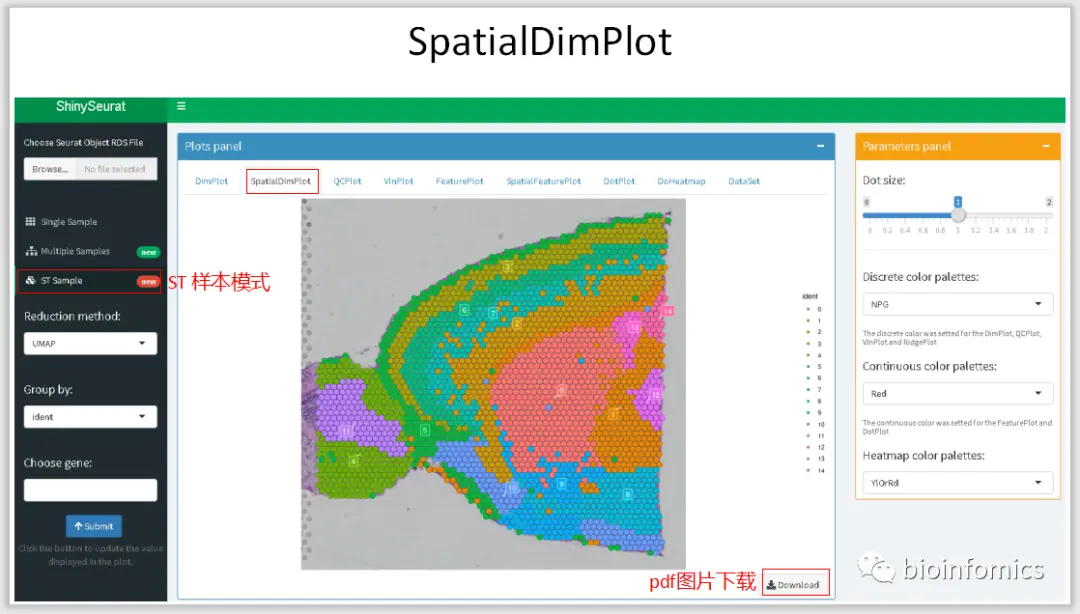
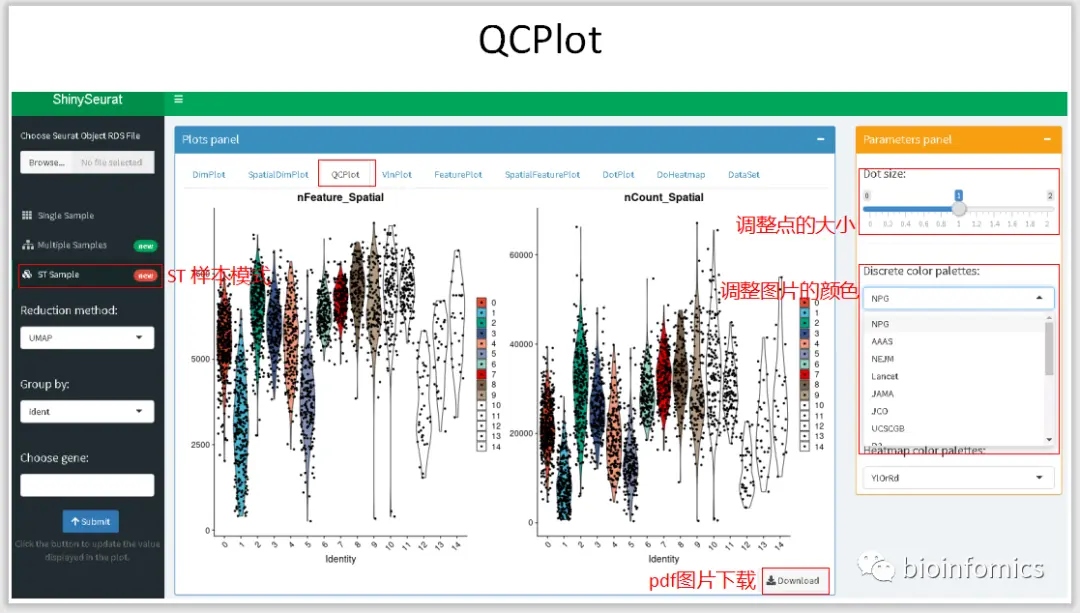
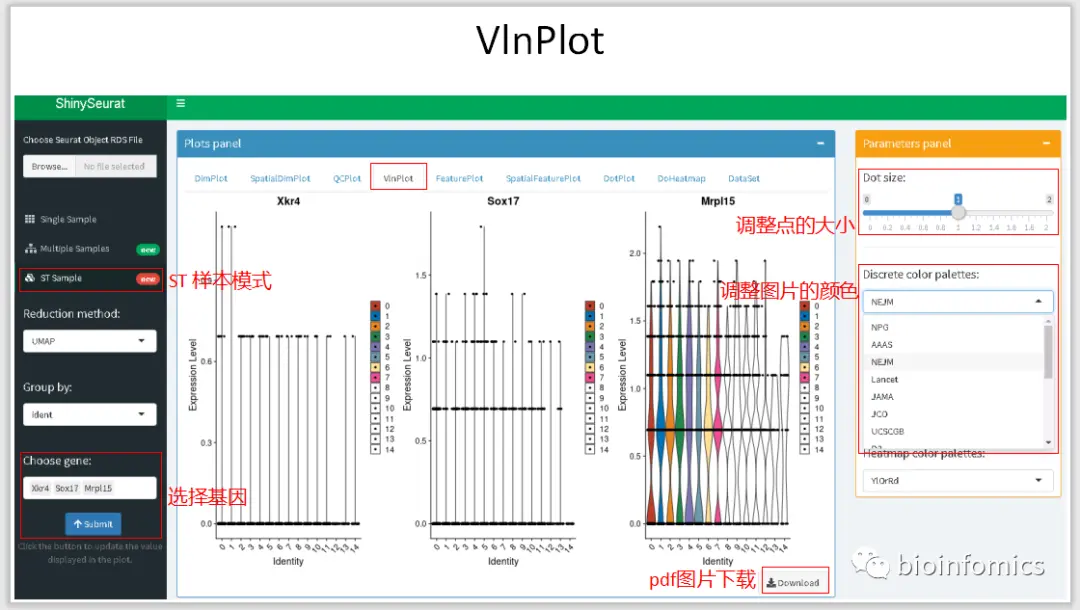
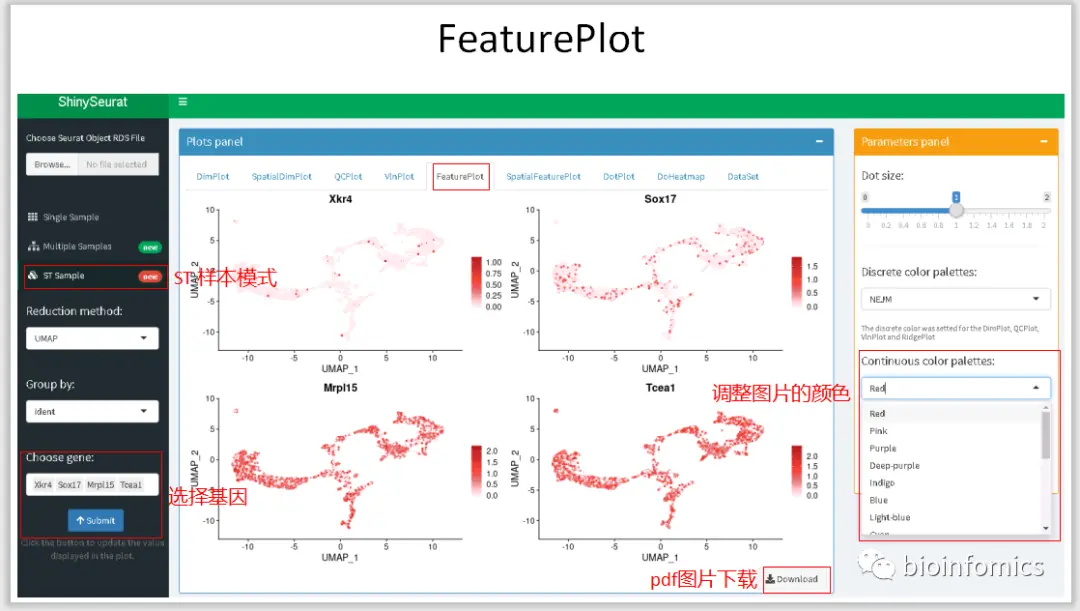
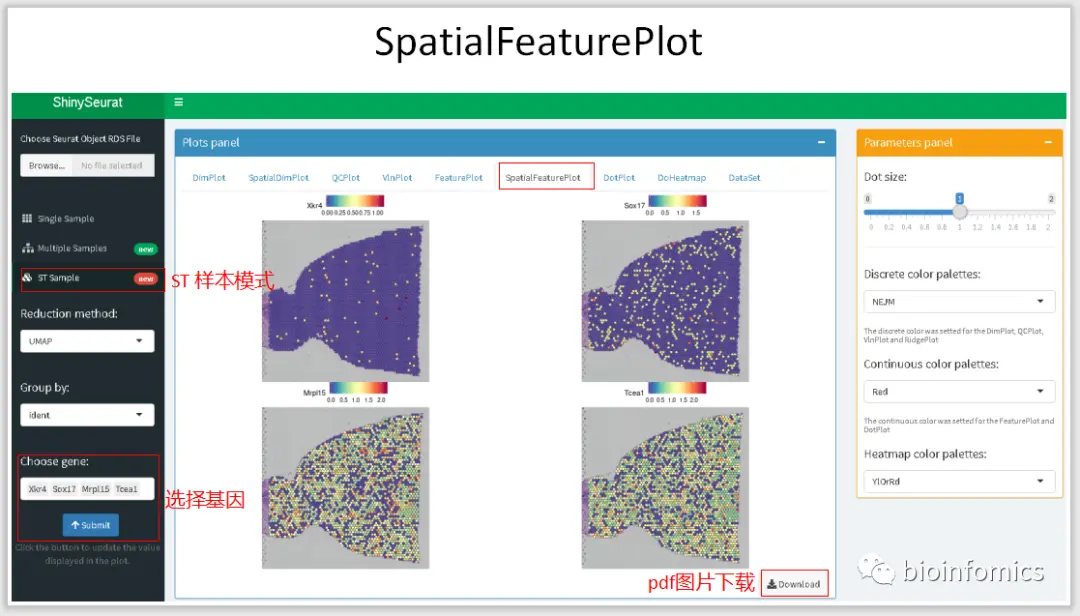
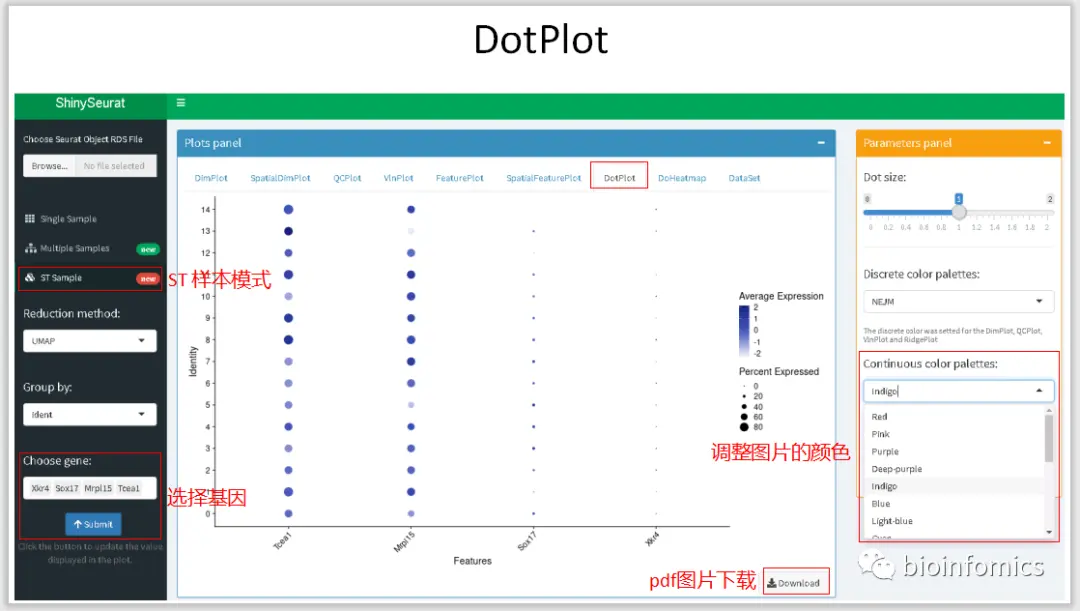
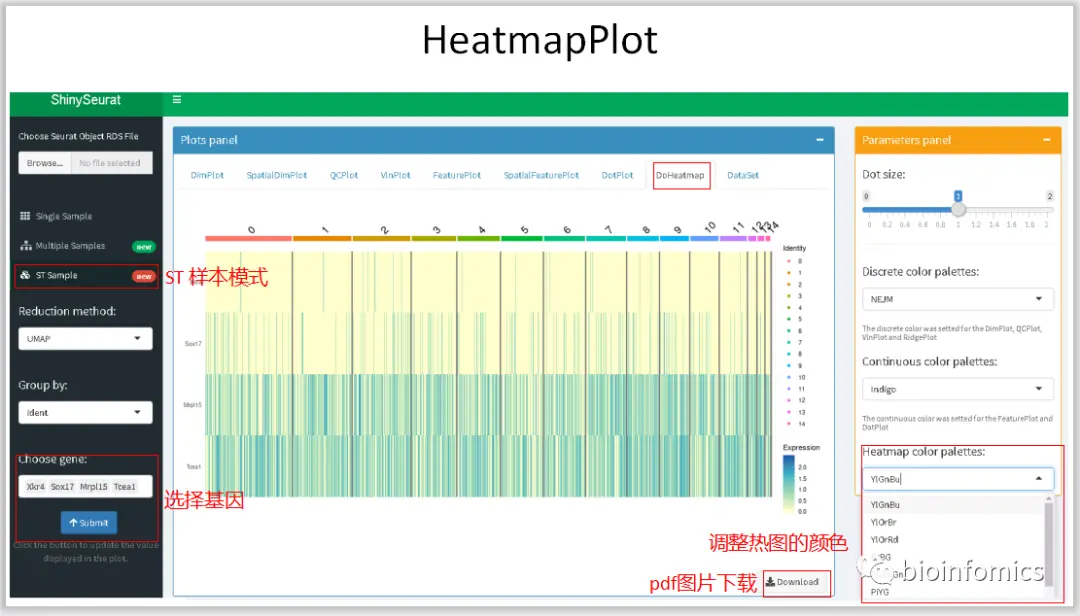
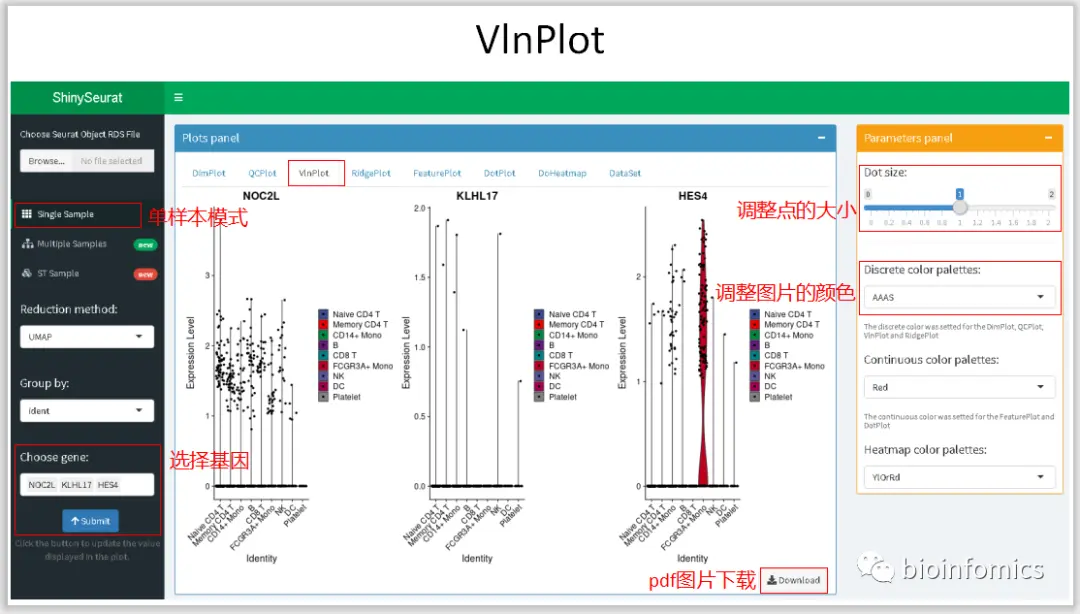
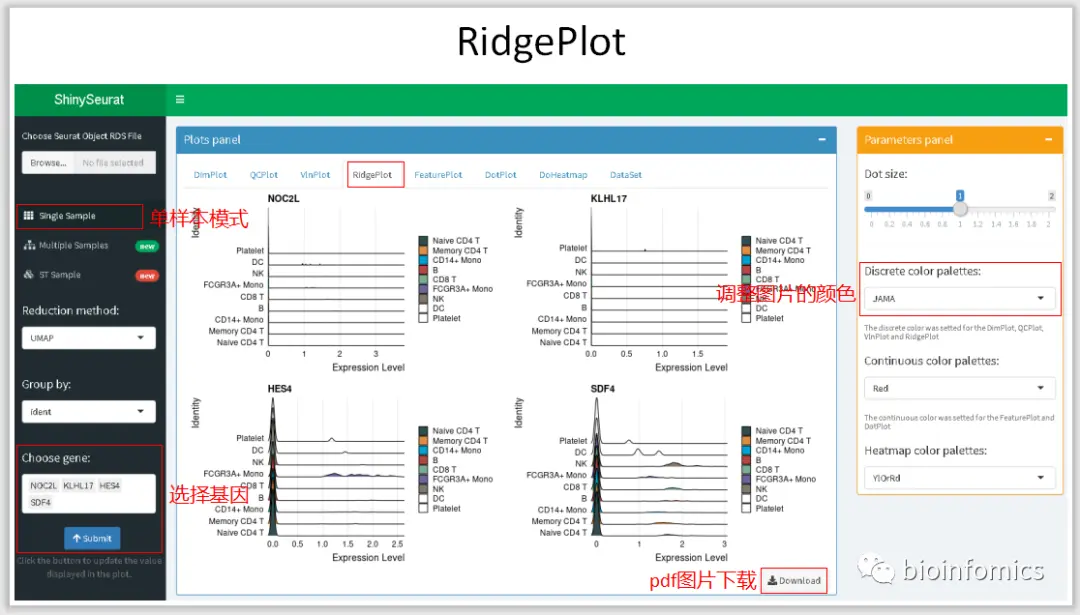
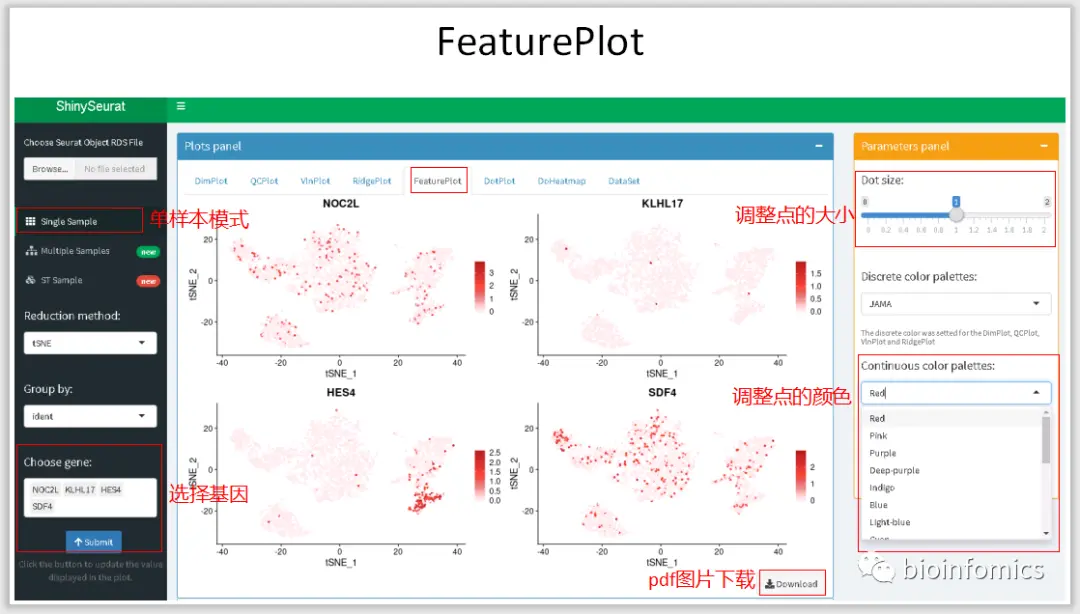
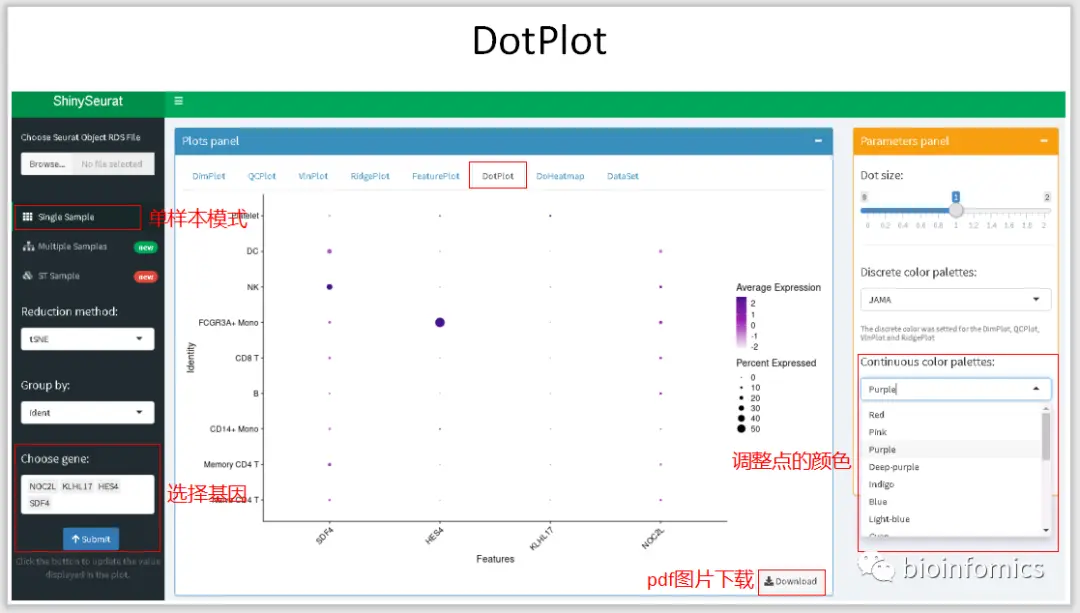
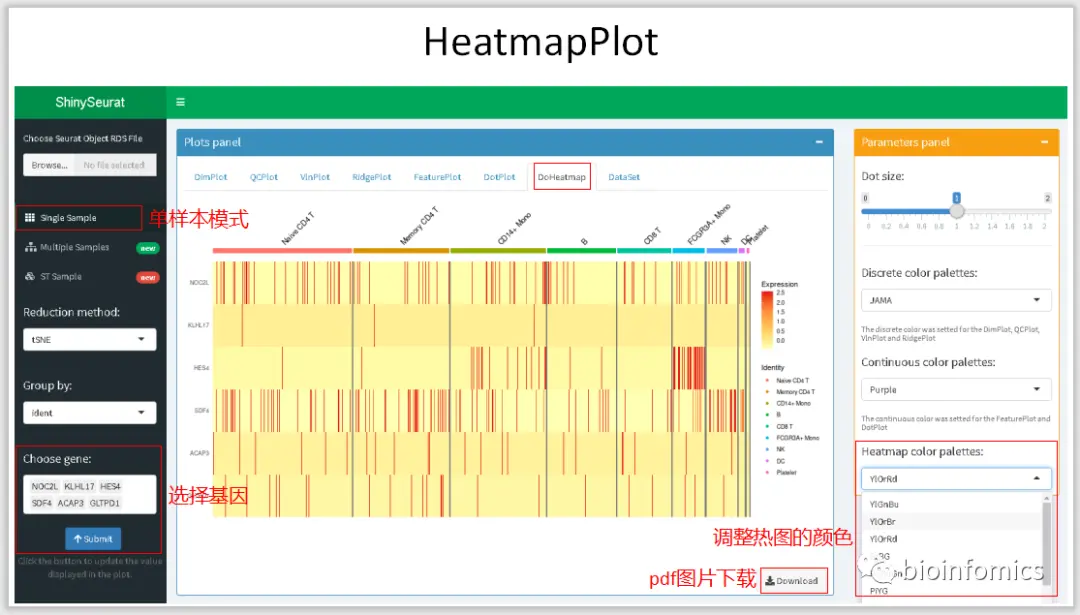
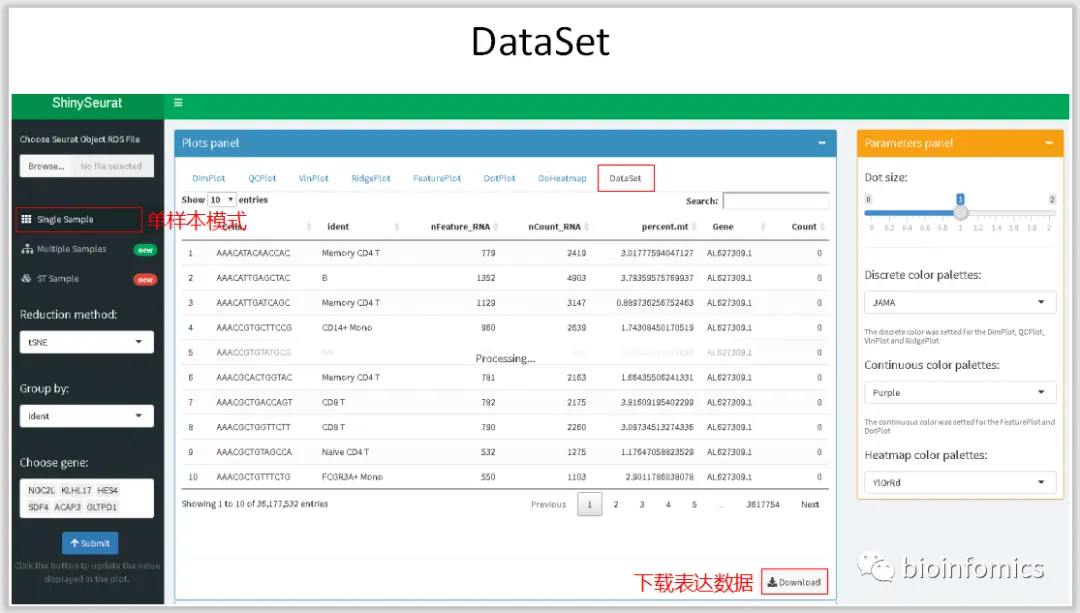
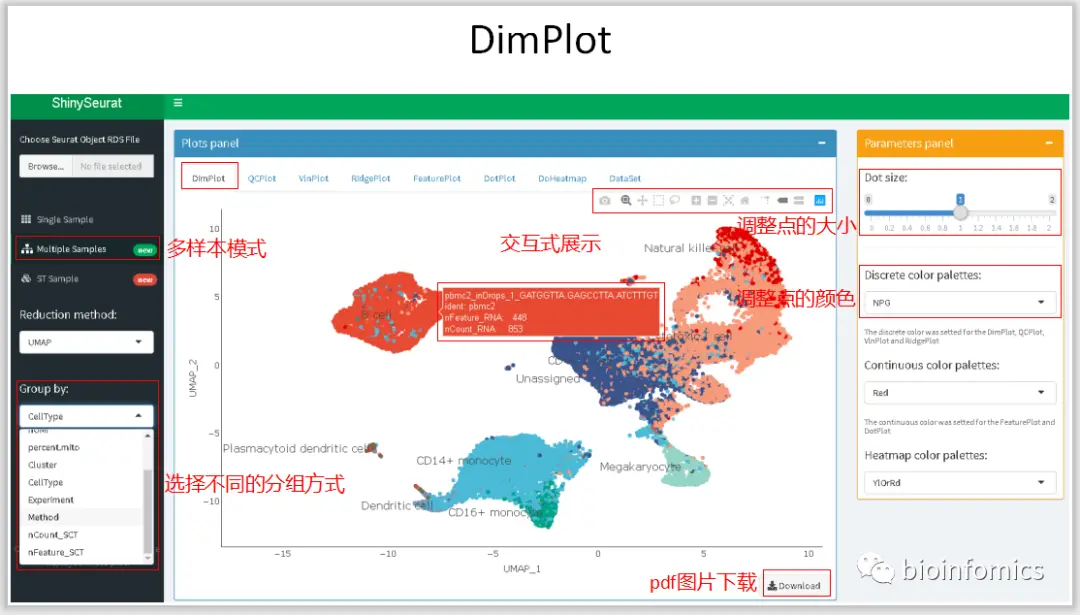
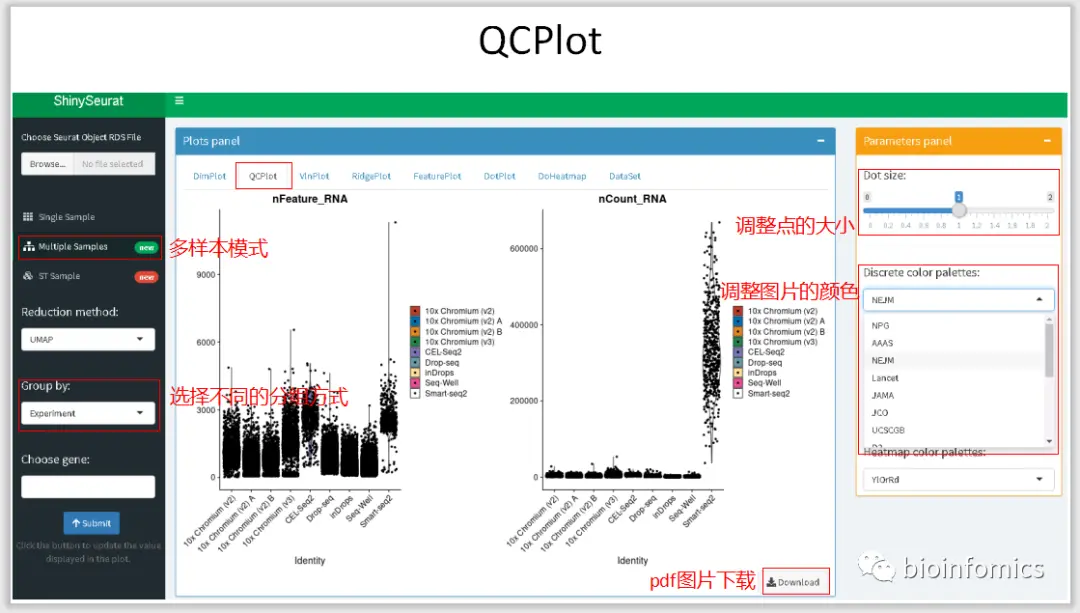
ShinySeurat,可以方便地将Seurat的分析结果进行可视化的展示,并下载相应的图片和结果。在该应用中,我主要提供了三种模式展示不同的分析结果,可以对单样本数据、多样本整合数据以及ST的分析结果进行可视化的展示。
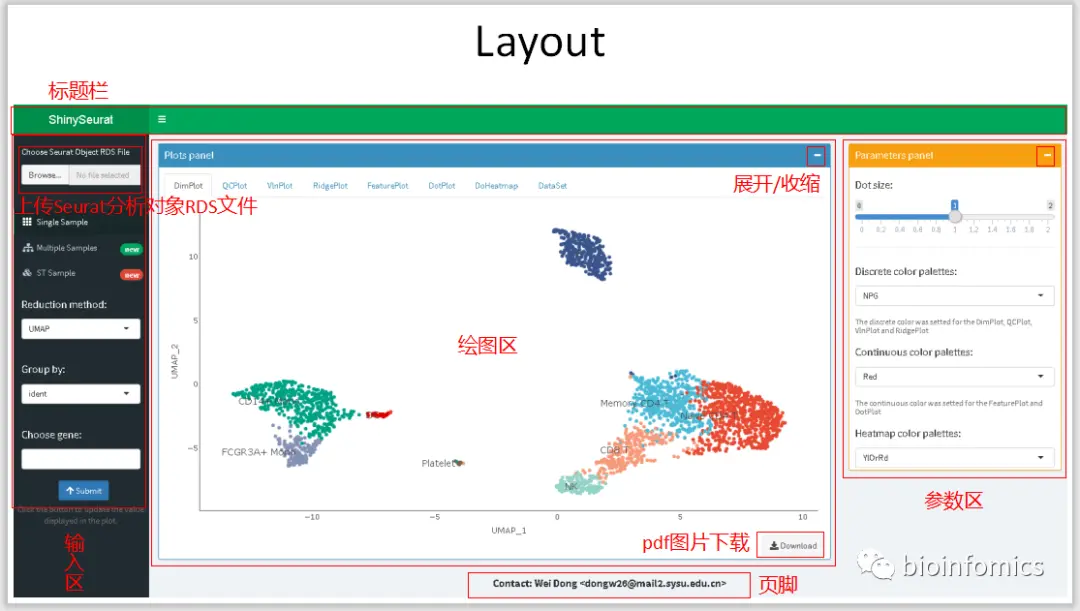
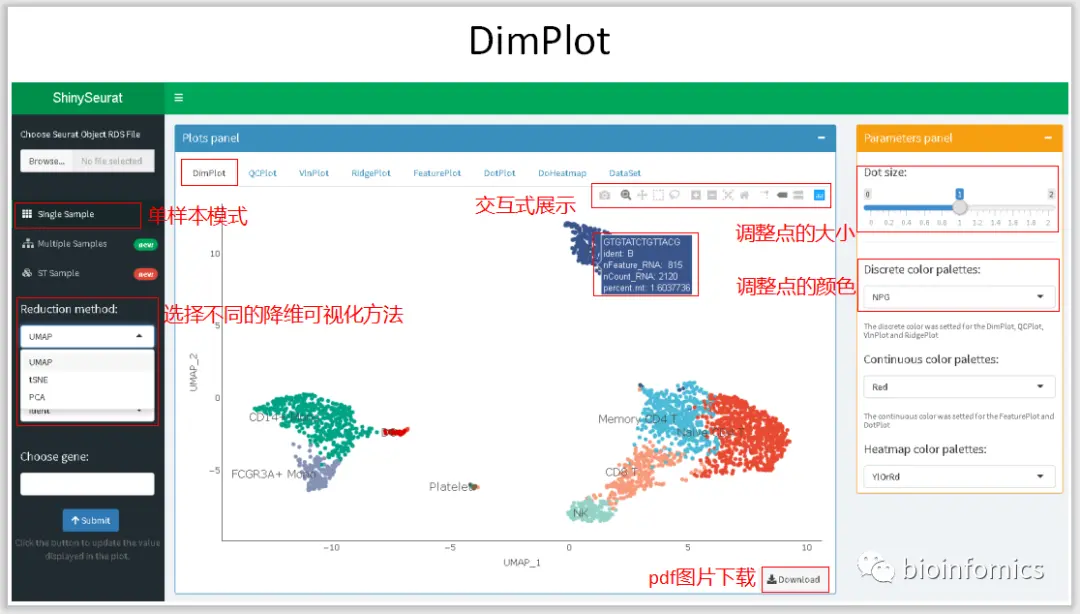
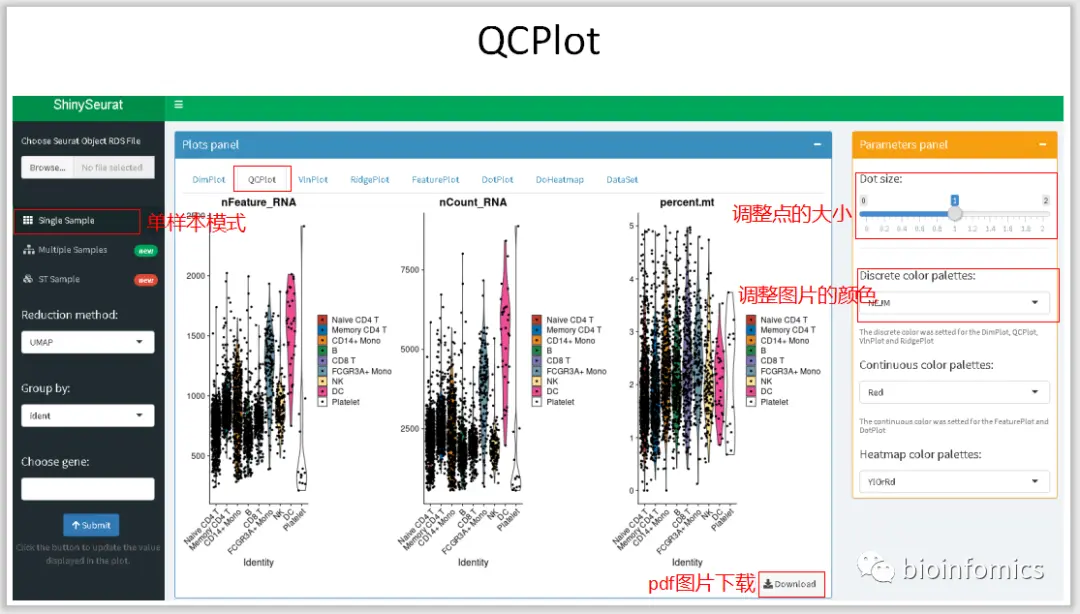
Single Sample Mode 单样本数据可视化展示
这里我将使用Seurat中分析过的PBMC3K的数据进行可视化的展示。
Multiple Sample Mode 多样本整合数据可视化展示
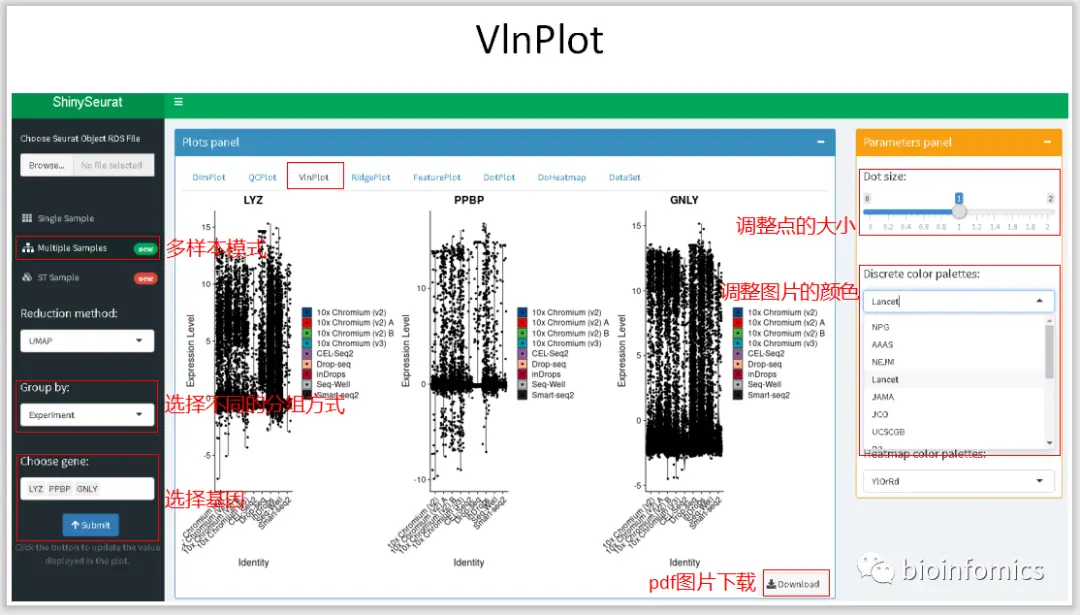
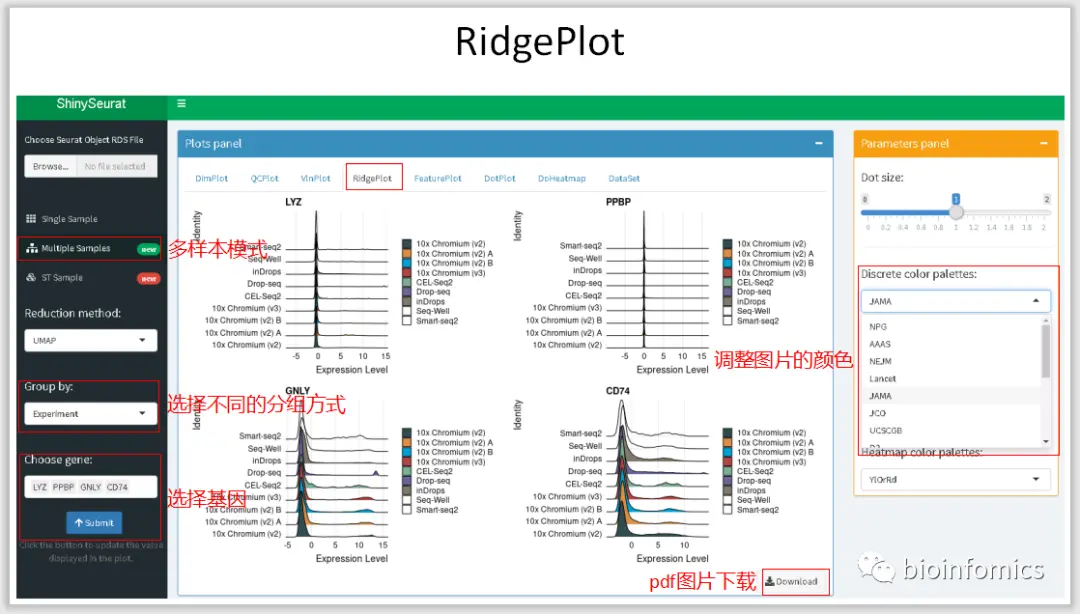
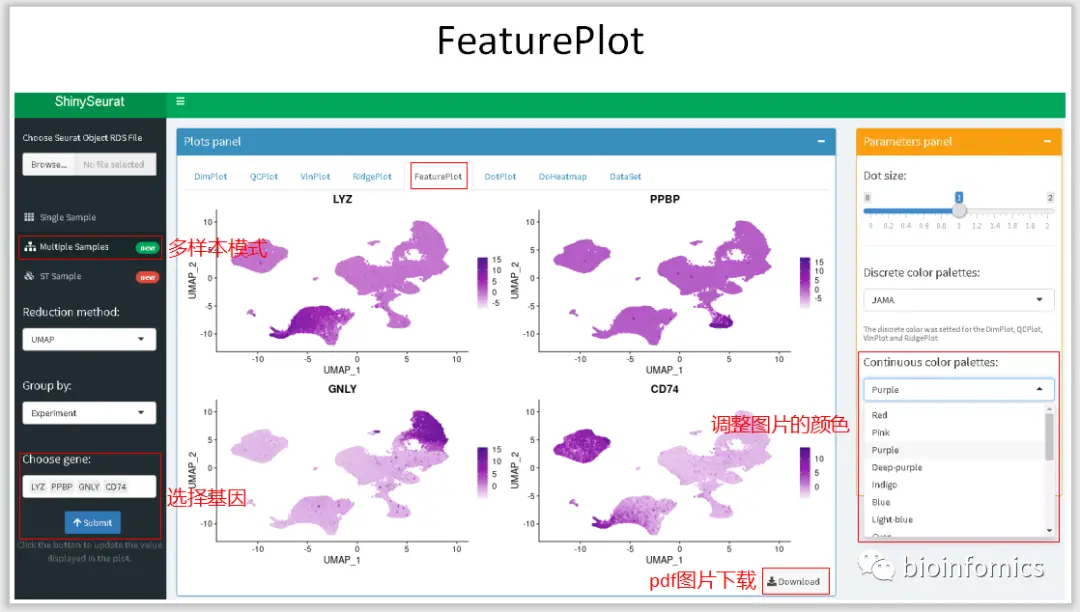
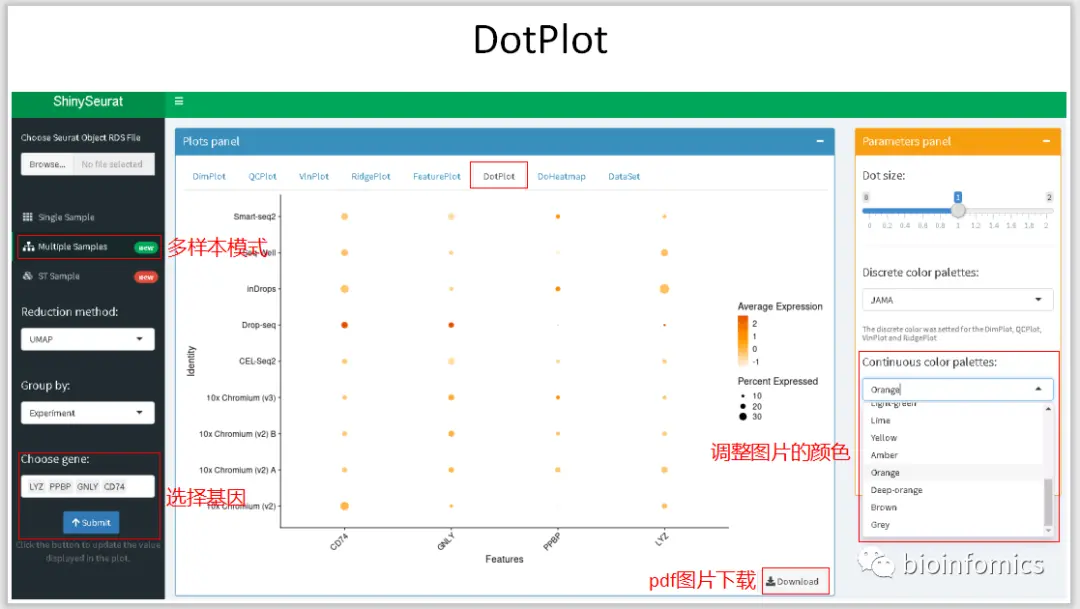
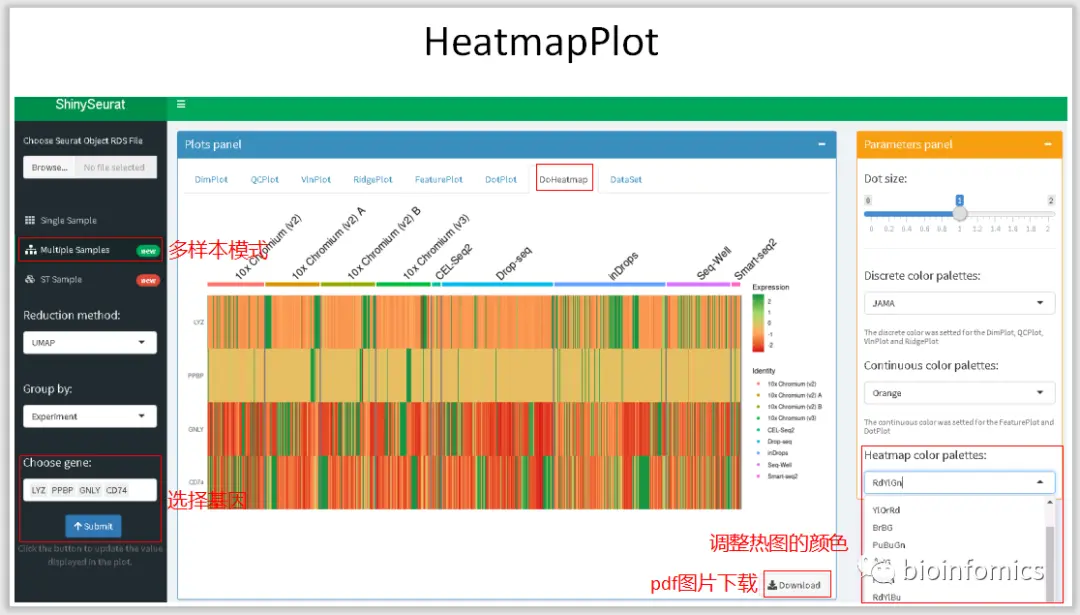
ST Sample Mode ST样本数据可视化展示
