Monocle2使用反向图嵌入(Reversed Graph Embedding)的机器学习算法,来对单细胞RNA-seq数据进行单细胞发育轨迹推断分析。Monocle2不是通过实验方法将细胞纯化成不同的离散状态,而是使用一种算法来学习每个细胞在动态生物学过程中经历的基因表达变化的顺序。一旦它了解了基因表达变化的整体“轨迹”,Monocle2就可以将每个细胞分配到发育轨迹中的适当位置中。并且,我们还可以使用Monocle2的差异分析工具来查找在发育轨迹过程中受到调控的基因。如果这个发育过程中存在多个分支结果,Monocle2将重建一个“分支”轨迹。这些不同的分支与细胞的“决策”相对应,Monocle2提供了强大的分析工具来识别受它们影响的基因,并参与这些基因的形成。
在整个生命的发育过程中,细胞会对不同的刺激做出相应的响应,从一种功能“状态”转变到另一种功能“状态”。不同状态下的细胞会表达不同的基因,产生不同的蛋白质及其代谢产物,从而实现不同功能状态下的工作。当细胞在不同功能状态之间转变时,它们会经历一个转录重新配置的过程,其中一些基因的表达被沉默,而另一些基因则被激活。这些细胞的瞬时状态通常很难被表征,因为在更稳定的端点状态之间纯化细胞可能是非常困难的或不可能的。单细胞RNA-Seq技术可以使我们在不需要纯化细胞的情况下,通过拟时序分析推断出这些瞬时状态下的细胞状态。然而,要做到这一点,我们必须确定每个细胞在可能的状态范围内的位置。
细胞排序的工作流程
Trajectory step 1: choose genes that define a cell’s progress(选择用于定义细胞进程的基因)
首先,我们必须选择用哪些基因去用于后续的细胞排序过程,这个过程称为特征选择(feature selection),筛选出的这些基因对后续细胞轨迹的形状有着最重要的影响。因此,我们应该尽可能的选择那些最能反映细胞状态的基因。
这里,我们需要选择用哪些基因来定义细胞肌发生的进程。我们最终希望能获得一组基因集,这些基因的表达随着研究的发育过程的进展而增加(或减少)。筛选用于细胞排序的基因的一种有效方法是,将发育过程开始时收集的细胞与结束时收集的细胞简单地进行比较,并找到差异表达的基因。
# 使用differentialGeneTest函数进行差异分析diff_test_res <- differentialGeneTest(HSMM_myo[expressed_genes,],fullModelFormulaStr = "~Media")# 提取显著的差异表达基因ordering_genes <- row.names (subset(diff_test_res, qval < 0.01))# 细胞筛选过滤HSMM_myo <- setOrderingFilter(HSMM_myo, ordering_genes)# 筛选结果可视化plot_ordering_genes(HSMM_myo)
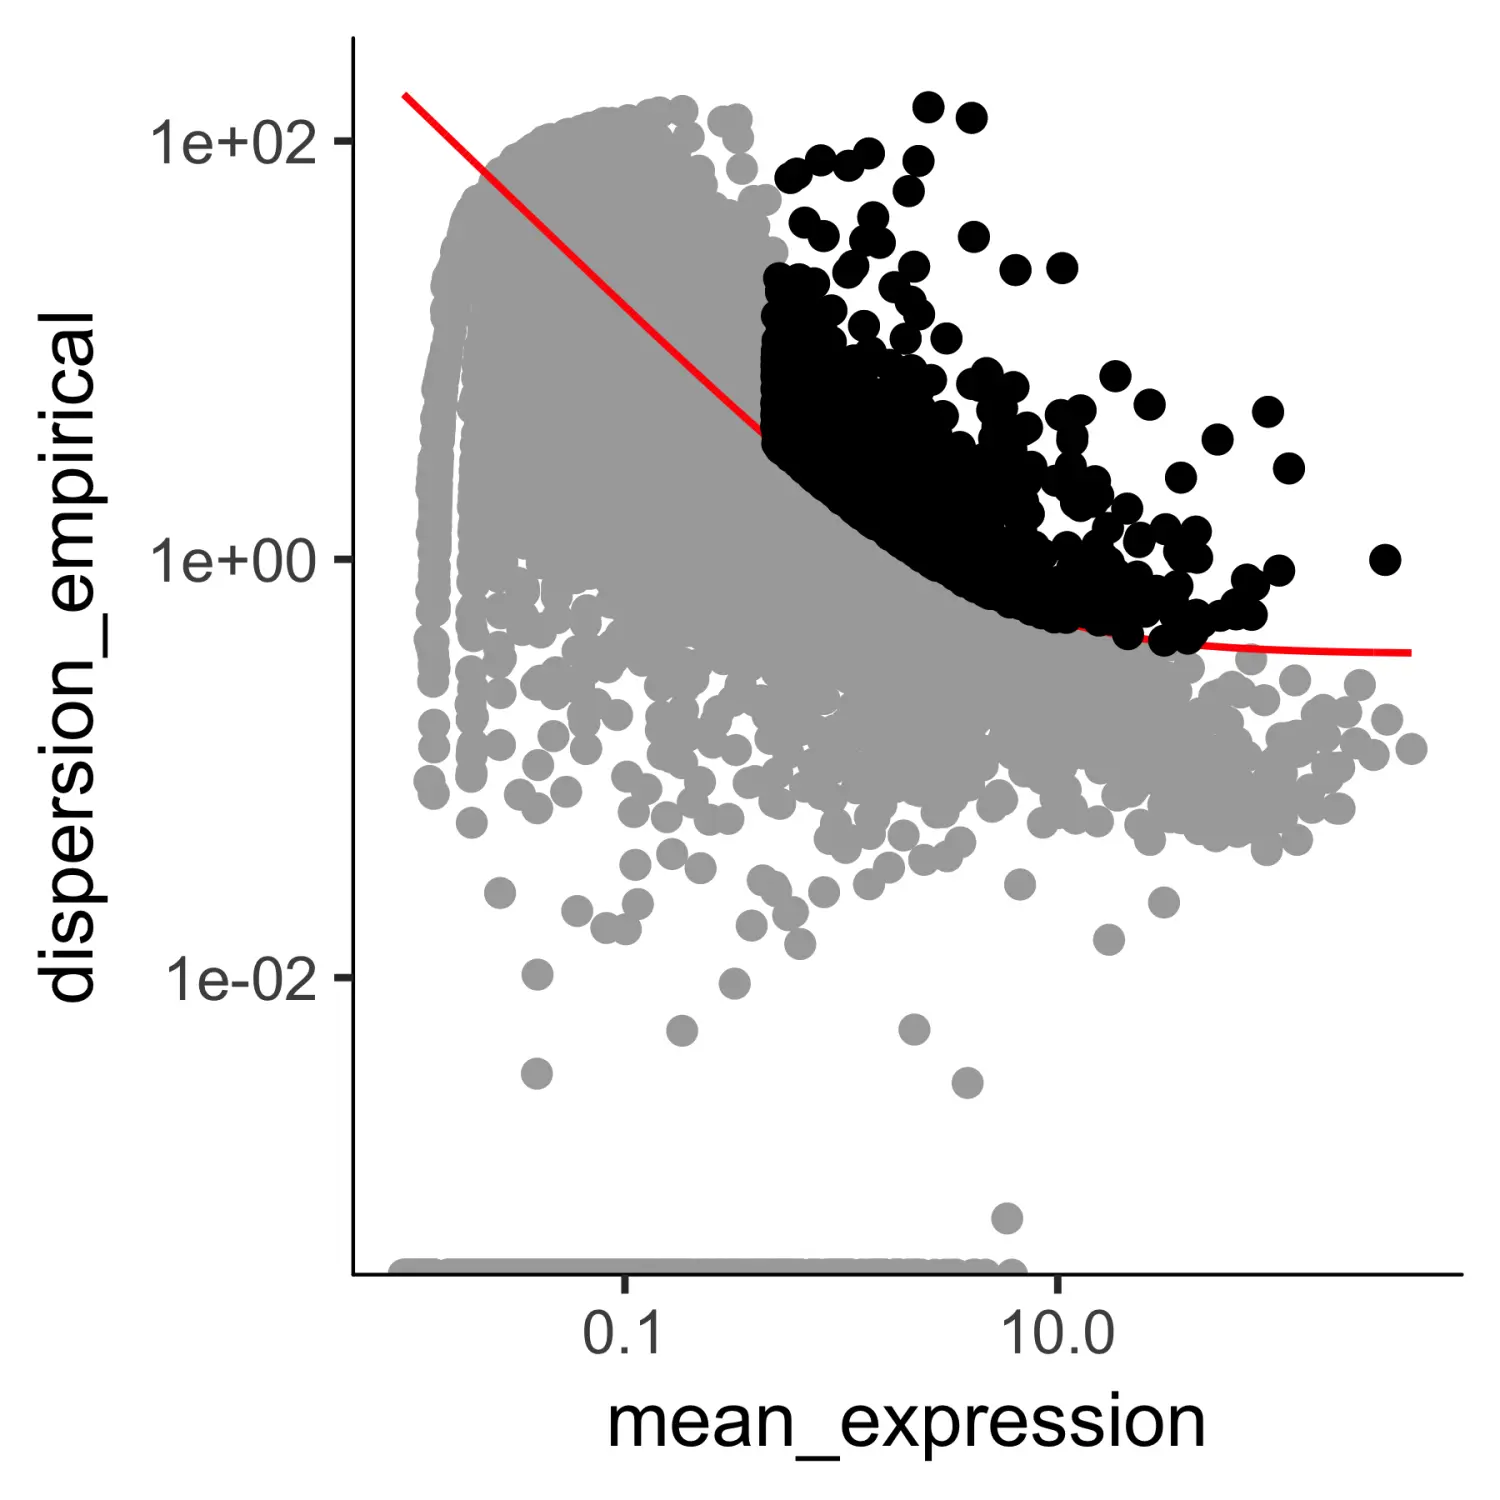
上图中,那些黑色的点对应的基因,即为筛选出的用于后续对细胞进行排序的基因。
Trajectory step 2: reduce data dimensionality(降低数据的维度)
接下来,我们使用reduceDimension函数对筛选出的基因进行数据降维处理,
# 使用reduceDimension函数进行数据降维,并指定method = 'DDRTree'参数使用DDRTree方法HSMM_myo <- reduceDimension(HSMM_myo, max_components = 2,method = 'DDRTree')
Trajectory step 3: order cells along the trajectory(根据发育轨迹对细胞进行排序)
最后,对于降维后的数据,我们将使用orderCells函数对细胞按发育轨迹进行排序。
# 使用orderCells函数进行细胞排序HSMM_myo <- orderCells(HSMM_myo)# 使用plot_cell_trajectory函数对排序的细胞进行可视化plot_cell_trajectory(HSMM_myo, color_by = "Hours")

从上图可以看出,该细胞发育轨迹呈树状结构。其中,在0时收集的细胞大多位于树的顶端之一附近,而其他的则分布在两个“分支”之间。Monocle2不知道先验树的哪个轨迹作为“beginning”,因此我们经常不得不使用root_state参数再次调用orderCells函数来指定起点。
plot_cell_trajectory(HSMM_myo, color_by = "State")
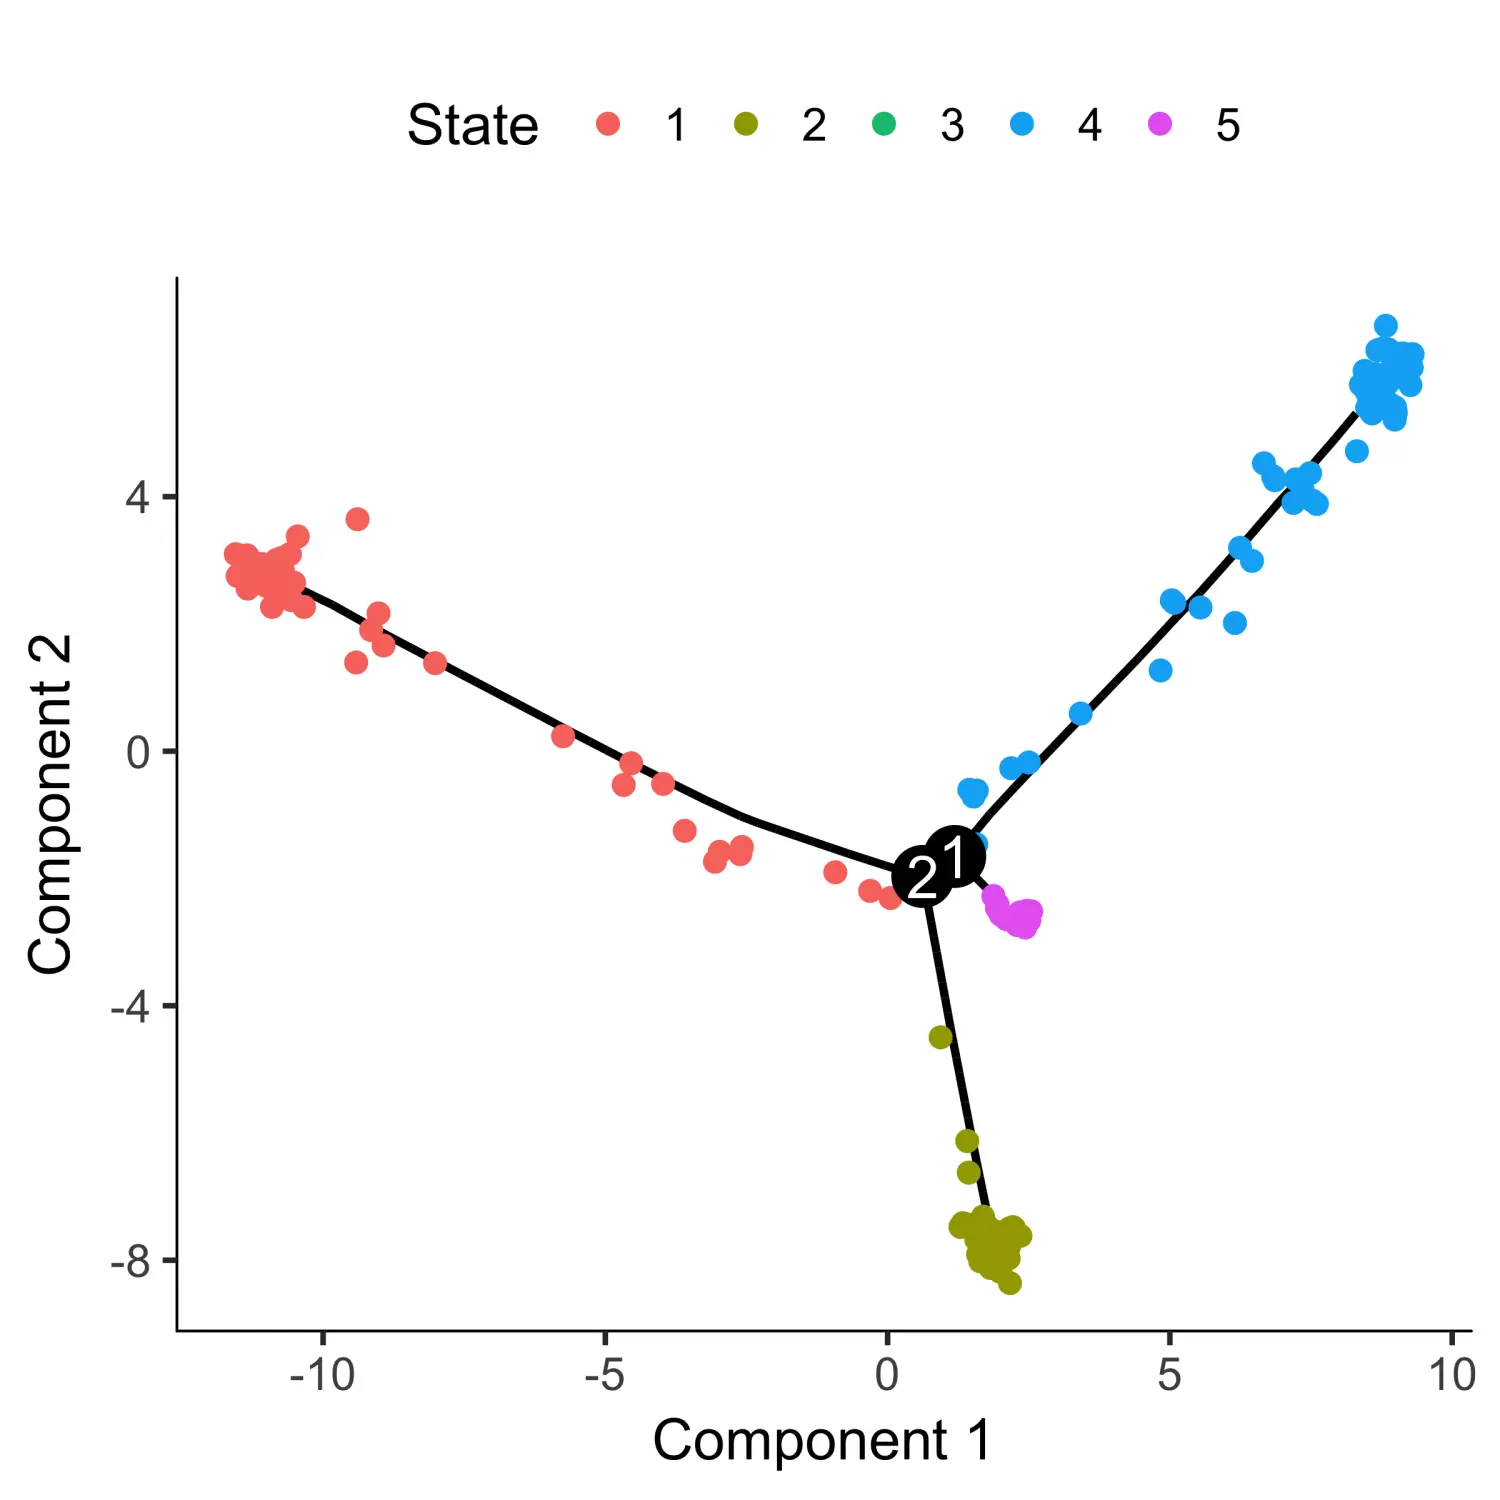
这里我们使用细胞所处的状态对细胞进行着色。
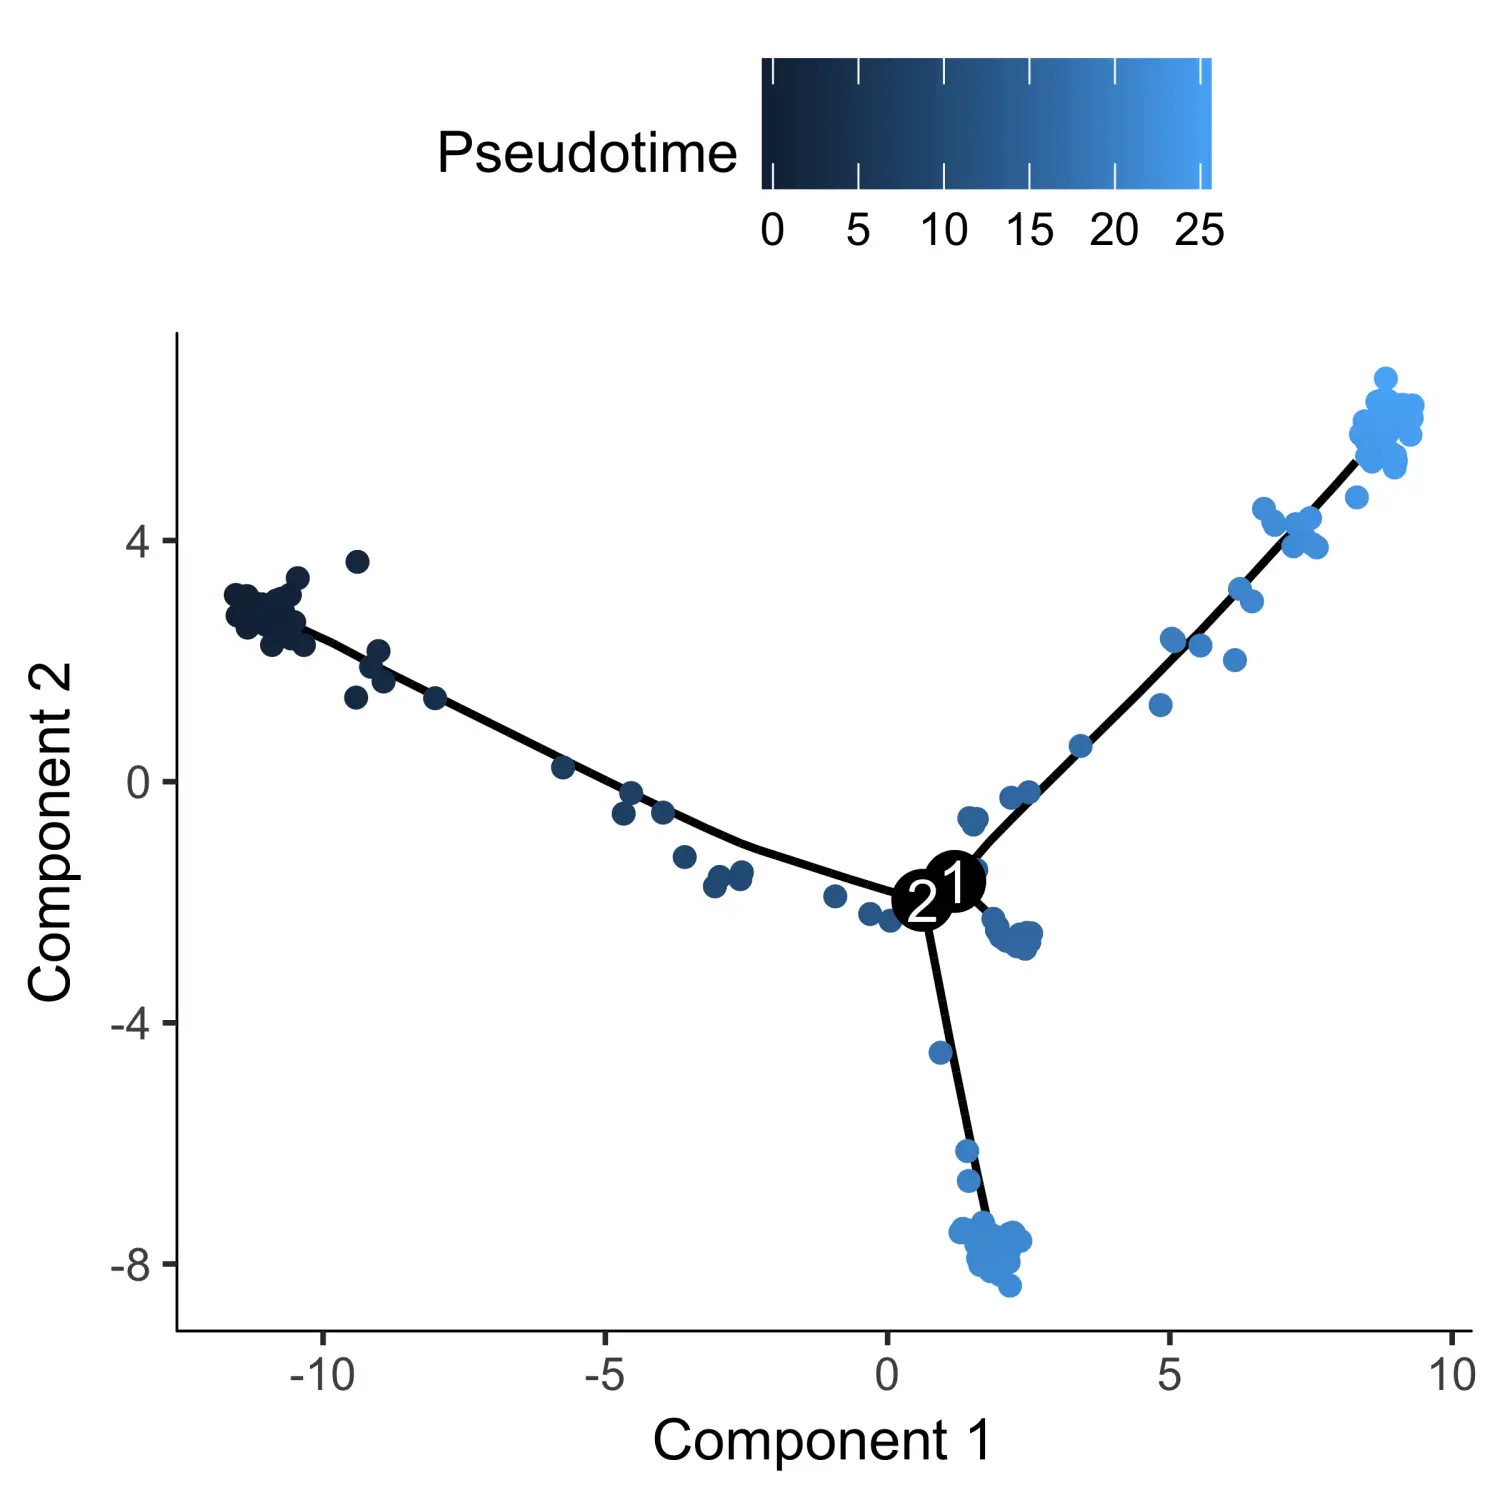
GM_state <- function(cds){if (length(unique(pData(cds)$State)) > 1){T0_counts <- table(pData(cds)$State, pData(cds)$Hours)[,"0"]return(as.numeric(names(T0_counts)[which(T0_counts == max(T0_counts))]))} else {return (1)}}# 使用root_state参数指定起点HSMM_myo <- orderCells(HSMM_myo, root_state = GM_state(HSMM_myo))# 根据伪时间对细胞进行着色plot_cell_trajectory(HSMM_myo, color_by = "Pseudotime")
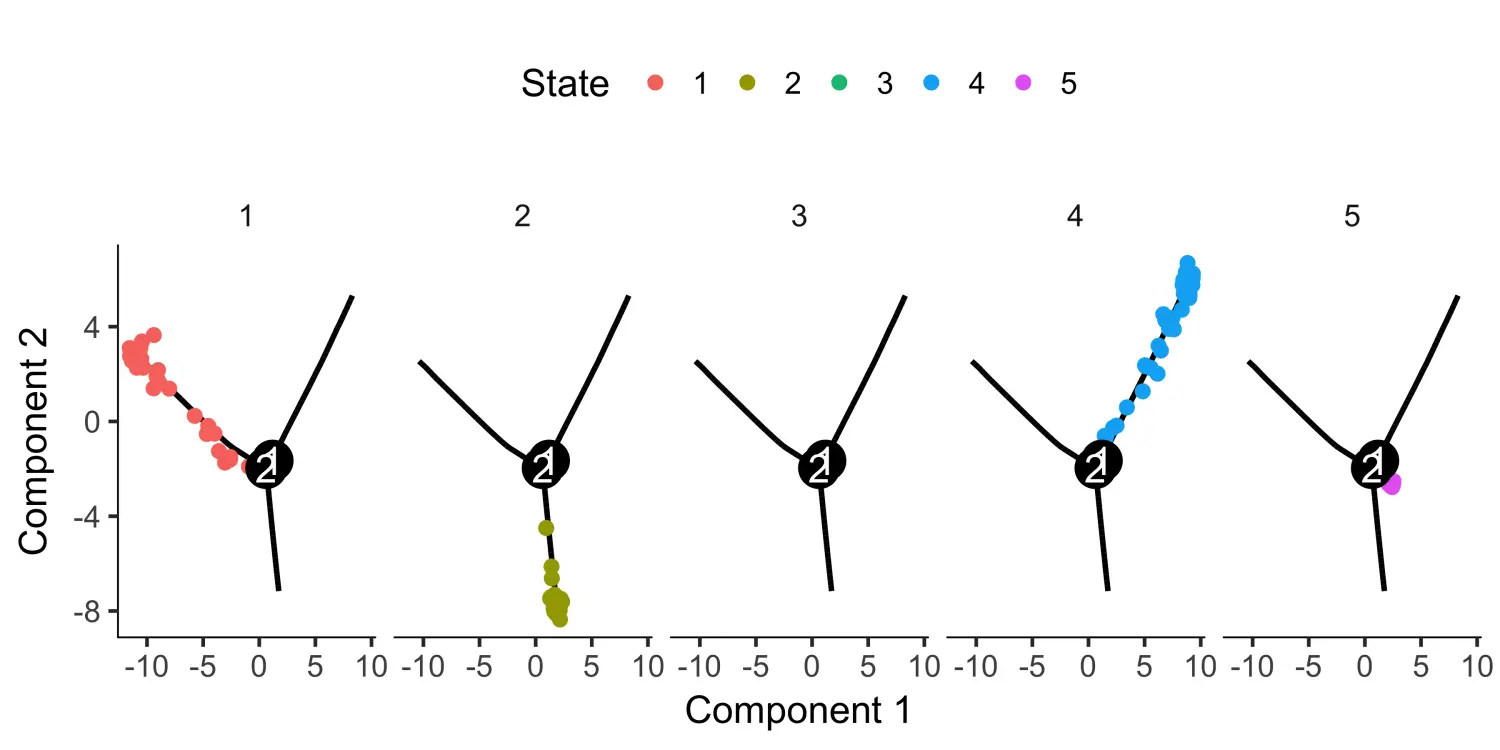
# 根据细胞的状态进行分面展示plot_cell_trajectory(HSMM_myo, color_by = "State") +facet_wrap(~State, nrow = 1)
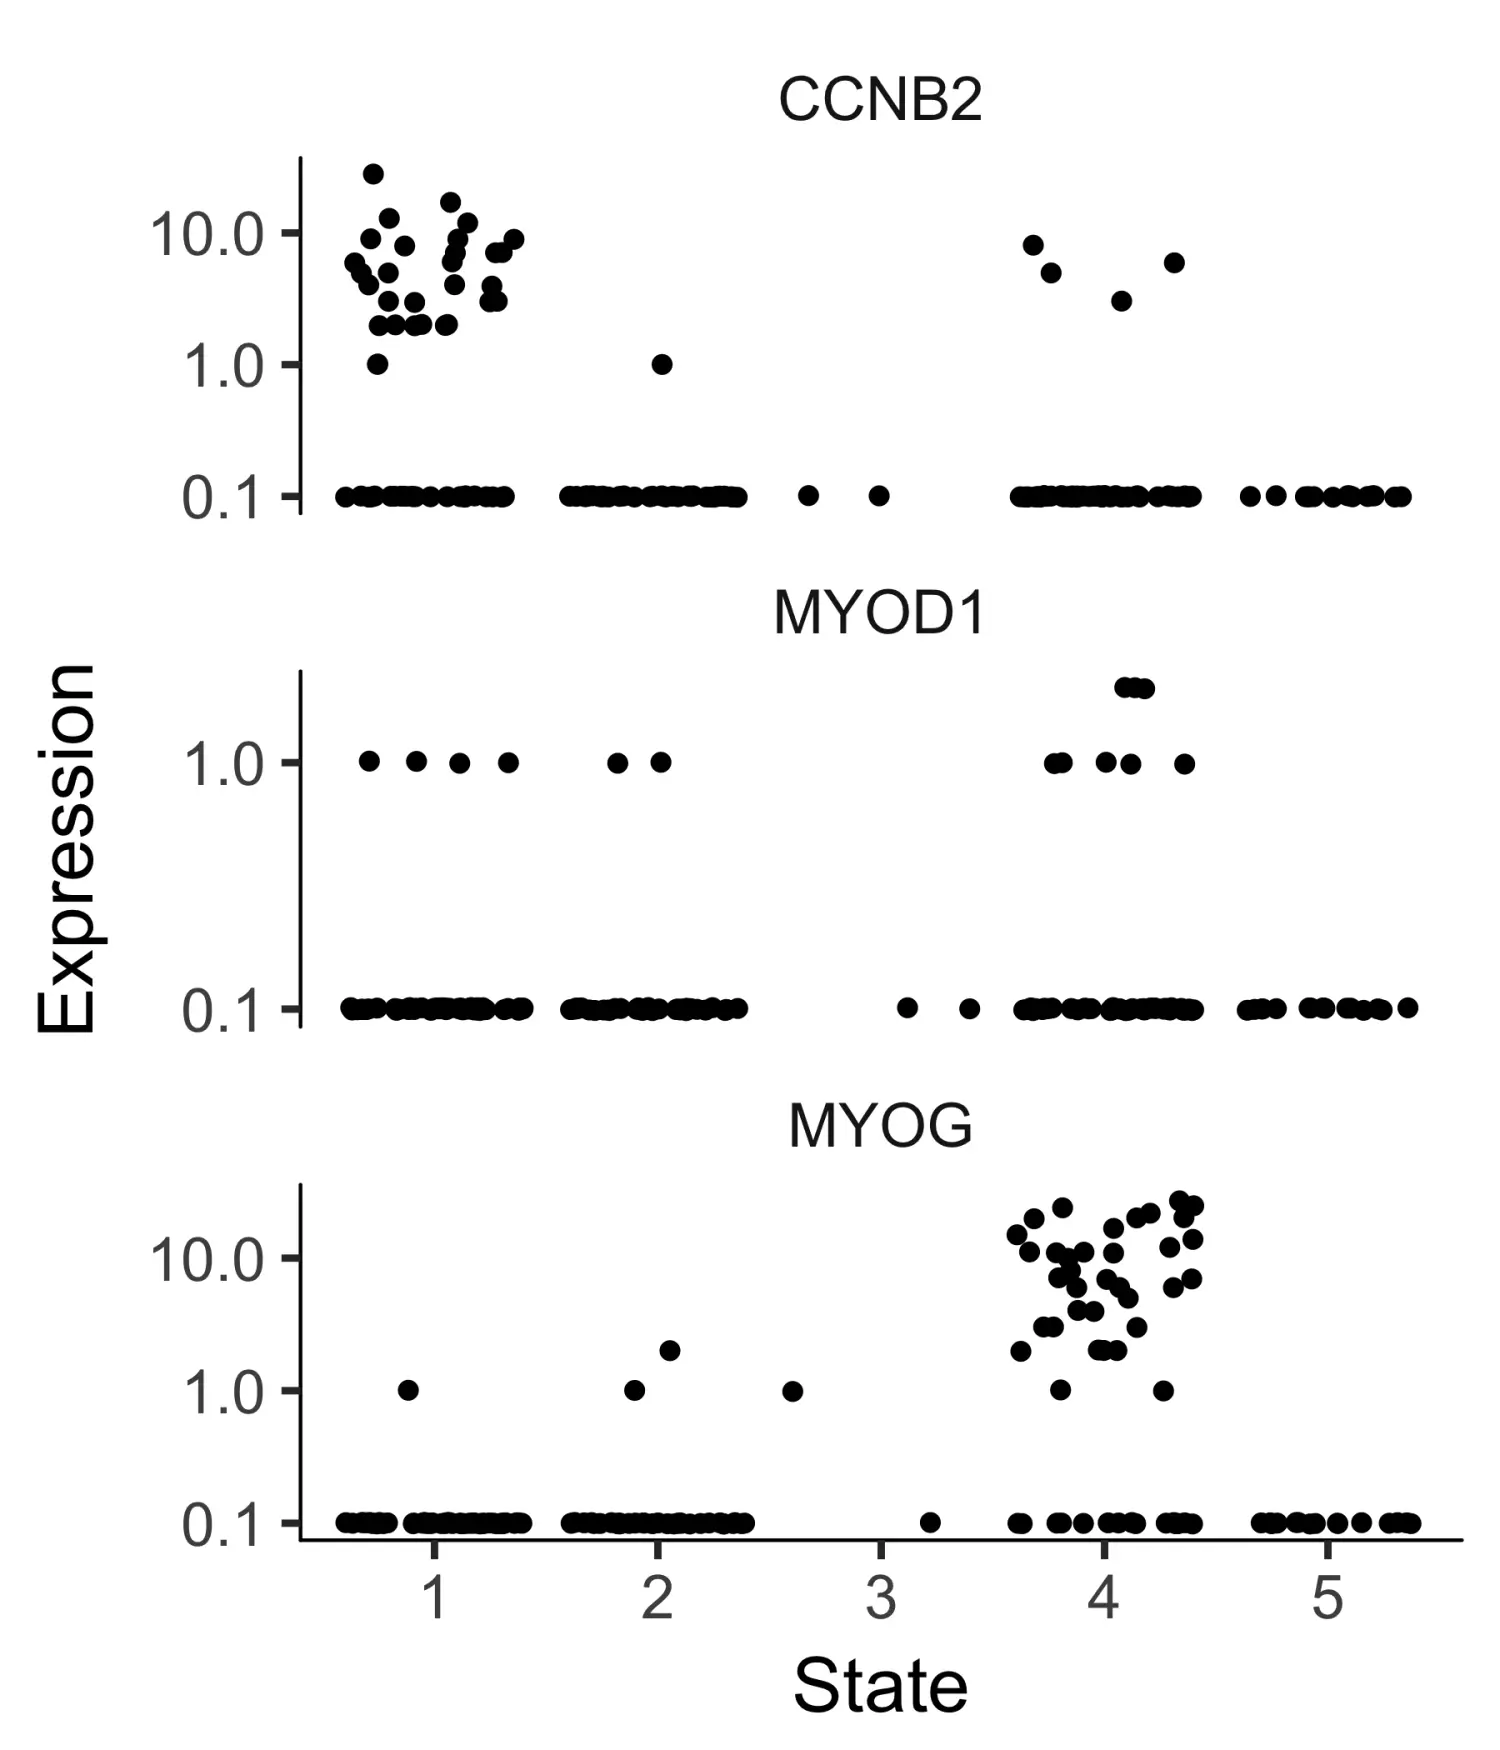
如果我们没有时间序列数据,则可能需要根据已有的生物学知识,利用某些marker标记基因的表达来设置root。例如,在该实验中,高度增殖的祖细胞群正在产生两种类型的有丝分裂后细胞。因此,根部应具有表达高水平增殖marker基因的细胞。我们可以使用抖动图来可视化marker基因的表达,找出marker基因的哪个状态对应于快速增殖的细胞:
# 选择marker基因blast_genes <- row.names(subset(fData(HSMM_myo),gene_short_name %in% c("CCNB2", "MYOD1", "MYOG")))# 使用plot_genes_jitter函数可视化marker基因的表达plot_genes_jitter(HSMM_myo[blast_genes,],grouping = "State",min_expr = 0.1)
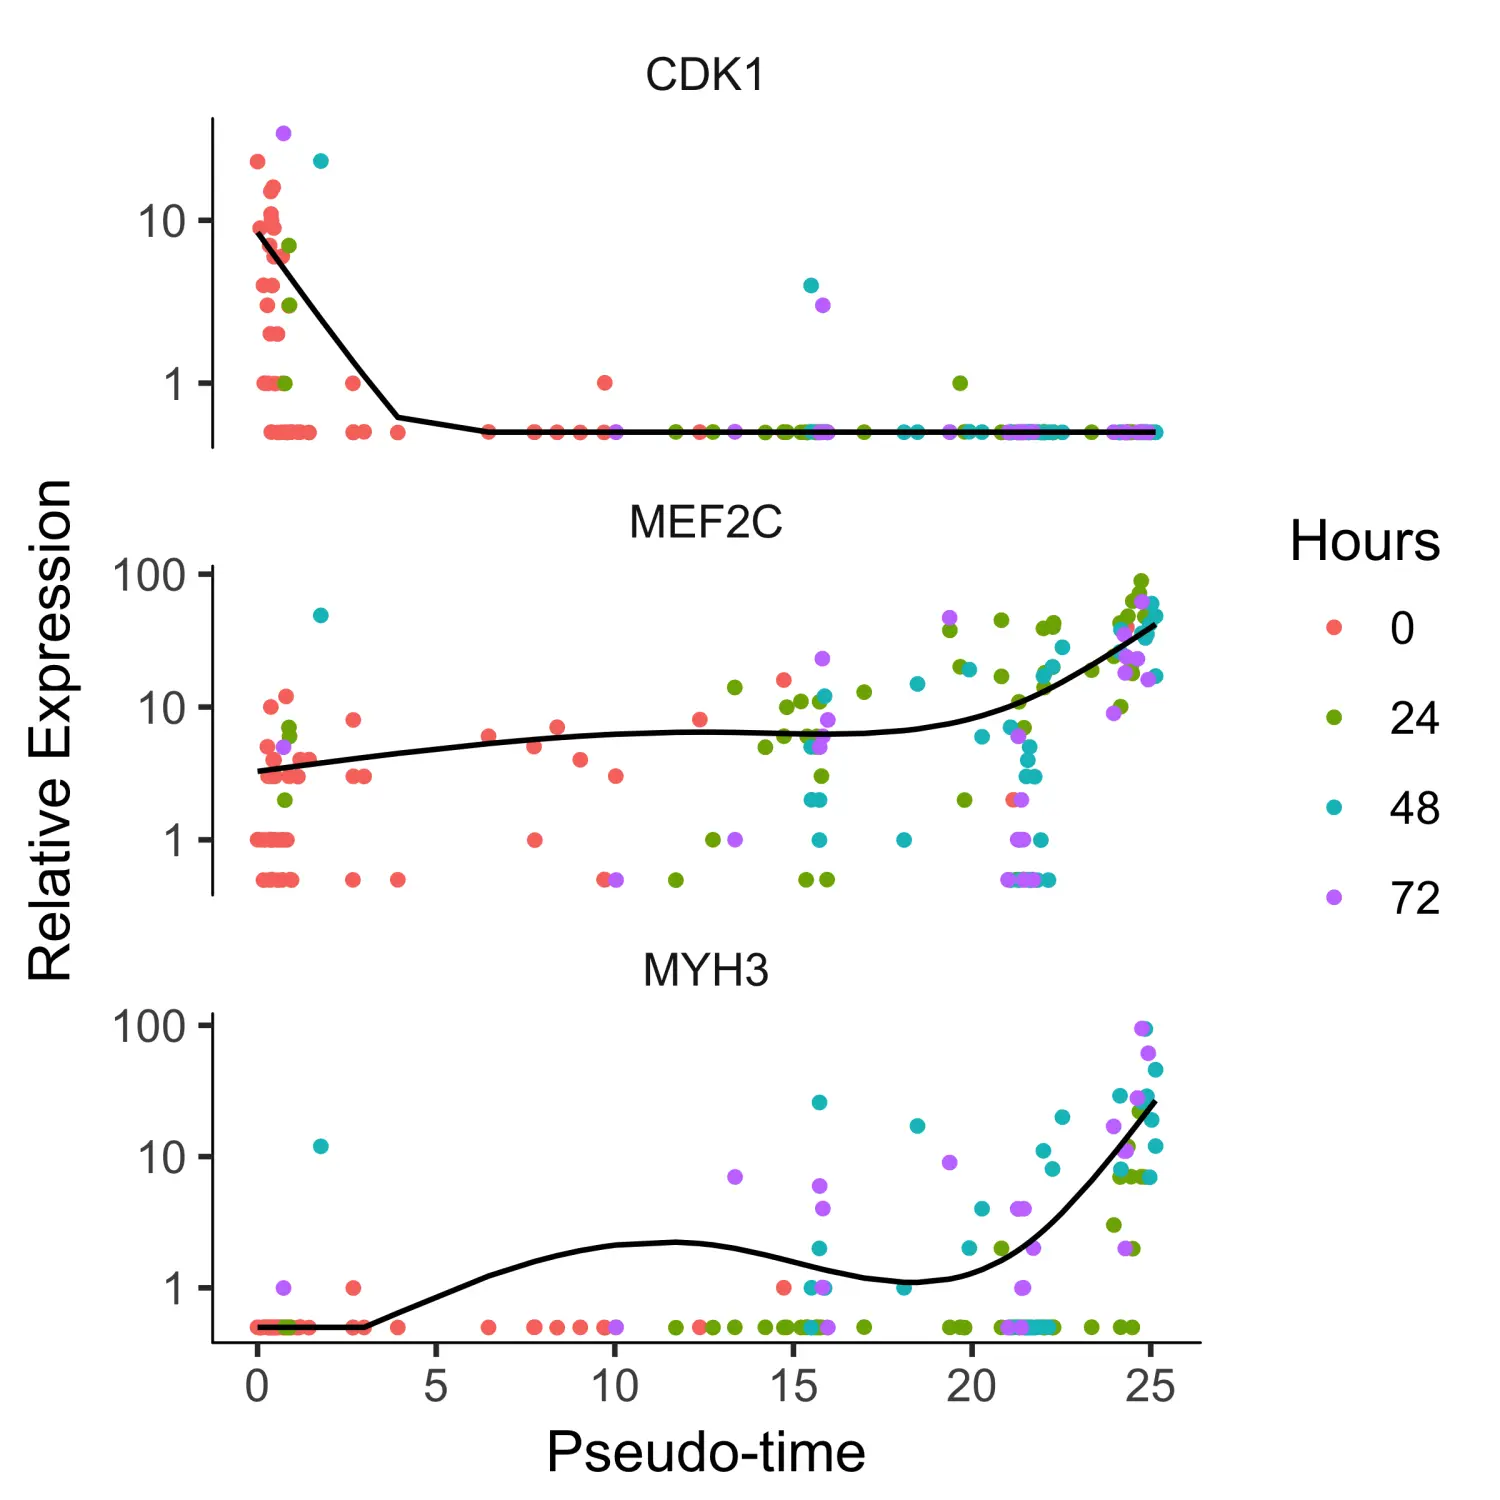
为了确认细胞排序的准确性,我们可以选择成肌过程的几个marker基因,绘制它们的表达在伪时间过程中的变化。
HSMM_expressed_genes <- row.names(subset(fData(HSMM_myo),num_cells_expressed >= 10))HSMM_filtered <- HSMM_myo[HSMM_expressed_genes,]# 筛选marker基因my_genes <- row.names(subset(fData(HSMM_filtered),gene_short_name %in% c("CDK1", "MEF2C", "MYH3")))cds_subset <- HSMM_filtered[my_genes,]# 使用plot_genes_in_pseudotime函数可视化marker基因的表达plot_genes_in_pseudotime(cds_subset, color_by = "Hours")
Alternative choices for ordering genes
Ordering based on genes that differ between clusters
我们建议用户使用通过无监督程序“dpFeature”选择的基因用于后续的细胞排序。
要使用dpFeature,我们首先筛选出至少在5%的所有细胞中都表达的基因。
HSMM_myo <- detectGenes(HSMM_myo, min_expr = 0.1)fData(HSMM_myo)$use_for_ordering <- fData(HSMM_myo)$num_cells_expressed > 0.05 * ncol(HSMM_myo)
接下来,我们执行PCA分析,以识别每个PC所能解释的方差,可以通过绘制碎石图来查看选择需要的PC。
plot_pc_variance_explained(HSMM_myo, return_all = F)
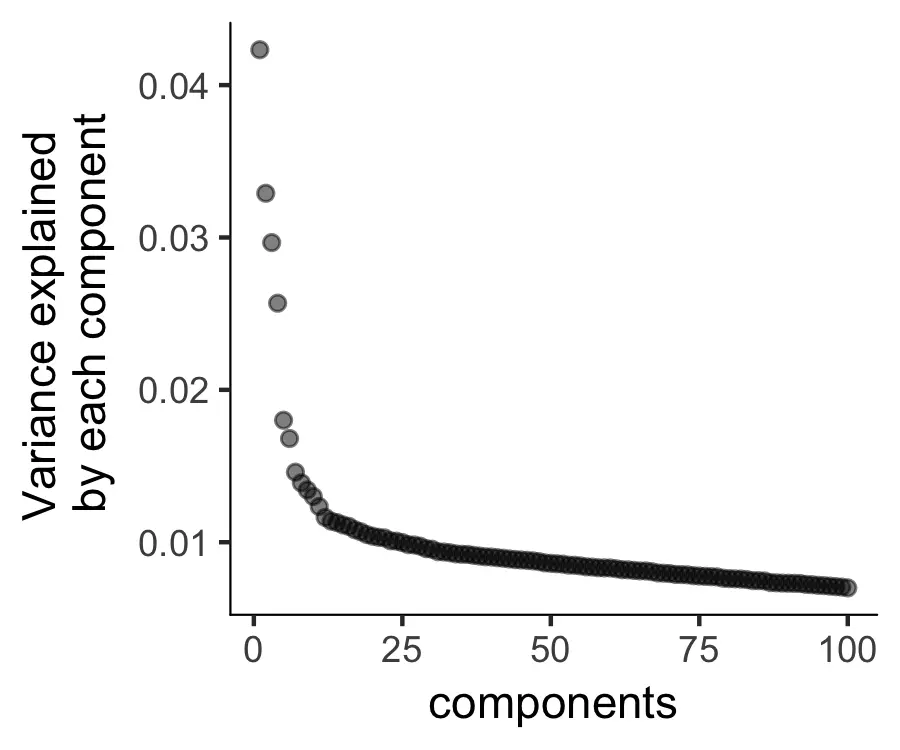
然后,我们将那些主要的PC使用t-SNE降维的方法进行降维处理,并将其投影到二维层面进行可视化展示。
# 使用reduceDimension函数进行数据降维HSMM_myo <- reduceDimension(HSMM_myo,max_components = 2,norm_method = 'log',num_dim = 3,reduction_method = 'tSNE',verbose = T)# 使用clusterCells函数对细胞进行聚类分群HSMM_myo <- clusterCells(HSMM_myo, verbose = F)# 使用plot_cell_clusters函数对聚类后的结果进行可视化plot_cell_clusters(HSMM_myo, color_by = 'as.factor(Cluster)')plot_cell_clusters(HSMM_myo, color_by = 'as.factor(Hours)')
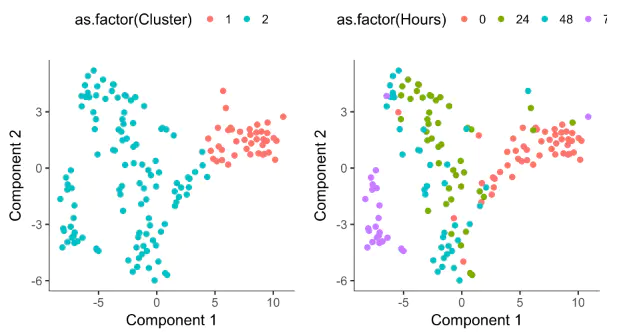
After we confirm the clustering makes sense, we can then perform differential gene expression test as a way to extract the genes that distinguish them.
# 使用differentialGeneTest函数进行差异表达分析clustering_DEG_genes <- differentialGeneTest(HSMM_myo[HSMM_expressed_genes,],fullModelFormulaStr = '~Cluster',cores = 1)
We will then select the top 1000 significant genes as the ordering genes.
# 选择top 1000的基因HSMM_ordering_genes <- row.names(clustering_DEG_genes)[order(clustering_DEG_genes$qval)][1:1000]HSMM_myo <- setOrderingFilter(HSMM_myo, ordering_genes = HSMM_ordering_genes)# 数据降维HSMM_myo <- reduceDimension(HSMM_myo, method = 'DDRTree')# 细胞排序HSMM_myo <- orderCells(HSMM_myo)# 设置root状态HSMM_myo <- orderCells(HSMM_myo, root_state = GM_state(HSMM_myo))# 排序结果可视化plot_cell_trajectory(HSMM_myo, color_by = "Hours")
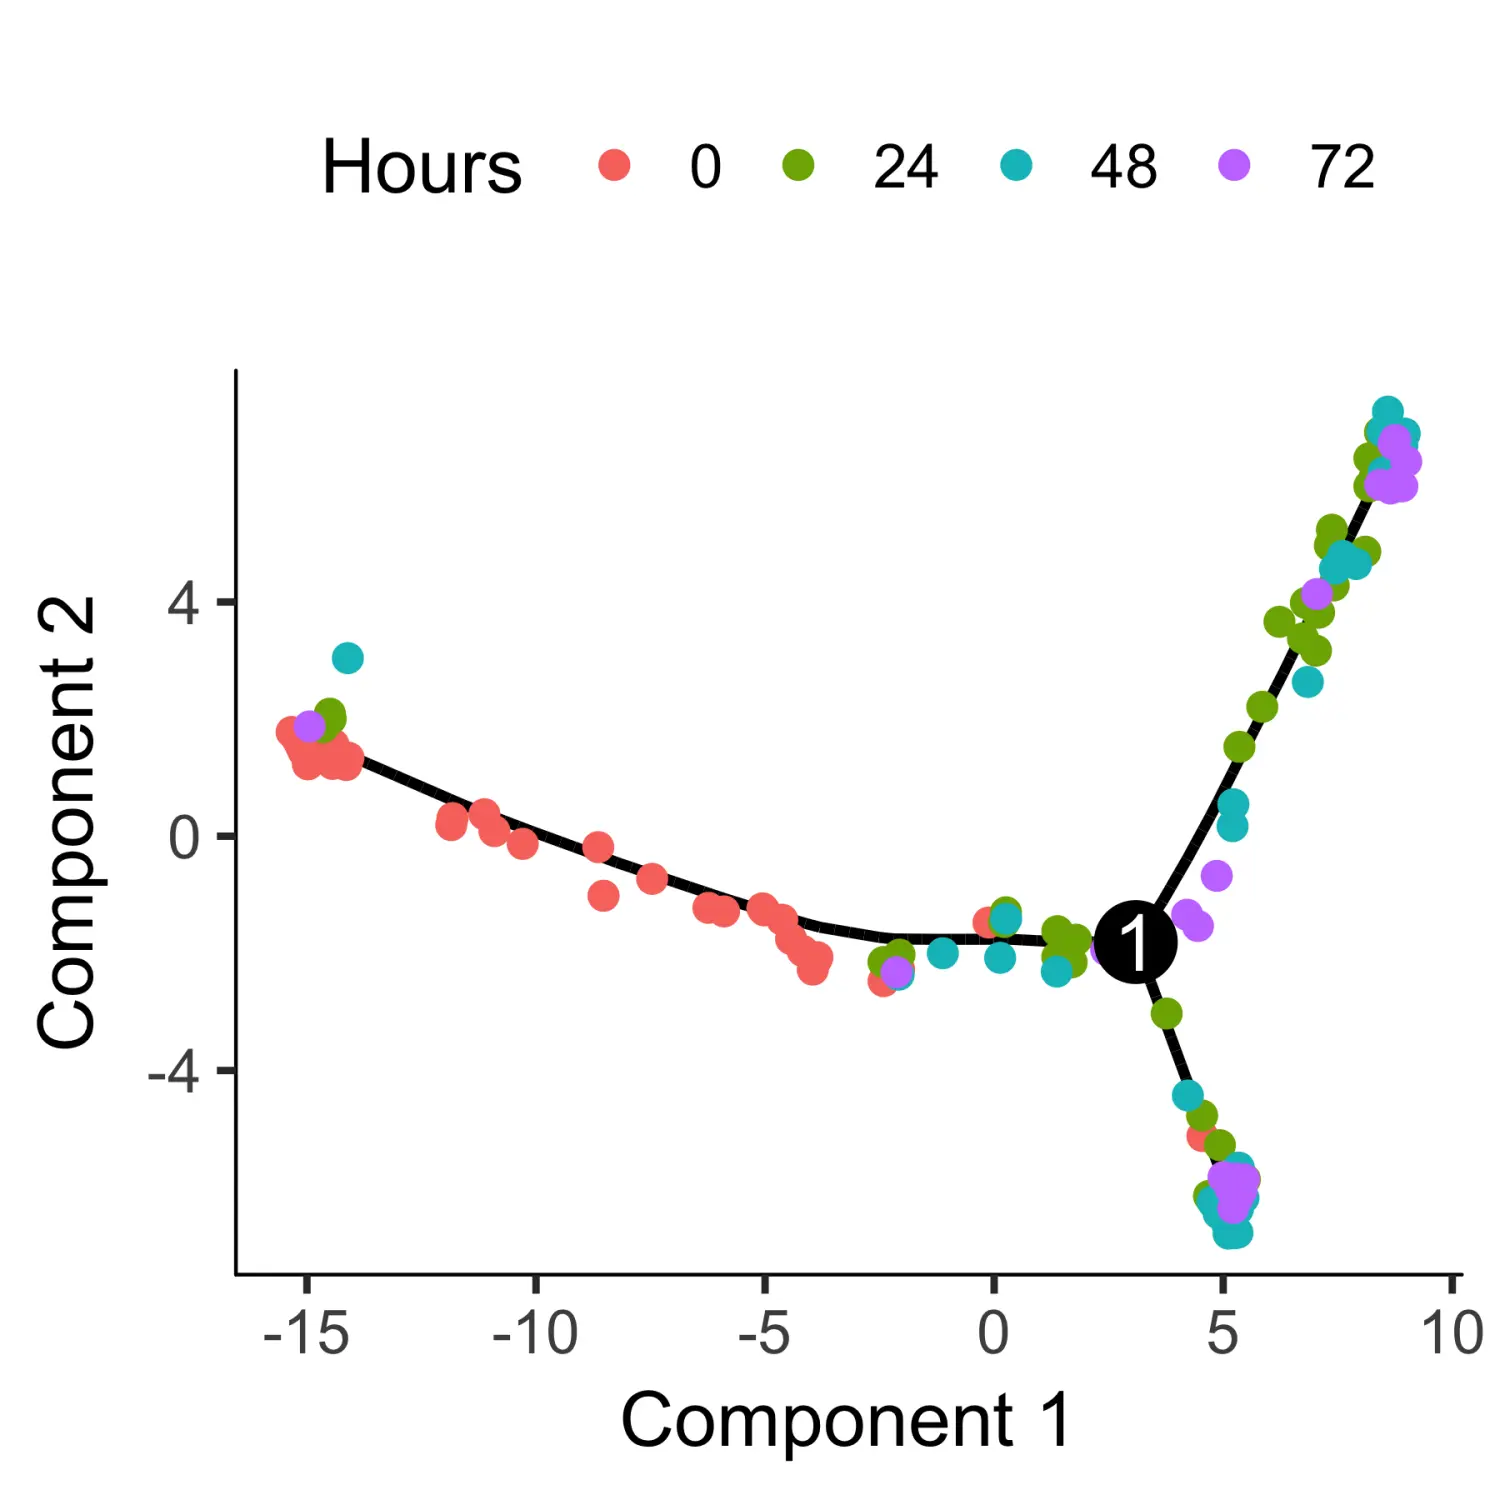
Selecting genes with high dispersion across cells
变化很大的基因通常对于识别细胞亚群或沿着轨迹排序细胞很有帮助。在单细胞RNA-Seq中,基因的变异通常取决于其均值,因此我们必须谨慎选择如何根据它们的变化来选择基因。
disp_table <- dispersionTable(HSMM_myo)ordering_genes <- subset(disp_table,mean_expression >= 0.5 &dispersion_empirical >= 1 * dispersion_fit)$gene_id
Ordering cells using known marker genes
无监督聚类对细胞进行排序是可取的,因为它避免了在分析中引入偏差。但是,无监督的机器学习方法也会存在一定的问题。例如,当我们使用无监督学习时,处于不同细胞周期的细胞会对发育轨迹的形状产生重大的影响。但是,如果我们希望专注于生物学过程中与细胞周期无关的影响,该怎么办?Monocle2的“半监督”聚类排序方法可以帮助我们实现相应的处理。
以半监督聚类方式对细胞进行排序非常简单。首先使用CellTypeHierchy系统定义标记细胞进展的基因,这与我们将其用于细胞类型分类的方式非常相似。然后,使用它来选择与这些标记共同变化的有序基因。最后,就像我们在无监督的排序中一样,根据这些基因对细胞进行排序。因此,无监督排序和半监督排序之间的唯一区别是我们使用哪些基因进行排序。
# 选择marker基因CCNB2_id <- row.names(subset(fData(HSMM_myo), gene_short_name == "CCNB2"))MYH3_id <- row.names(subset(fData(HSMM_myo), gene_short_name == "MYH3"))# 初始化CellTypeHierarchy对象cth <- newCellTypeHierarchy()# 根据marker基因的表达标记不同类型的细胞cth <- addCellType(cth,"Cycling myoblast",classify_func = function(x) { x[CCNB2_id,] >= 1 })cth <- addCellType(cth,"Myotube",classify_func = function(x) { x[MYH3_id,] >= 1 })cth <- addCellType(cth,"Reserve cell",classify_func = function(x) { x[MYH3_id,] == 0 & x[CCNB2_id,] == 0 })# 使用classifyCells函数对细胞进行分类HSMM_myo <- classifyCells(HSMM_myo, cth)
Now we select the set of genes that co-vary (in either direction) with these two “bellweather” genes:
marker_diff <- markerDiffTable(HSMM_myo[HSMM_expressed_genes,],cth,cores = 1)#semisup_clustering_genes <- row.names(subset(marker_diff, qval < 0.05))# 选择top 1000的基因semisup_clustering_genes <-row.names(marker_diff)[order(marker_diff$qval)][1:1000]
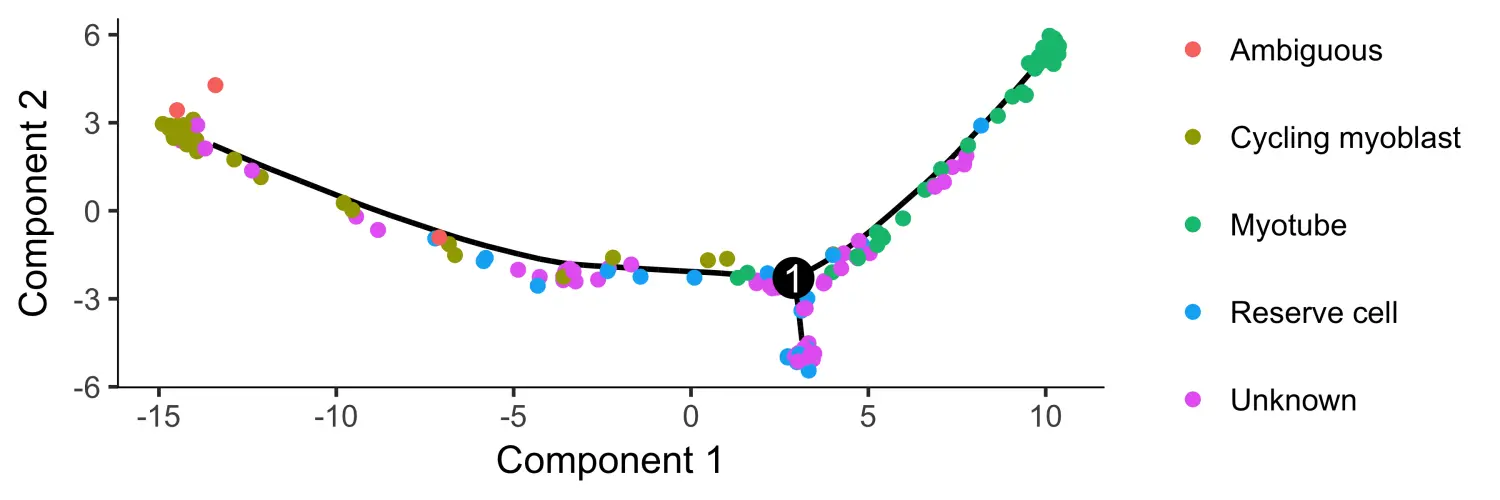
Using the top 1000 genes for ordering produces a trajectory that’s highly similar to the one we obtained with unsupervised methods, but it’s a little “cleaner”.
HSMM_myo <- setOrderingFilter(HSMM_myo, semisup_clustering_genes)#plot_ordering_genes(HSMM_myo)# 数据降维HSMM_myo <- reduceDimension(HSMM_myo, max_components = 2,method = 'DDRTree', norm_method = 'log')# 对细胞进行排序HSMM_myo <- orderCells(HSMM_myo)HSMM_myo <- orderCells(HSMM_myo, root_state = GM_state(HSMM_myo))# 细胞排序结果可视化plot_cell_trajectory(HSMM_myo, color_by = "CellType") +theme(legend.position = "right")
参考来源:http://cole-trapnell-lab.github.io/monocle-release/docs/


