叠加图层
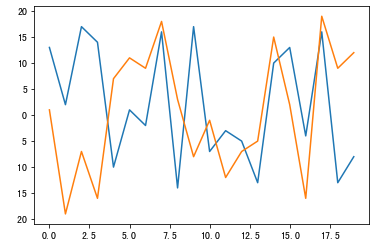
matplotlib绘图,是一层一层叠加上的,如下所示:2行代码,在一个画布上,叠加出2个折线图
#matplotlib绘图,是一层一层叠加上的,如下所示:2行代码,在一个画布上,叠加出2个折线图plt.plot(np.random.random_integers(-20,20,20))plt.plot(np.random.random_integers(-20,20,20))plt.show()
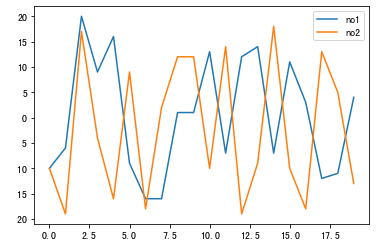
添加图例
方法1:在plt.legend()中添加图例
#添加图例方法1plt.plot(np.random.random_integers(-20,20,20))plt.plot(np.random.random_integers(-20,20,20))plt.legend(('no1','no2'))#在legend里添加图例名称plt.show()

方法2:在绘图时设置标签,并打开plt.legend()/
#添加图例方法2plt.plot(np.random.random_integers(-20,20,20),label='no1',color='red')#在绘图时直接添加图例名称plt.plot(np.random.random_integers(-20,20,20),label='no2',color='blue')plt.legend()#打开图例plt.show()
利用循环,在一个画布上叠加图层
#输出表格:学历要求、公司ID、平均薪资、招聘人数
data = df.groupby(['education','companyId']).aggregate(['mean','count']).salary.reset_index()
data

education    companyId    mean    count
0    不限    228    10.0    1
1    不限    280    10.0    2
2    不限    329    10.0    1
3    不限    347    15.0    1
4    不限    707    7.0    2
...    ...    ...    ...    ...
2626    硕士    154323    8.0    1
2627    硕士    155154    20.0    2
2628    硕士    155494    10.0    4
2629    硕士    156192    8.0    1
2630    硕士    157392    20.0    2
2631 rows × 4 columns
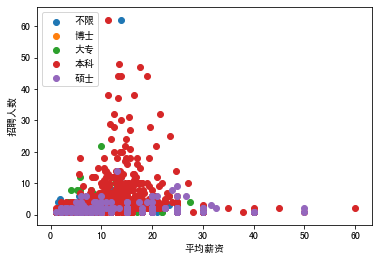
最终目的:按照不同学历,将每家公司的平均薪资和招聘人数,绘制在同一个散点图中。
对DataFrameGroupby设置循环,第一个变量是每一组的字段名,绘图时可作为图例
#对data重新按education分组。
for edu,grouped in data.groupby('education'):
  print(edu)
#对DataFrameGroupby设置循环,第一个变量是每一组的字段名,绘图时可作为图例

  不限
  博士
  大专
  本科
  硕士
对DateFrameGroupby设置循环,第二个变量是每一组的DataFrame ```python
对DateFrameGroupby设置循环,第二个变量是每一组的DataFrame
for edu,grouped in data.groupby(‘education’): print(grouped)
education companyId mean count 0 不限 228 10.0 1 1 不限 280 10.0 2 2 不限 329 10.0 1 3 不限 347 15.0 1 4 不限 707 7.0 2 .. … … … … [199 rows x 4 columns] education companyId mean count 199 博士 16797 30.0 1 200 博士 39699 15.0 2 201 博士 61844 20.0 2 202 博士 93989 9.0 2 203 博士 131806 15.0 1 education companyId mean count 204 大专 108 15.0 1 205 大专 133 10.0 2 206 大专 147 20.0 2 207 大专 329 9.0 2 208 大专 336 9.0 2 .. … … … …
[469 rows x 4 columns] education companyId mean count 673 本科 53 12.500000 6 674 本科 62 11.225806 62 675 本科 70 20.000000 2 676 本科 91 20.727273 22 677 本科 94 5.000000 1 … … … … … [1738 rows x 4 columns] education companyId mean count 2411 硕士 43 8.0 1 2412 硕士 62 25.0 2 2413 硕士 94 20.0 1 2414 硕士 108 20.0 1 2415 硕士 133 25.0 2 … … … … …
[220 rows x 4 columns]
- 所以现在要做的是:输出不同分组下的DataFrame对应的mean和count两个值
```python
#所以现在要做的是:输出不同分组下的DataFrame对应的mean和count两个值
for edu,grouped in data.groupby('education'):
    x=grouped.query('count<100')['mean'] #将每个mean值赋给x,过滤了招聘人数>=100的情况
    y=grouped.query('count<100')['count'] #将每个count值赋给y,过滤了招聘人数>=100的情况
    plt.scatter(x,y,label=edu) #以x和y作为散点图的横纵坐标,并将分组名称作为图例
plt.legend(loc = 'upper left') #打开图例,loc可设置图例的位置
plt.xlabel('平均薪资')
plt.ylabel('招聘人数')
plt.show()


