1.准备数据
import numpy as npimport matplotlib.pyplot as plt# 准备数据plot_x = np.linspace(-1., 6., 141)plot_x
array([-1. , -0.95, -0.9 , -0.85, -0.8 , -0.75, -0.7 , -0.65, -0.6 ,-0.55, -0.5 , -0.45, -0.4 , -0.35, -0.3 , -0.25, -0.2 , -0.15,-0.1 , -0.05, 0. , 0.05, 0.1 , 0.15, 0.2 , 0.25, 0.3 ,0.35, 0.4 , 0.45, 0.5 , 0.55, 0.6 , 0.65, 0.7 , 0.75,0.8 , 0.85, 0.9 , 0.95, 1. , 1.05, 1.1 , 1.15, 1.2 ,1.25, 1.3 , 1.35, 1.4 , 1.45, 1.5 , 1.55, 1.6 , 1.65,1.7 , 1.75, 1.8 , 1.85, 1.9 , 1.95, 2. , 2.05, 2.1 ,2.15, 2.2 , 2.25, 2.3 , 2.35, 2.4 , 2.45, 2.5 , 2.55,2.6 , 2.65, 2.7 , 2.75, 2.8 , 2.85, 2.9 , 2.95, 3. ,3.05, 3.1 , 3.15, 3.2 , 3.25, 3.3 , 3.35, 3.4 , 3.45,3.5 , 3.55, 3.6 , 3.65, 3.7 , 3.75, 3.8 , 3.85, 3.9 ,3.95, 4. , 4.05, 4.1 , 4.15, 4.2 , 4.25, 4.3 , 4.35,4.4 , 4.45, 4.5 , 4.55, 4.6 , 4.65, 4.7 , 4.75, 4.8 ,4.85, 4.9 , 4.95, 5. , 5.05, 5.1 , 5.15, 5.2 , 5.25,5.3 , 5.35, 5.4 , 5.45, 5.5 , 5.55, 5.6 , 5.65, 5.7 ,5.75, 5.8 , 5.85, 5.9 , 5.95, 6. ])
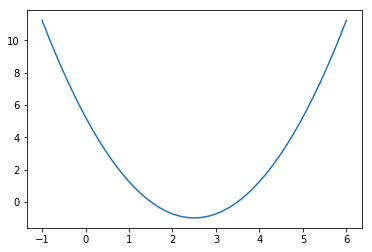
2.可视化
plot_y = (plot_x-2.5)**2 - 1.plt.plot(plot_x, plot_y)plt.show()
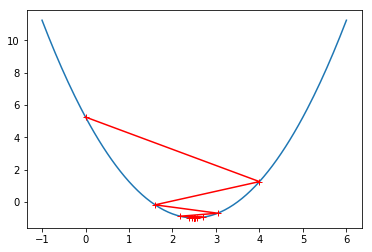
3.迭代过程
epsilon = 1e-8eta = 0.1def J(theta):return (theta-2.5)**2 - 1.def dJ(theta):return 2*(theta-2.5)theta = 0.0while True:gradient = dJ(theta)last_theta = thetatheta = theta - eta * gradientif(abs(J(theta) - J(last_theta)) < epsilon):breakprint(theta) # 2.499891109642585print(J(theta)) # -0.99999998814289
theta = 0.0theta_history = [theta]while True:gradient = dJ(theta)last_theta = thetatheta = theta - eta * gradienttheta_history.append(theta)if(abs(J(theta) - J(last_theta)) < epsilon):breakplt.plot(plot_x, J(plot_x))plt.plot(np.array(theta_history), J(np.array(theta_history)), color="r", marker='+')plt.show()
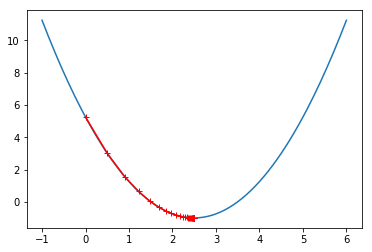
len(theta_history) # 46
4.封装代码
theta_history = []def gradient_descent(initial_theta, eta, epsilon=1e-8):theta = initial_thetatheta_history.append(initial_theta)while True:gradient = dJ(theta)last_theta = thetatheta = theta - eta * gradienttheta_history.append(theta)if(abs(J(theta) - J(last_theta)) < epsilon):breakdef plot_theta_history():plt.plot(plot_x, J(plot_x))plt.plot(np.array(theta_history), J(np.array(theta_history)), color="r", marker='+')plt.show()
eta = 0.01theta_history = []gradient_descent(0, eta)plot_theta_history()
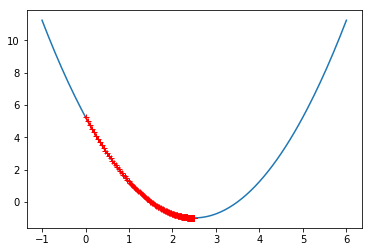
len(theta_history) # 424
eta = 0.001theta_history = []gradient_descent(0, eta)plot_theta_history()
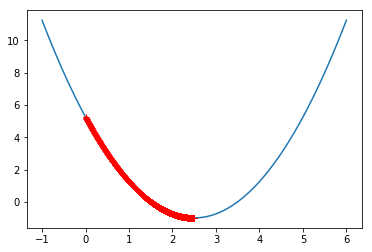
len(theta_history) # 3682
5.步伐略大
eta = 0.8theta_history = []gradient_descent(0, eta)plot_theta_history()
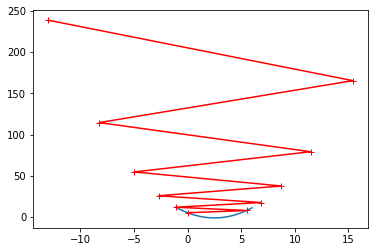
6.步伐太大
eta = 1.1theta_history = []gradient_descent(0, eta) # OverflowError: (34, 'Result too large')
def J(theta):try:return (theta-2.5)**2 - 1.except:return float('inf')def gradient_descent(initial_theta, eta, n_iters = 1e4, epsilon=1e-8):theta = initial_thetai_iter = 0theta_history.append(initial_theta)while i_iter < n_iters:gradient = dJ(theta)last_theta = thetatheta = theta - eta * gradienttheta_history.append(theta)if(abs(J(theta) - J(last_theta)) < epsilon):breaki_iter += 1return
eta = 1.1theta_history = []gradient_descent(0, eta)len(theta_history) # 10001
eta = 1.1theta_history = []gradient_descent(0, eta, n_iters=10)plot_theta_history()

若有收获,就点个赞吧
0 人点赞
