1)外部数据导入R
对于R 数据处理者来说,从外部获取数据是处理数据的第一步。
而繁杂的数据储存类型:text, Stata, SPSS, SAS, Excel等等,也决定了我们需要使用不同的函数对它们进行处理。
| Data type | Extension | Function | Package |
|---|---|---|---|
- csv
| Comma separated values | csv | read.csv() |
utils (default) |
|---|---|---|---|
read_csv() |
readr (tidyverse) |
- tsv
| Tab separated values | tsv | read_tsv() |
readr |
|---|---|---|---|
- txt
| Other delimited formats | txt | read.table() |
utils |
|---|---|---|---|
read_table() |
readr | ||
read_delim() |
readr |
- dta
| Stata version 13-14 | dta | readdta() |
haven |
|---|---|---|---|
| Stata version 7-12 | dta | read.dta() |
foreign |
- sav
| SPSS | sav | read.spss() |
foreign |
|---|---|---|---|
- sas7bdat
| SAS | sas7bdat | read.sas7bdat() |
sas7bdat |
|---|---|---|---|
2)浏览数据的函数
- 所有数据类型
str(): compact display of data contents (env.)class(): data type (e.g. character, numeric, etc.) of vectors and data structure of dataframes, matrices, and lists.summary(): detailed display, including descriptive statistics, frequencieshead(): will print the beginning entries for the variabletail(): will print the end entries for the variable
- 向量和因子
length(): returns the number of elements in the vector or factor
ps:如果是对数据框操作length的话,会返回列数目。
- 数据框和矩阵
dim(): returns dimensions of the datasetnrow(): returns the number of rows in the datasetncol(): returns the number of columns in the datasetrownames(): returns the row names in the datasetcolnames(): returns the column names in the dataset
练习
- Create a vector called alphabets with the following letters, C, D, X, L, F.
> alphabets[1] "C" "D" "X" "L" "F"
- Use the associated indices along with
[ ]to do the following:- only display C, D and F
> alphabets[c(1,2,5)][1] "C" "D" "F"> alphabets[c(-3,-4)][1] "C" "D" "F"
- display all except X
> alphabets[c(-3)]
[1] "C" "D" "L" "F"
- display the letters in the opposite order (F, L, X, D, C)
> alphabets[5:1]
[1] "F" "L" "X" "D" "C"
3)处理数据
通常来说,我们可以通过逻辑操作符,利用逻辑操作符返回的逻辑值,来对数据框的行进行筛选,即那些返回结果是TRUE 的内容。
> a
 [1]  7  5 10  2  4  3  1  9  6  8
> a > 1 & a < 4
 [1] FALSE FALSE FALSE  TRUE FALSE  TRUE FALSE FALSE FALSE FALSE
> a[a > 1 & a < 4]
我们也可以利用which 函数对返回的值构建索引:
> a < 2 | a > 4
 [1]  TRUE  TRUE  TRUE FALSE FALSE FALSE  TRUE  TRUE  TRUE  TRUE
> which(a < 2 | a > 4)
[1]  1  2  3  7  8  9 10
另外,数据框也可以进行类似的操作:
> c[c$b == 'a',]
   a b
1  7 a
2  5 a
3 10 a
4  2 a
5  4 a
列表的取子集可以看作是数据框的“增强版”,首先取列表中的某个元素(可以是向量、数据框。。),再对该元素进行操作:
> d[[3]][d[[3]][['a']]<7 & d[[3]][['a']] > 2,]
  a b
2 5 a
5 4 a
6 3 b
9 6 b
如果对列表命名了,也可以使用 $ 对其取子集,也就是相当于[[n]]。
4)匹配
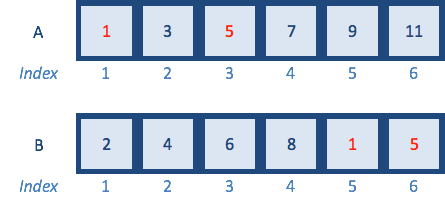
- %in%
A <- c(1,3,5,7,9,11)   # odd numbers
B <- c(2,4,6,8,10,12)  # even numbers
会逐一判断A 中的元素是否存在于B 中,如果某个元素存在,则返回TRUE:
> A %in% B
[1] FALSE FALSE FALSE FALSE FALSE FALSE
> C <- c(2,4,1,3,12)
> C %in% B
[1]  TRUE  TRUE FALSE FALSE  TRUE
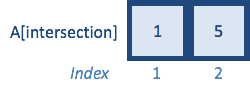
这个方法可以用来取交集:
> A <- c(1,3,5,7,9,11)   # odd numbers
> B <- c(2,4,6,8,1,5)  # add some odd numbers in
> A[A %in% B]
[1] 1 5
结合any 和all 函数,也可以判断二者是存在交集亦或是完全相等,如果逻辑值中存在任意TRUE,则any 返回TRUE;如果逻辑值中均是TRUE,则all 返回TRUE。
> any(A %in% B)
[1] TRUE
> all(A %in% B)
[1] FALSE
如果我们想要检查二者的位置是否相同(相同的index),可以直接用逻辑值判断:
> A == B
[1] FALSE FALSE FALSE FALSE FALSE FALSE
- match
通过match 我们可以将某个向量按照另一个向量的顺序进行重新排列。
match 的原理是,其接受两个向量,match(a,b),函数将会对a向量与b向量进行遍历,看a 中的元素是否存在于b中,如果存在,则返回a中的该元素在b中的索引;如果不存在,则返回NULL:
> match(c,d)
 [1] NA NA  5 NA  4  1 NA  3 NA NA NA  2
> c
 [1]  9 10  1  8  4  5  6  2 12 11  7  3
> d
[1] 5 3 2 4 1
利用该特性,我们可以将某个向量的顺序(如数据框中的某列按照指定列进行重排序):
> c
 [1]  9 10  1  8  4  5  6  2 12 11  7  3
> b
 [1]  9  3 11 10  6 12  5  1  8  4  7  2
> match(b,c)
 [1]  1 12 10  2  7  9  6  3  4  5 11  8
> c[match(b,c)]
 [1]  9  3 11 10  6 12  5  1  8  4  7  2
上面的c match排序,得到了和b 一样的向量:
> all(b == c[match(b,c)])
[1] TRUE
5)重排序
我们可以利用索引,直接对其内容进行相关的排序:
> b
 [1]  9  3 11 10  6 12  5  1  8  4  7  2
> b[c(4,3,2,1)]
[1] 10 11  3  9
值得注意的是,不同于python 等语言,R 的索引是从1 开始计算的,且其切片操作是包头也包尾的。

若有收获,就点个赞吧
0 人点赞
