两个样本差异比较的方法。
比如两个向量集:
> head(boy)[1] 177.97 171.89 170.29 158.69 177.36 182.50> head(girl)[1] 151.11 158.74 155.47 158.62 176.03 153.65
直接t 检验好了:
> t.test(boy, girl)Welch Two Sample t-testdata: boy and girlt = 6.3941, df = 97.71, p-value = 5.552e-09alternative hypothesis: true difference in means is not equal to 095 percent confidence interval:7.506641 14.263359sample estimates:mean of x mean of y170.0252 159.1402
如果想要检测单边的,比如 x 是否显著大于 y,加个参数 alternative(greater 与 less) :
> t.test(boy, girl, alternative = 'greater')Welch Two Sample t-testdata: boy and girlt = 6.3941, df = 97.71, p-value = 2.776e-09alternative hypothesis: true difference in means is greater than 095 percent confidence interval:8.058101 Infsample estimates:mean of x mean of y170.0252 159.1402
如果想要做一般的t 检验(student-t-test):
> t.test(boy, girl, alternative = 'greater', var.equal= T)Two Sample t-testdata: boy and girlt = 6.3941, df = 98, p-value = 2.753e-09alternative hypothesis: true difference in means is greater than 095 percent confidence interval:8.058181 Infsample estimates:mean of x mean of y170.0252 159.1402
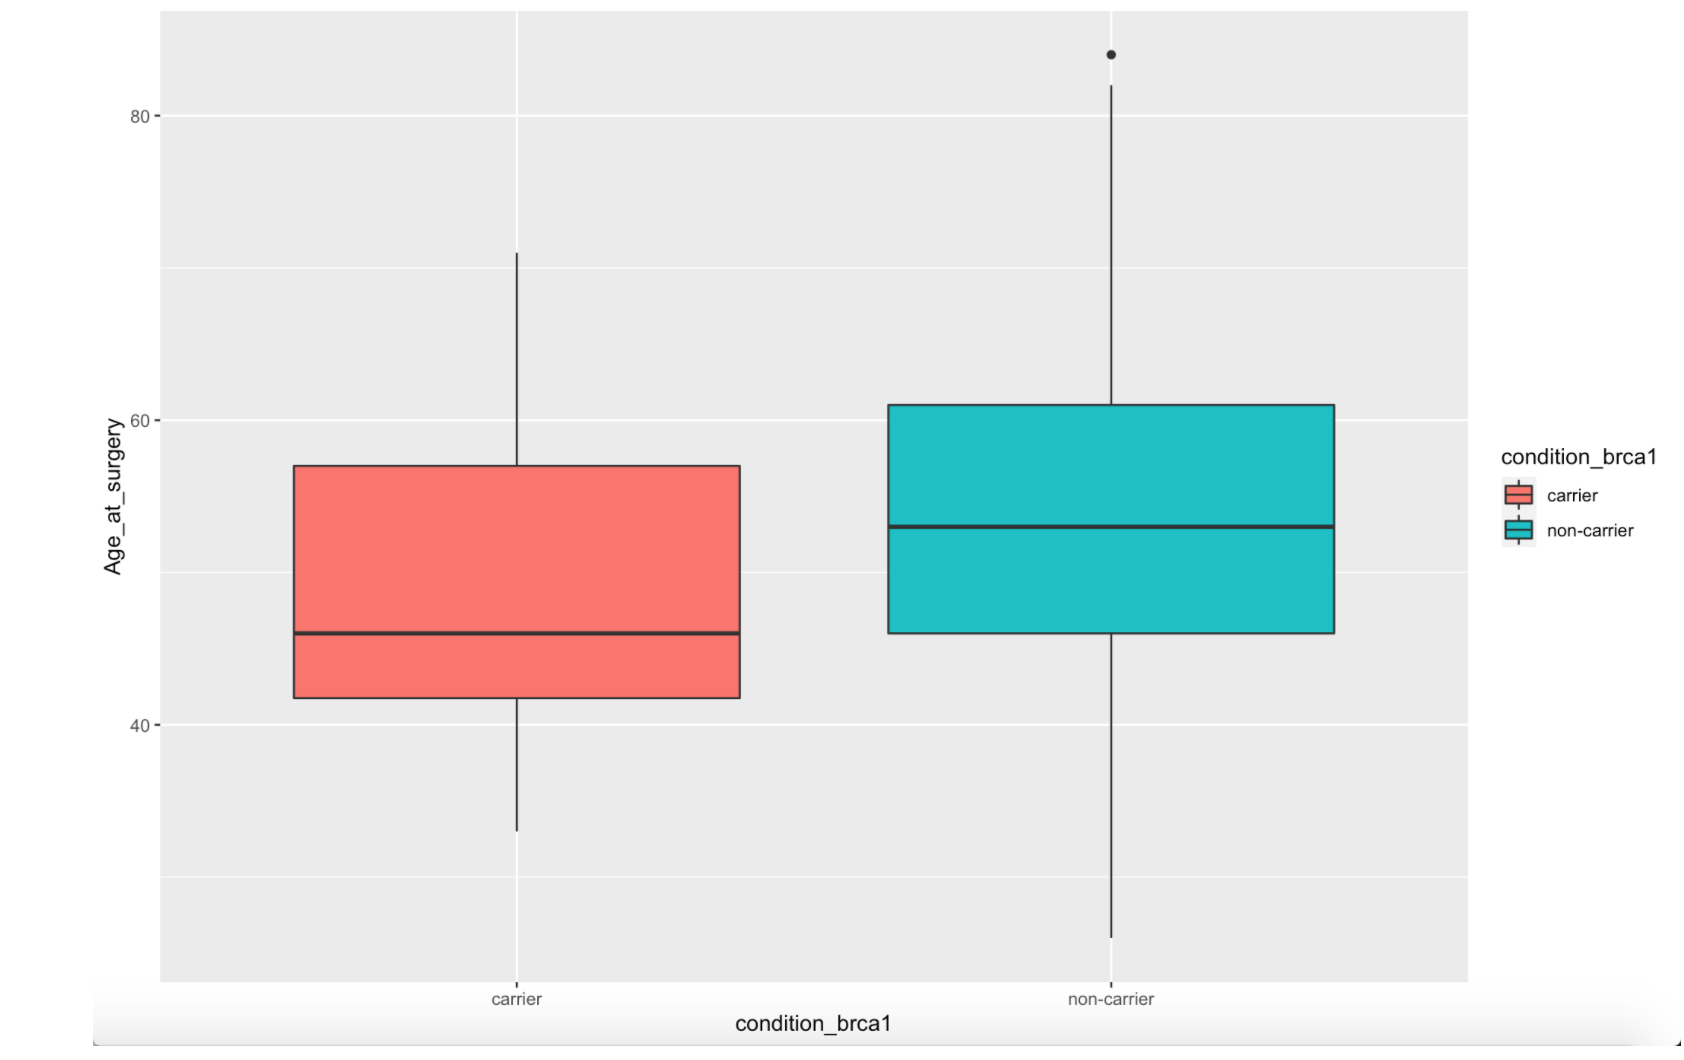
比较两个组之间的差异,箱线图是最好的可视化方法之一了:
ggplot(data = clinical_info_final) +geom_boxplot(mapping = aes(x = condition_brca1, y = Age_at_surgery, fill = condition_brca1))ggplot(data = clinical_info_final) +geom_boxplot(mapping = aes(x = condition_brca2, y = Age_at_surgery, fill = condition_brca2))condition_brca2

若有收获,就点个赞吧
0 人点赞
