卡方检验的方法
卡方检验是统计两个独立变量之间是否存在相关性的统计方法,比如吸烟和肺癌的关系(率的检验):
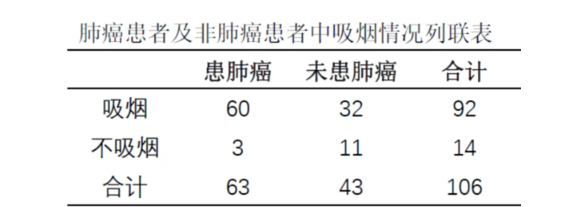
卡方检验需要矩阵,首先需要构建:
> matrix(c(60,3,32,11), ncol = 2)[,1] [,2][1,] 60 32[2,] 3 11> mat = matrix(c(60,3,32,11), ncol = 2)
顺便起个名字呗:
> rownames(mat) = c('smoke', 'not-smoke')> colnames(mat) = c('cancer', 'uncancer')> matcancer uncancersmoke 60 32not-smoke 3 11
直接卡方检验走起~
> chisq.test(mat)Pearson's Chi-squared test with Yates' continuity correctiondata: matX-squared = 7.9327, df = 1, p-value = 0.004855
检验阈值如果设置0.05,显然二者相关性很强。
做个练习?
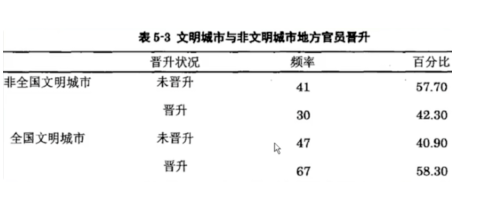
列联表的卡方检验
其实也就是对分组的事件进行多个描述,判断在不同条件下,检验某因素对某结果是否存在偏好性。多增加几个
比如突变类型与癌症类型偏好的独立性。(重复了两个一样的突变单纯是为了表明其可以有两个及两个以上的分组)
> rbind(ctab_brca1,ctab_brca1)BLIS IM LAR MESn-BRCA1 11 4 1 0NO-n-BRCA1 95 49 55 32n-BRCA1 11 4 1 0NO-n-BRCA1 95 49 55 32> tmp = rbind(ctab_brca1,ctab_brca1)> chisq.test(tmp)Pearson's Chi-squared testdata: tmpX-squared = 14.025, df = 9, p-value = 0.1215
在0.05水平下认为癌症类型与突变类别无关。
另外,addmargins 函数非常好用,可以计算行与列的加和,而prop.table 则可以计算该位置数目所占总数的比重:
tab2 <- round(prop.table(addmargins(ctab_brca1, 1), 1), 3)> tab2BLIS IM LAR MESn-BRCA1 0.688 0.250 0.062 0.000NO-n-BRCA1 0.411 0.212 0.238 0.139Sum 0.429 0.215 0.227 0.130

若有收获,就点个赞吧
0 人点赞
