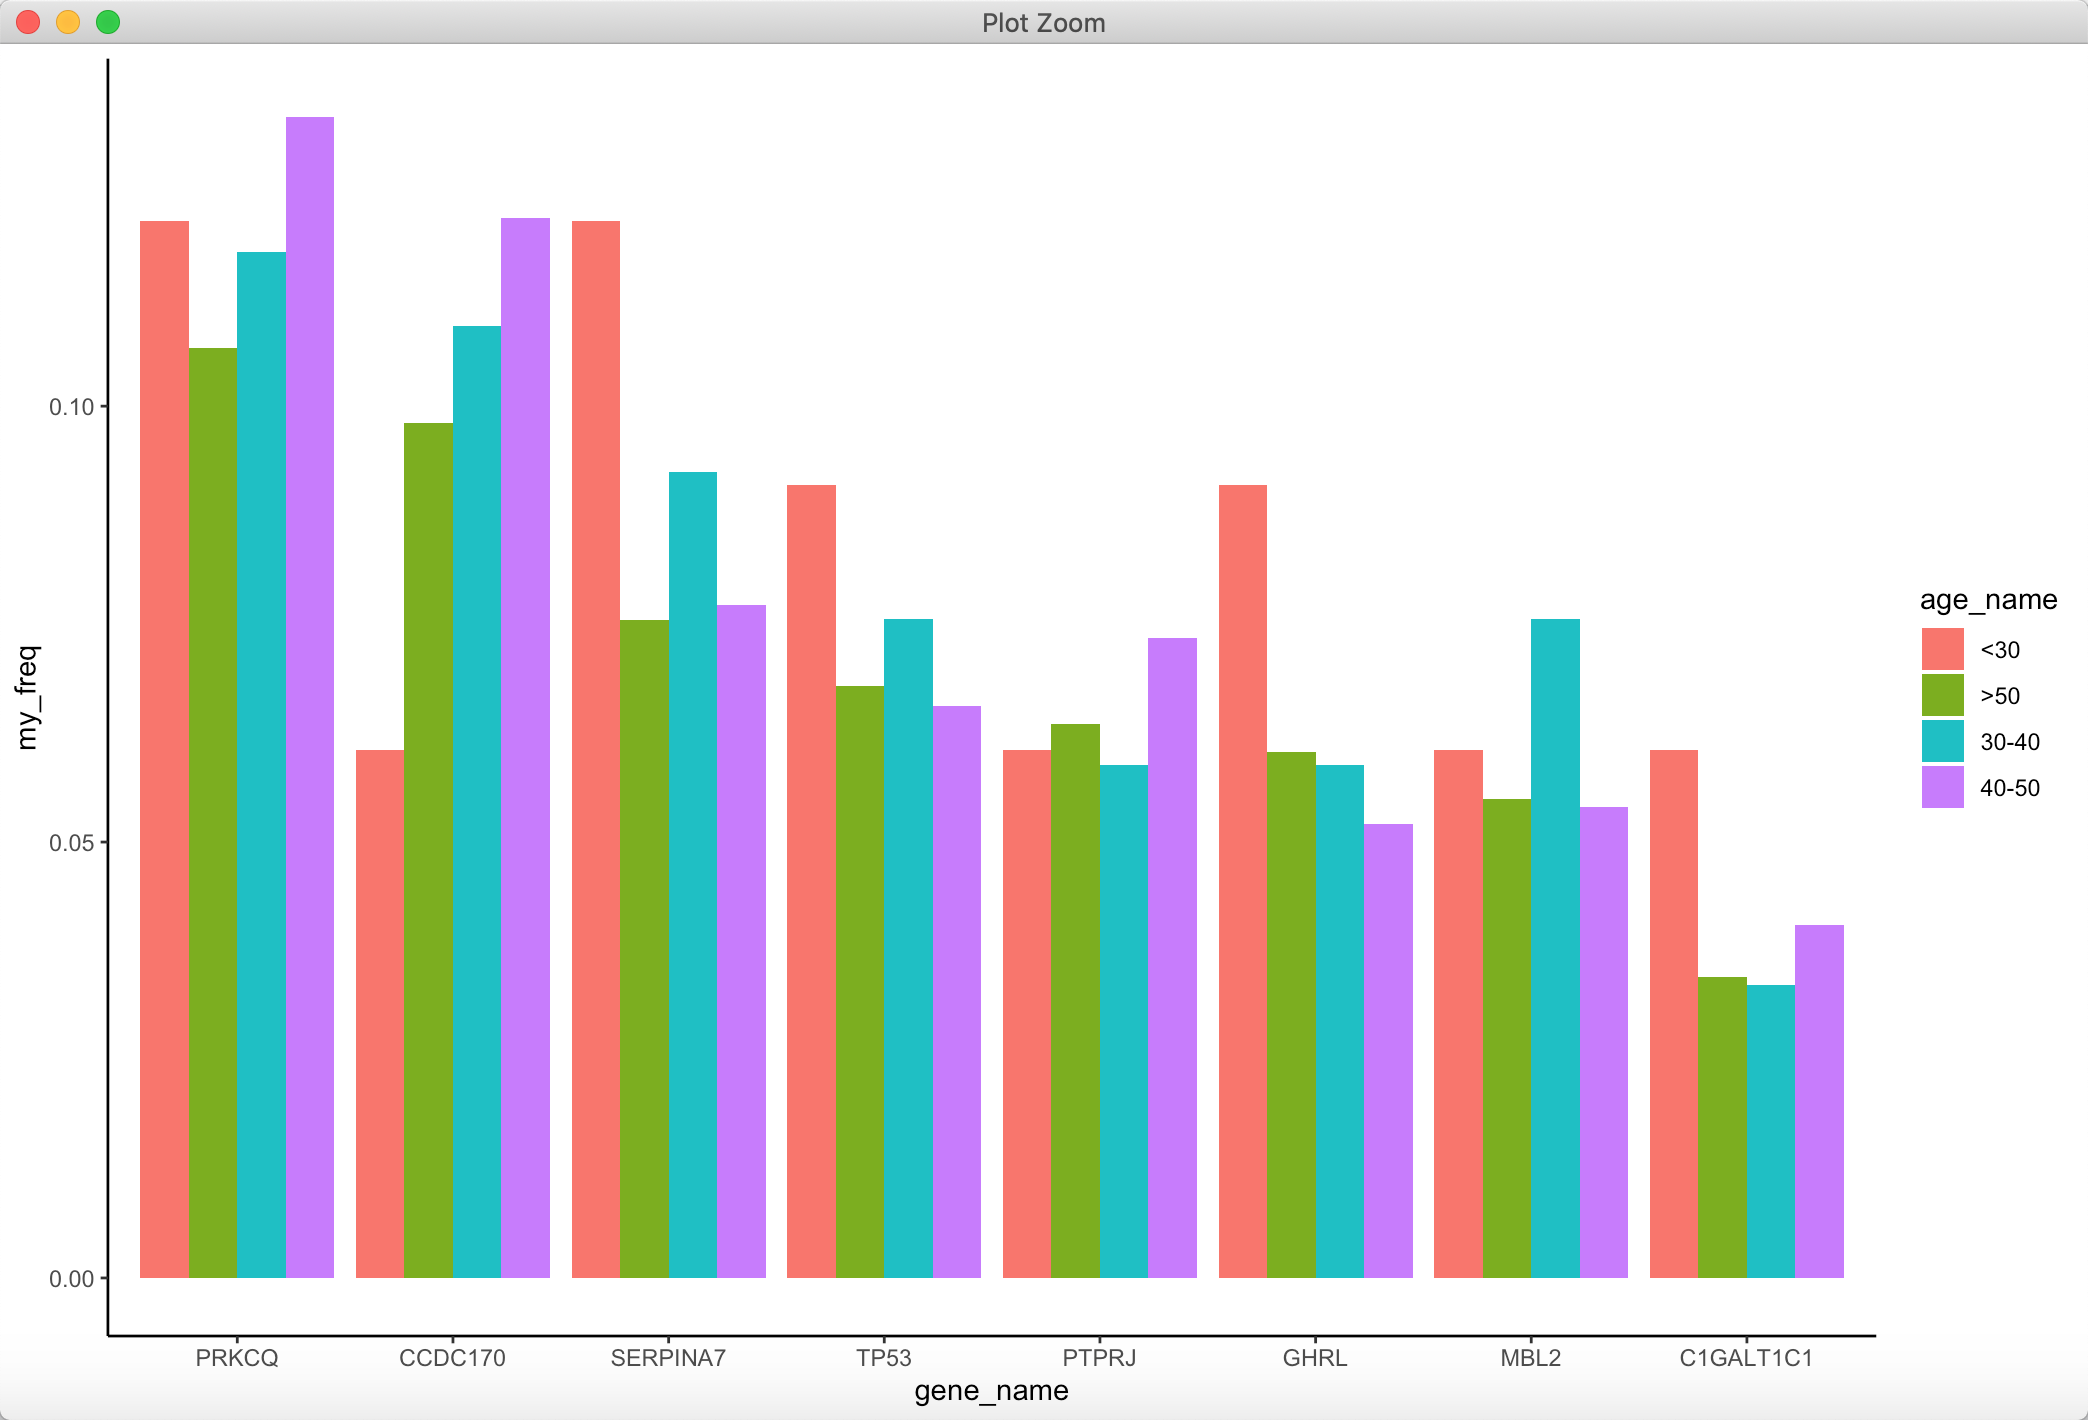
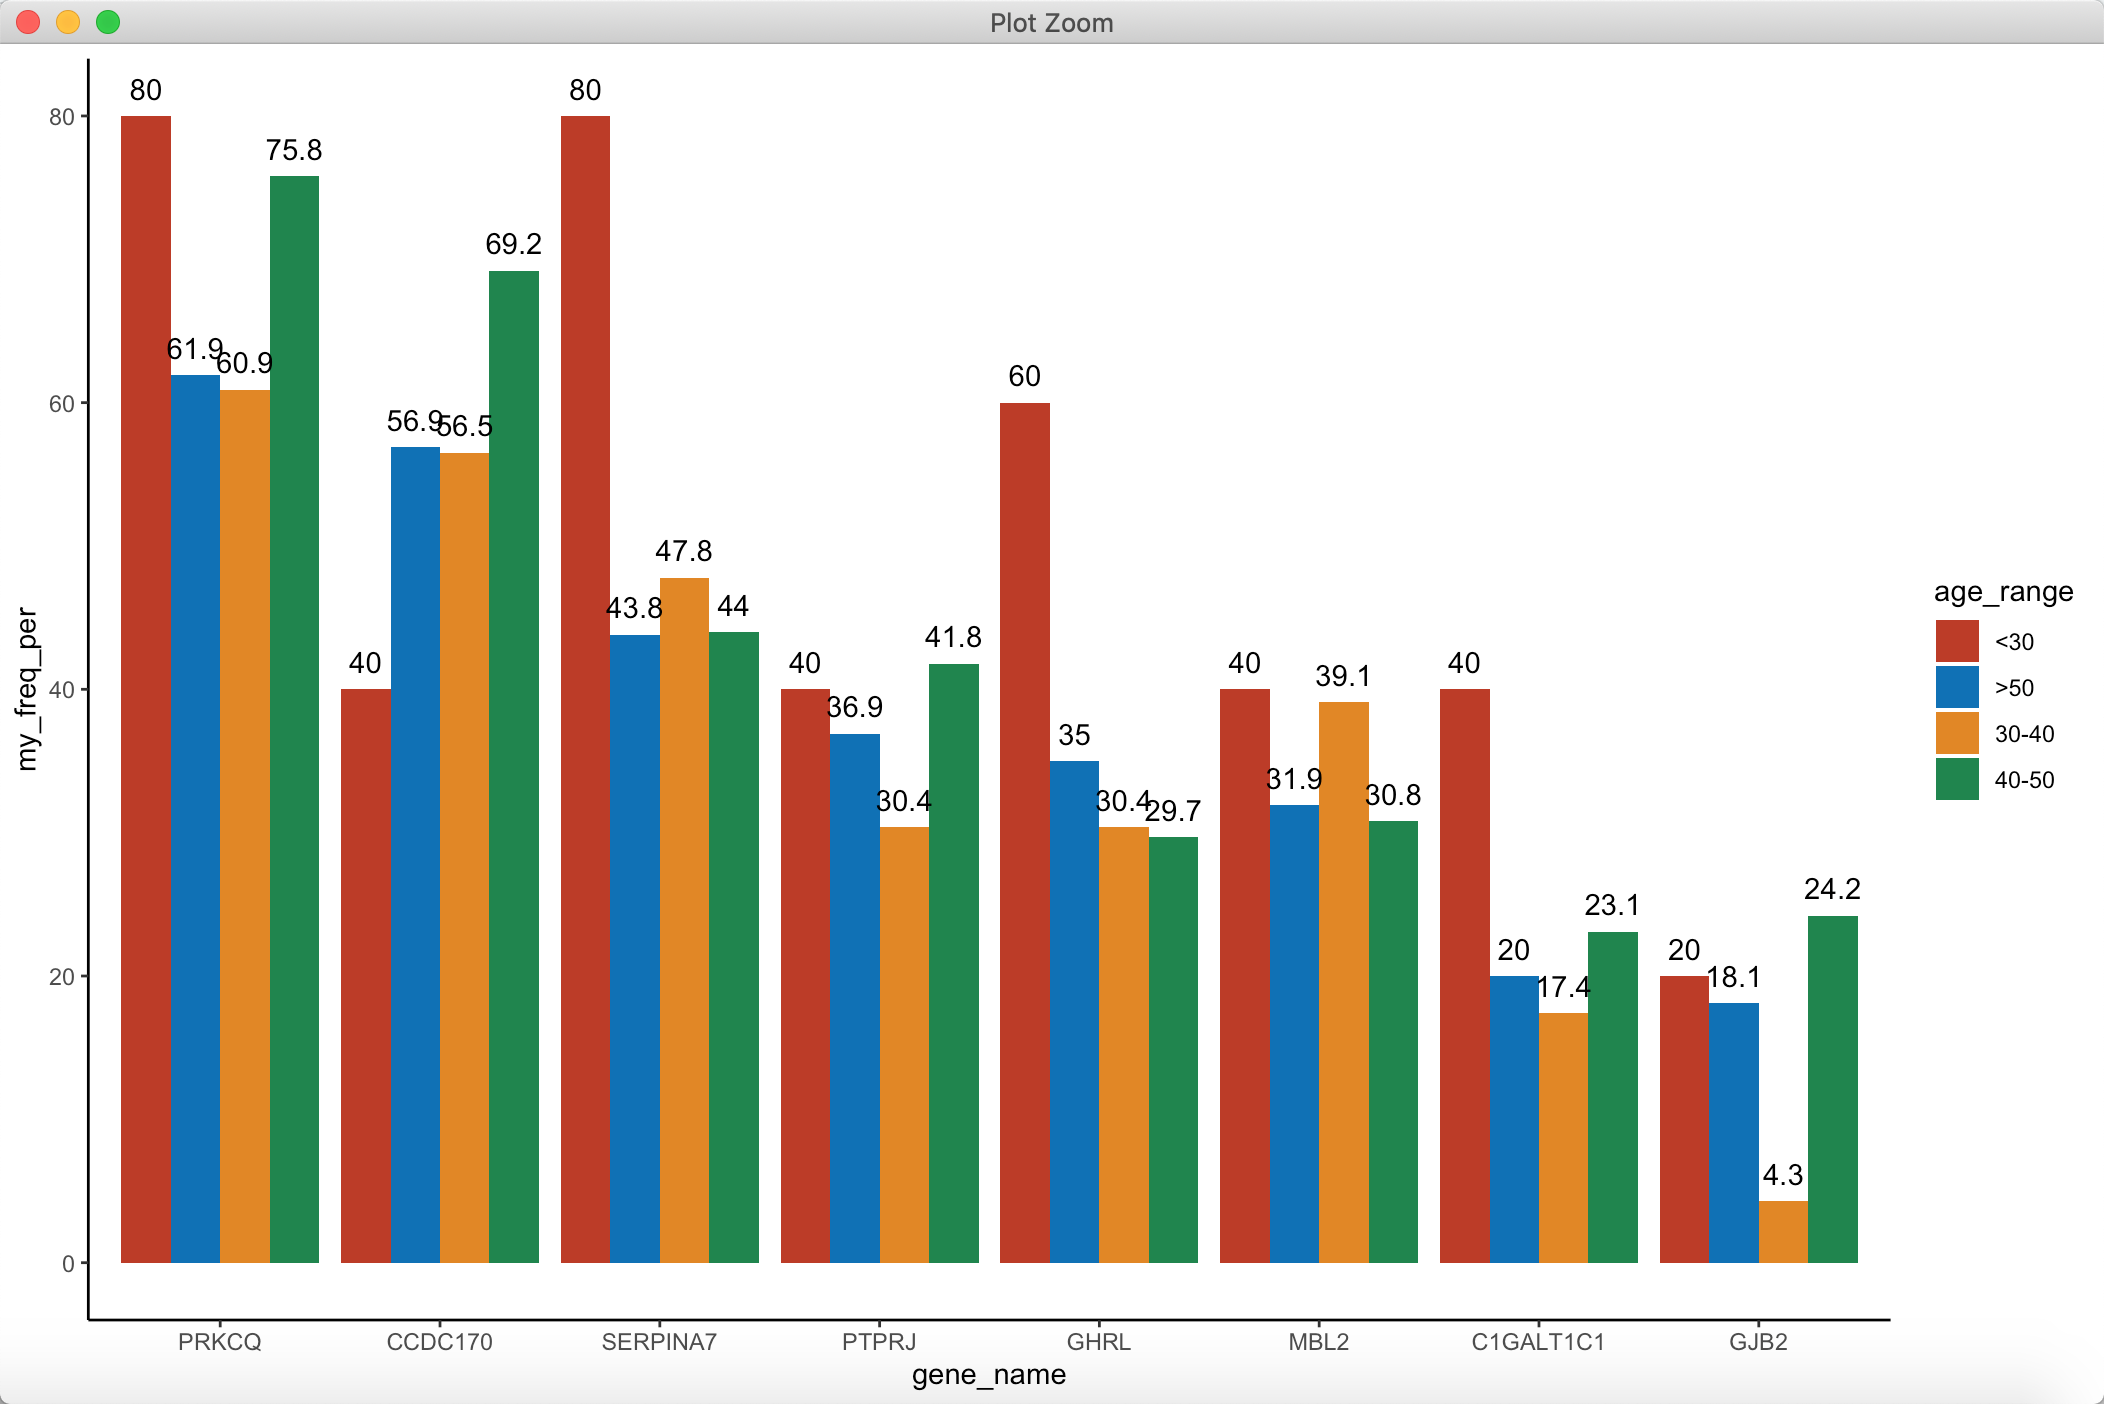
需求还是希望给这张图中的柱子加个标记:
利用geom_text 图形参数:
p <- ggplot(data = freq_df_all, mapping = aes(x = gene_name, y = my_freq_per, fill = age_range)) +geom_bar(stat = "identity",position = "dodge") + theme_classic()p + scale_fill_nejm() + geom_text(aes(label = my_freq_per), position = position_dodge(0.9), vjust = -0.8)
label 表示文字的来源,选择和柱状图y 轴展示所用相同的值,position 和柱状图中相同的dodge模式,通过vjust 调整文字上移0.8 个单位:

若有收获,就点个赞吧
0 人点赞
