参见:https://blog.csdn.net/u011219650/article/details/41377849
https://www.math.pku.edu.cn/teachers/lidf/docs/Rbook/html/_Rbook/graph.html
不同于ggplot 的先将绘图内容做好,再将这些图形分配给不同的位置。基础包则是先分配好绘图区域,再依次把图像画上去。
比如:
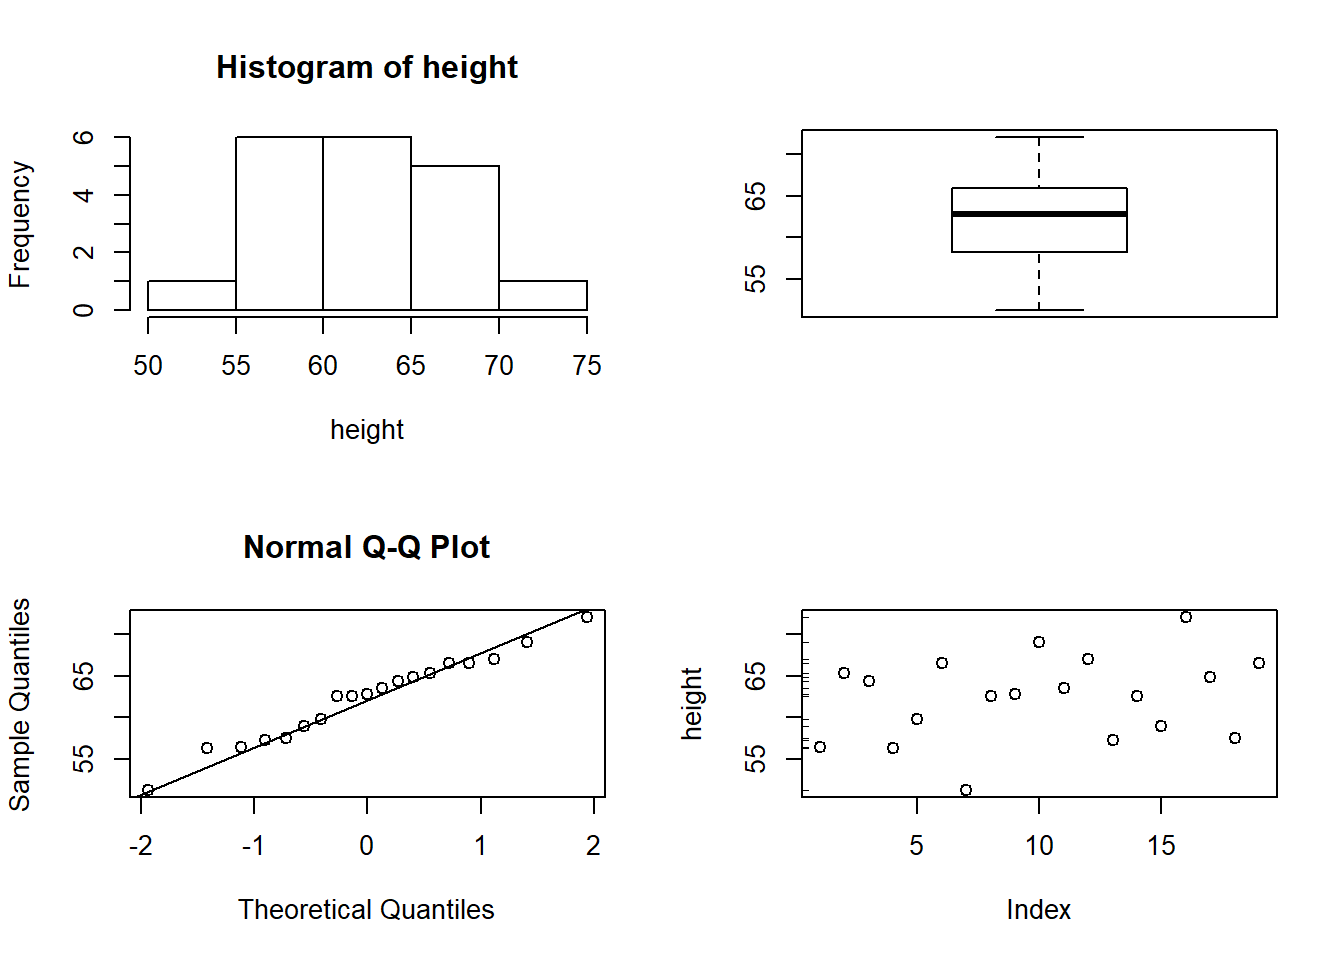
height <- rnorm(30, mean = 170, sd = 4)height_df <- data.frame(height = height)opar <- par(no.readonly = TRUE)par(mfrow=c(2,2))with(d.class, {hist(height);boxplot(height);qqnorm(height); qqline(height);plot(height); rug(height,side=2)})par(opar)
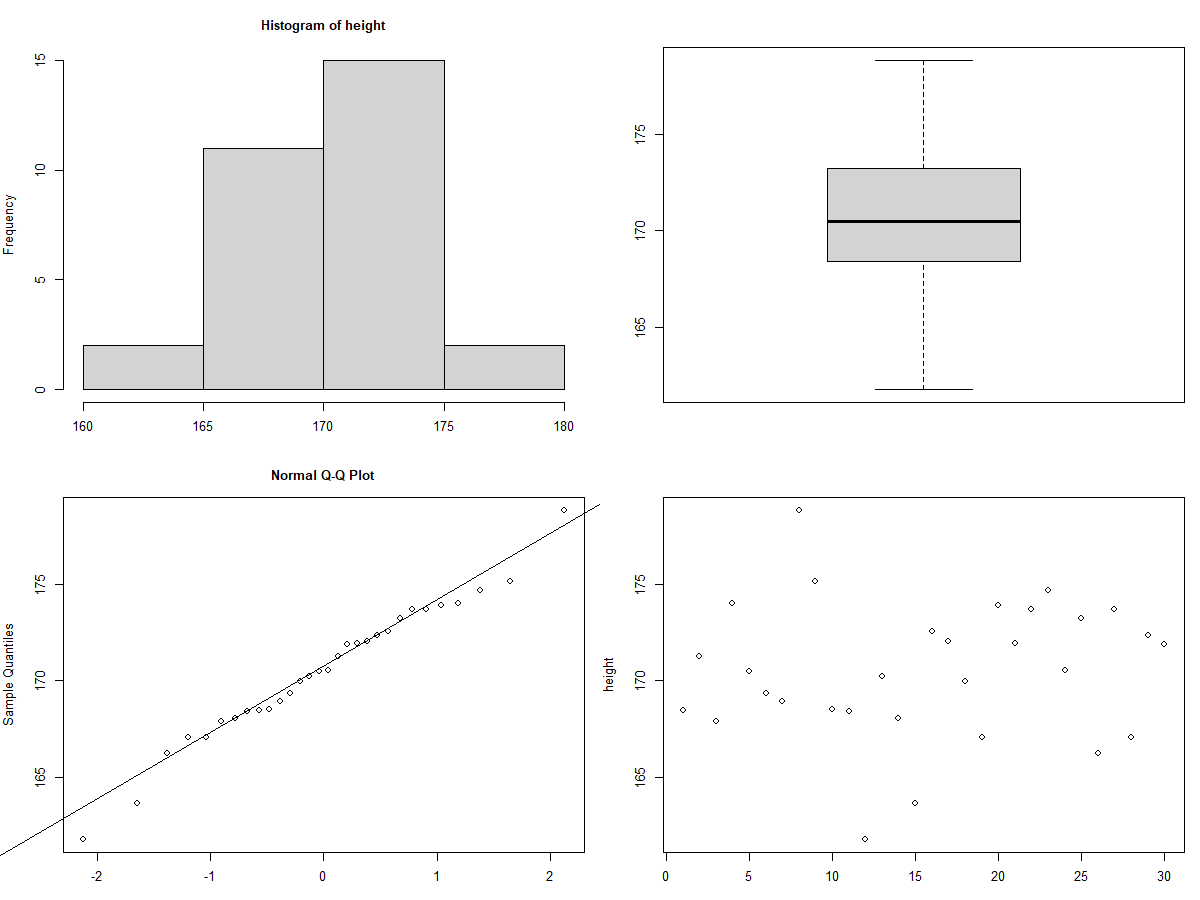
其中mfow 表示控制输出图像为2 行 2 列。
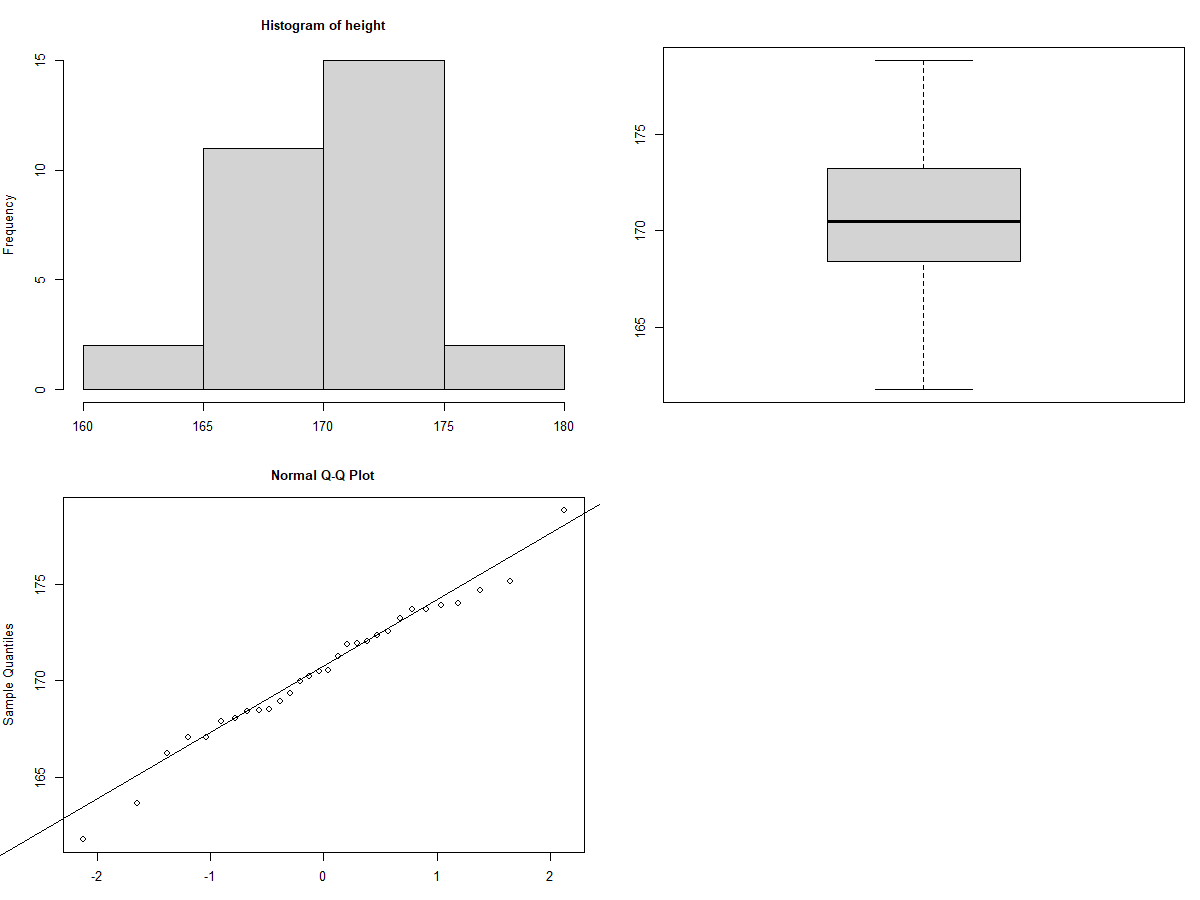
如果我们只给三个图片,剩下的自然是白白的大白板啦:
opar <- par(no.readonly = TRUE)
par(mfrow=c(2,2))
with(height_df, {hist(height);
  boxplot(height);
  qqnorm(height); qqline(height);
})
par(opar)

若有收获,就点个赞吧
0 人点赞
