最近要复现一个图:
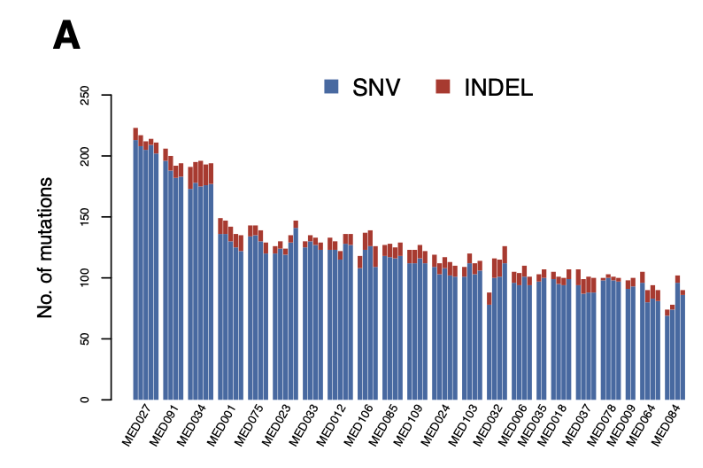
对于练习时常三周半的我来说,这还不简单?
但当我摇摆在fill 指定多个属性以及position 是dodge 还是stack 间时,现实给了我狠狠的一记耳光。正如有个说的:
ggplot2 is powerful but opinionated software- sometimes it is the ggplot way or no way at all. – Sharpie Jul 18 '10 at 19:32
这可真是离谱妈妈给离谱开门,离谱到家了。
于是我退而求其次,按照https://stackoverflow.com/questions/12715635/ggplot2-bar-plot-with-both-stack-and-dodge 建议,选择了facet。
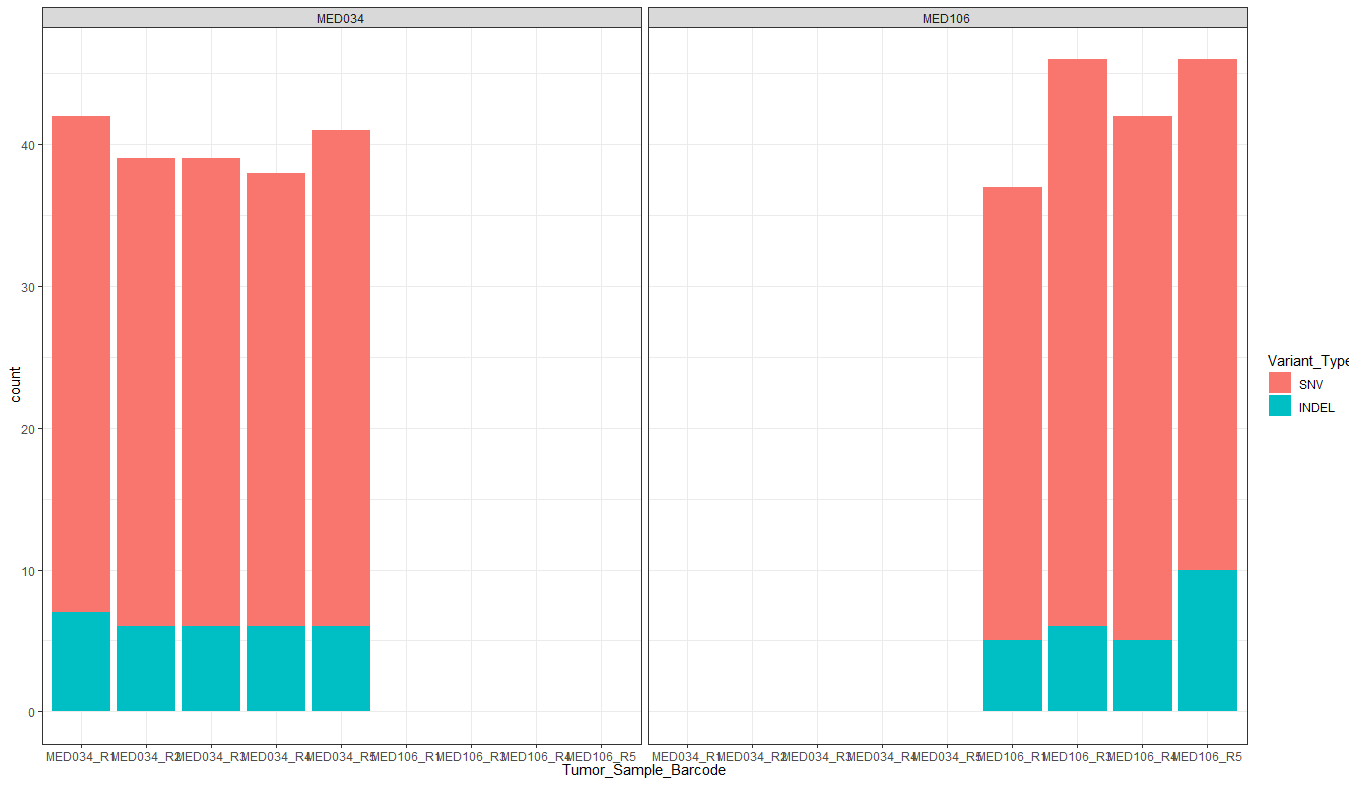
有个参数可以解决这个问题scales = “free”:
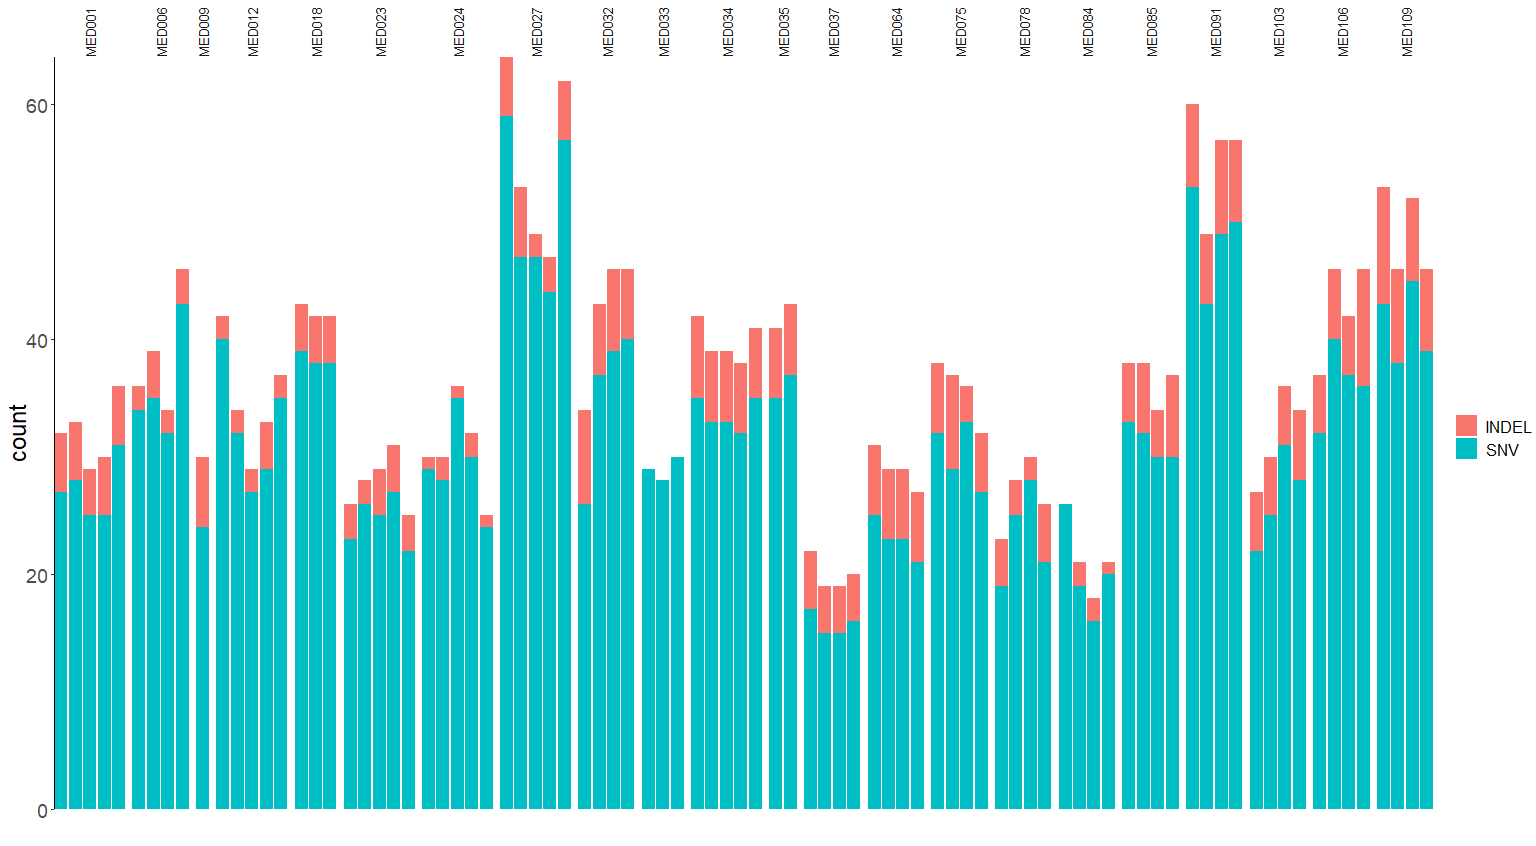
(p1 <- ggplot(snv_df) + theme_classic() +geom_bar(aes(Tumor_Sample_Barcode, fill = Variant_Type)) +theme(panel.grid = element_blank(),axis.text.x = element_blank(),axis.ticks.x = element_blank(),axis.line.x = element_blank()) +labs(x = "") + scale_y_continuous(expand=c(0,0)) +scale_x_discrete(expand = expansion(mult = c(0.03,0)))) +facet_grid(.~Patient_Barcode,scales = "free")
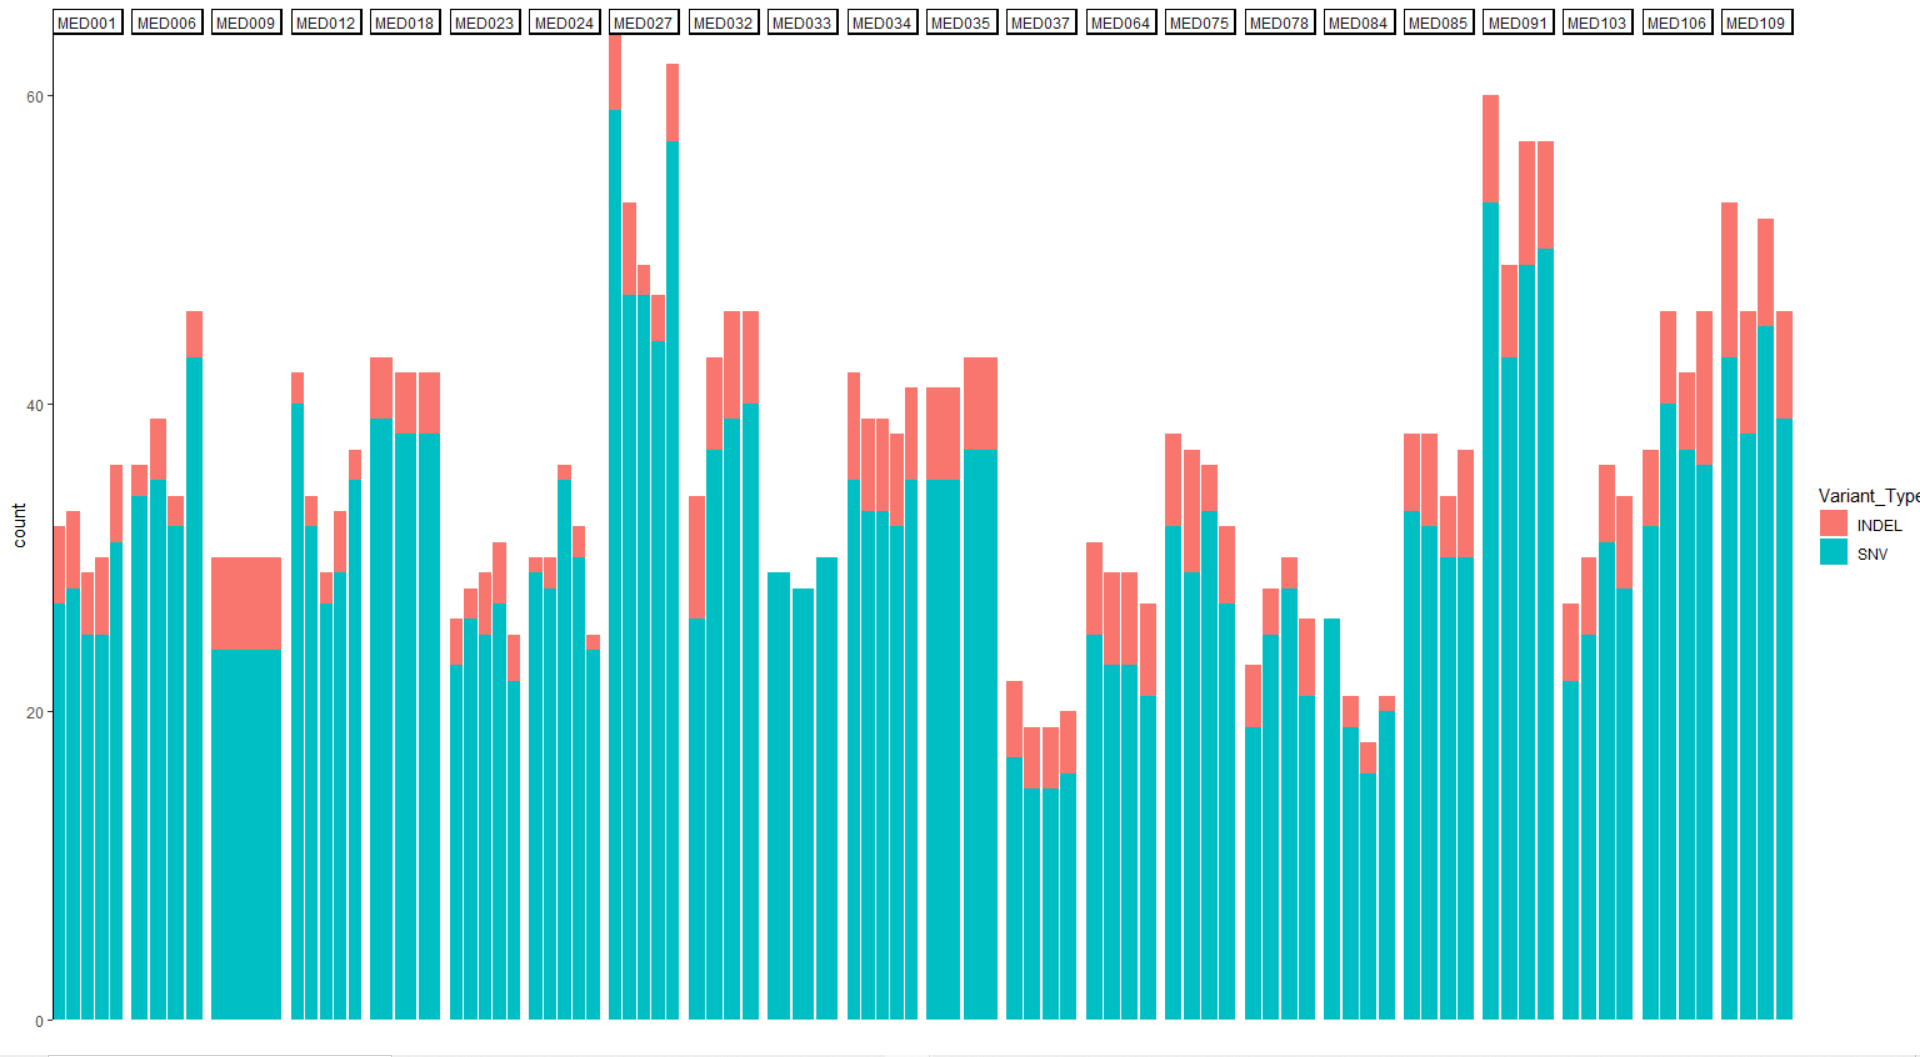
free 让每个数据都有自己的数据表现,而space 则可以让每个数据有自己独立的坐标系:
(p1 <- ggplot(snv_df) + theme_classic() +geom_bar(aes(Tumor_Sample_Barcode, fill = Variant_Type)) +theme(panel.grid = element_blank(),axis.text.x = element_blank(),axis.ticks.x = element_blank(),axis.line.x = element_blank()) +labs(x = "") + scale_y_continuous(expand=c(0,0)) +scale_x_discrete(expand = expansion(mult = c(0.03,0)))) +facet_grid(.~Patient_Barcode, scales = "free", space = "free")
然而这样又有新的问题了,分面的注释无法显示完全名称。
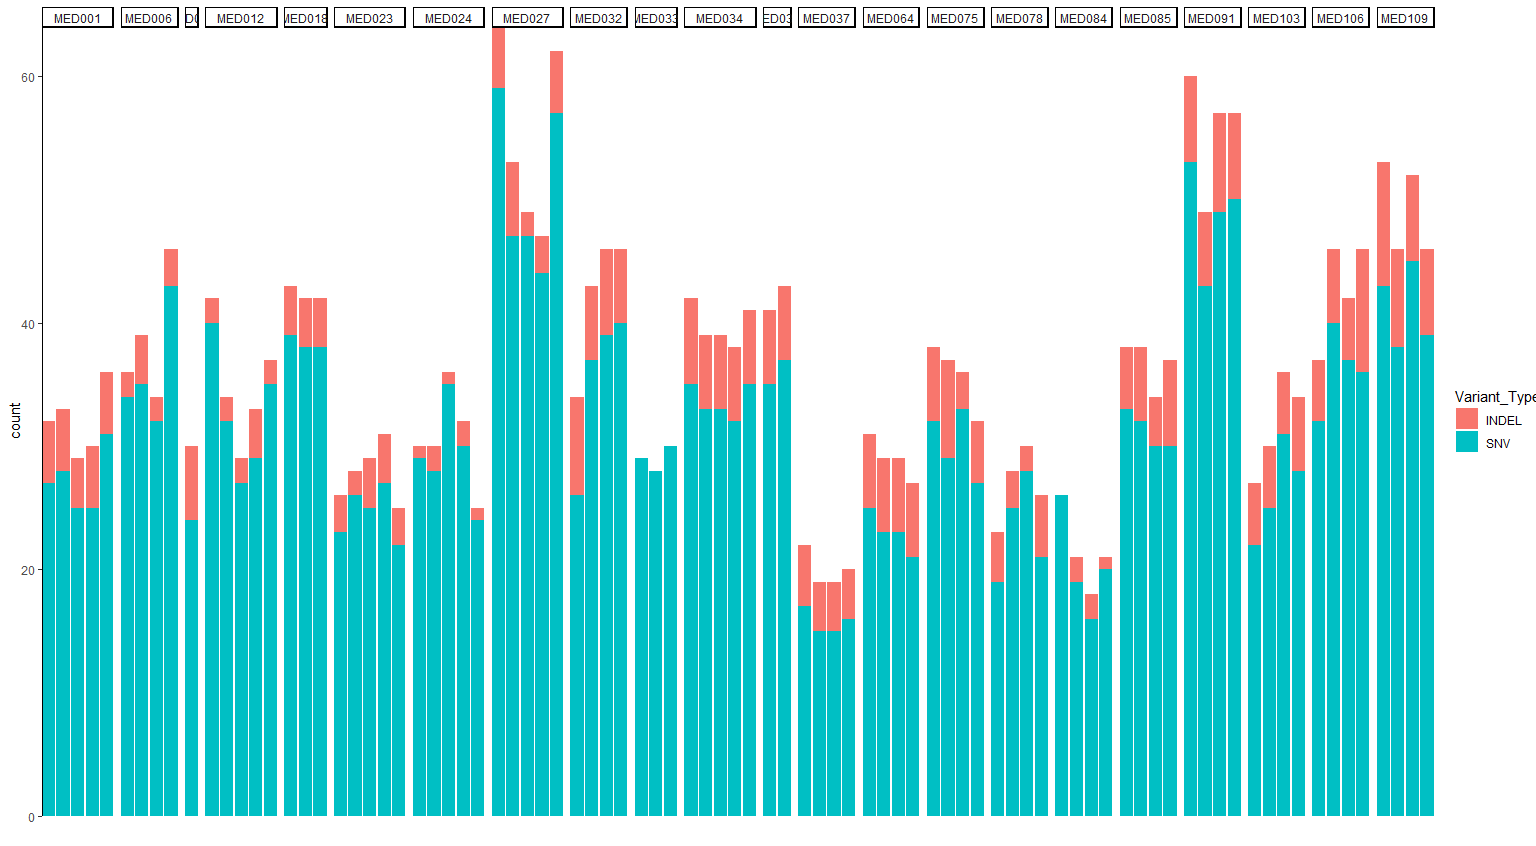
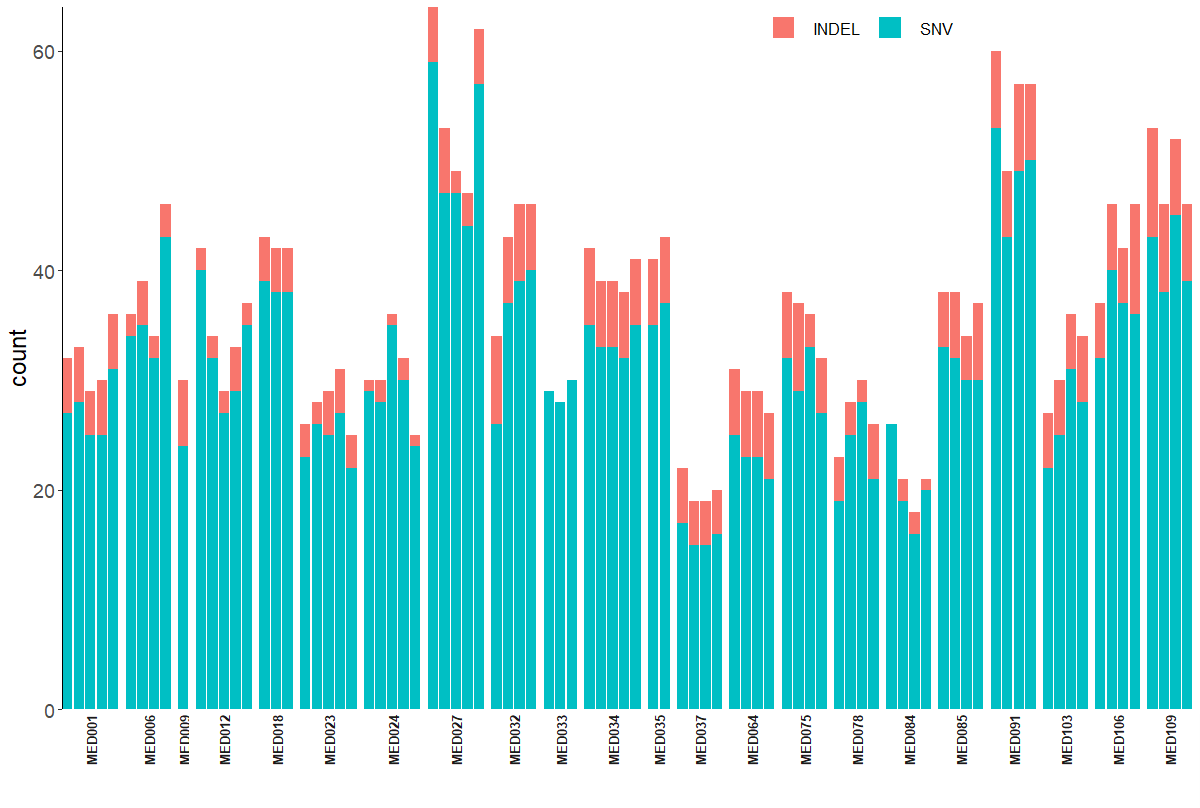
这时候我们可以通过strip 修改一下分面注释对象,让其无背景,并且垂直显示:
(p1 <- ggplot(snv_df) + theme_classic() +geom_bar(aes(Tumor_Sample_Barcode, fill = Variant_Type)) +theme(panel.grid = element_blank(),axis.text.x = element_blank(),axis.ticks.x = element_blank(),axis.line.x = element_blank(),axis.title = element_text(size = 18),axis.text = element_text(size = 14),legend.title = element_blank(),legend.text = element_text(size = 12)) +theme(strip.background = element_blank(),strip.text.x = element_text(angle = 90, size = 12)) +labs(x = "") + scale_y_continuous(expand=c(0,0)) +scale_x_discrete(expand = expansion(mult = c(0.03,0)))) +facet_grid(.~Patient_Barcode, scales = "free", space = "free")
接下来就是让facet 的内容从默认的top 变到底部,“假装”它是通过aes 分组出来的内容:
(p1 <- ggplot(snv_df) + theme_classic() +geom_bar(aes(Tumor_Sample_Barcode, fill = Variant_Type)) +theme(panel.grid = element_blank(),axis.text.x = element_blank(),axis.ticks.x = element_blank(),axis.line.x = element_blank(),axis.title = element_text(size = 18),axis.text = element_text(size = 14),legend.title = element_blank(),legend.text = element_text(size = 12),legend.position = c(.7, .97),legend.background = element_rect(fill = "transparent")) +theme(strip.background = element_blank(),strip.text.x = element_text(angle = 90, size = 10, face = "bold")) +labs(x = "") + scale_y_continuous(expand=c(0,0)) +scale_x_discrete(expand = expansion(mult = c(0.03,0)))) +theme(legend.spacing.x = unit(.5, 'cm')) +guides(fill = guide_legend(direction = "horizontal")) +facet_grid(.~Patient_Barcode, scales = "free", space = "free", switch = "x")
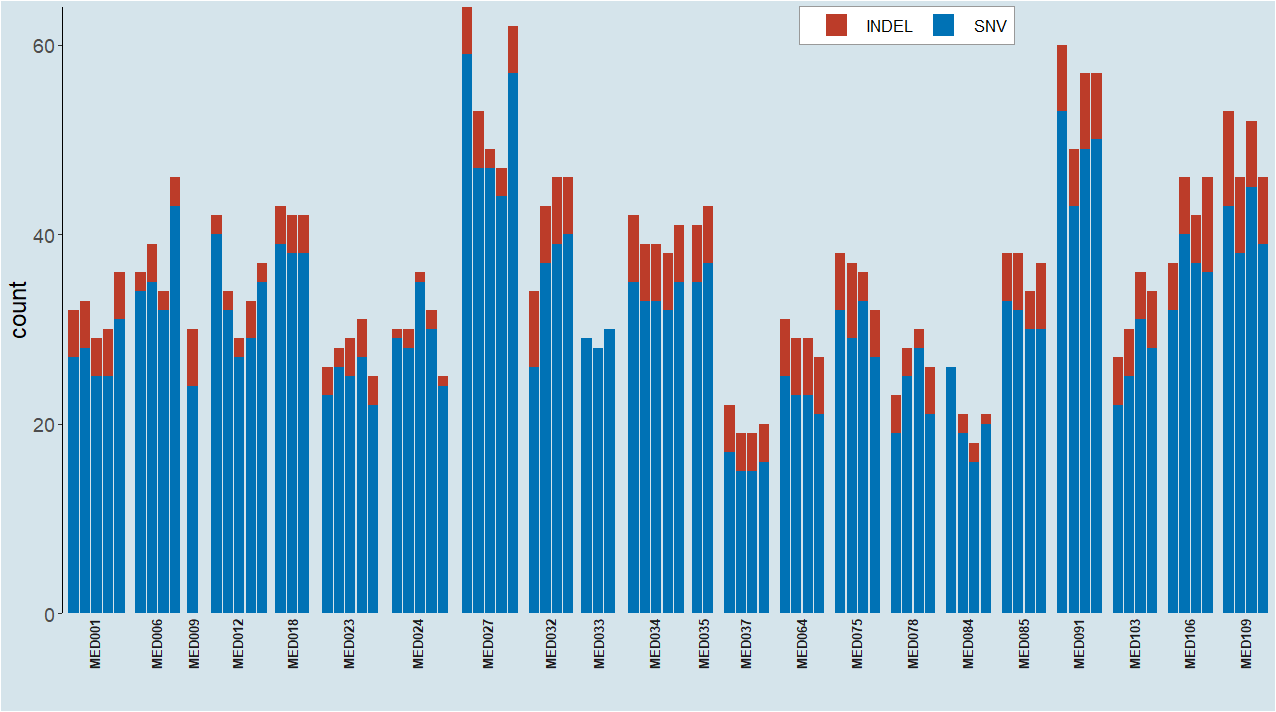
再美化一下:
(p2 <- p1 + scale_fill_paletteer_d("ggsci::default_nejm") +theme(legend.background = element_rect(fill = "white",color = "gray60"),panel.background = element_rect(fill = "#d5e4eb"),plot.background = element_rect(fill = "#d5e4eb")))

若有收获,就点个赞吧
0 人点赞
