使用showtext 包获得各种字体
默认下,我们可以对ggplot 中的字体进行一些设置,但这个family 特有限的,比如Times, Arial 这些比较标准的字体:
ggplot(chic, aes(x = date, y = temp, color = season)) +geom_point() +labs(x = "Year", y = "Temperature (°F)") +theme(legend.title = element_text(family = "Playfair",color = "chocolate",size = 14, face = "bold"))
图例的字体如上。
我们也可以做的花里胡哨一些,比如showtext 包就给了我们一个新世界的钥匙:
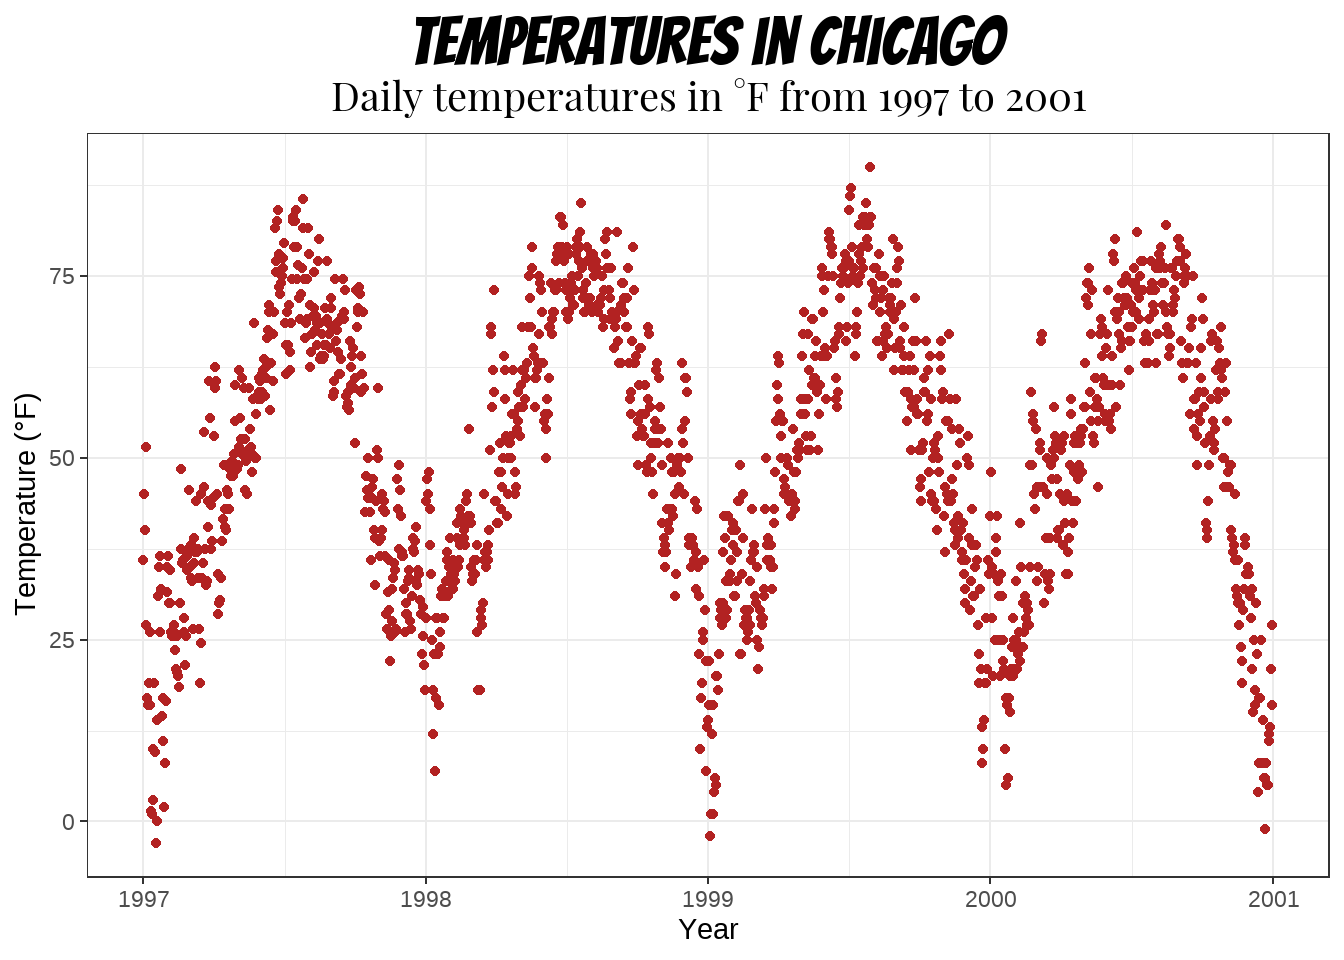
library(showtext)font_add_google("Playfair Display", ## name of Google font"Playfair") ## name that will be used in Rfont_add_google("Bangers", "Bangers")ggplot(chic, aes(x = date, y = temp)) +geom_point(color = "firebrick") +labs(x = "Year", y = "Temperature (°F)",title = "Temperatures in Chicago",subtitle = "Daily temperatures in °F from 1997 to 2001") +theme(plot.title = element_text(family = "Bangers", hjust = .5, size = 25),plot.subtitle = element_text(family = "Playfair", hjust = .5, size = 15))
作者的这些字体全部来自于:https://fonts.google.com/
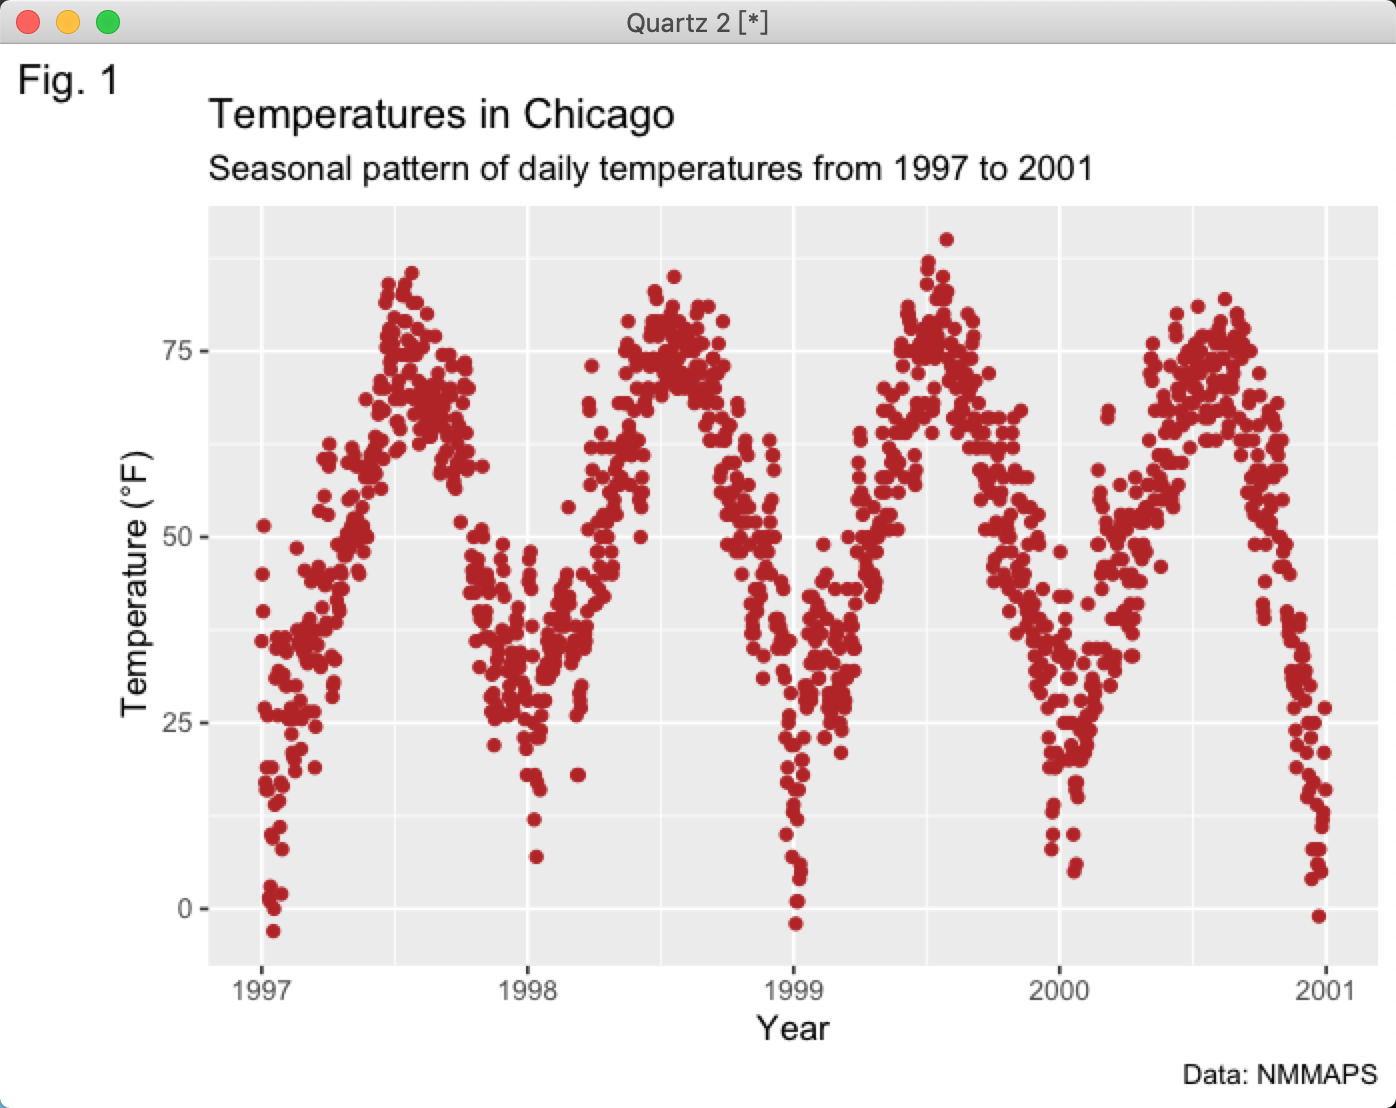
除此以外,还有些更酷的操作,比如下面这个图:
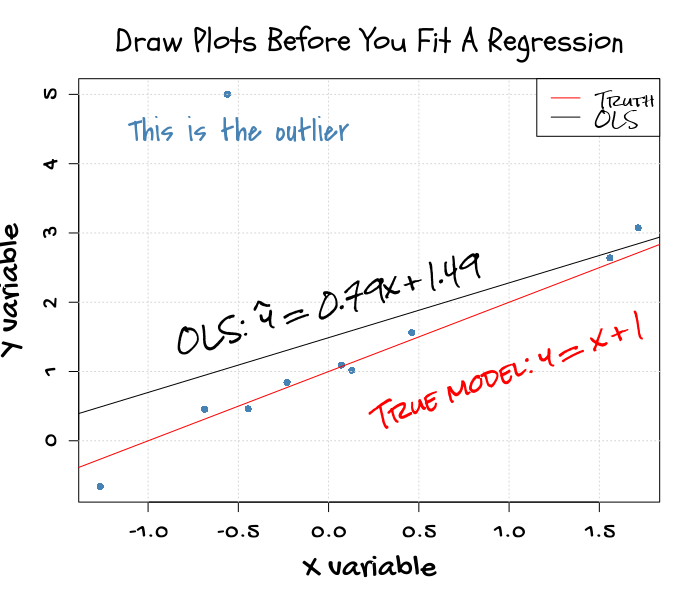
其实是R 画的哦,我们也来试试:
ggplot(chic, aes(x = date, y = temp)) +geom_point(color = "firebrick") +labs(x = "Year", y = "Temperature (°F)",title = "Temperatures in Chicago",subtitle = "Seasonal pattern of daily temperatures from 1997 to 2001",caption = "Data: NMMAPS",tag = "Fig. 1")
真是索然无味呀~
来点骚操作:
pacman::p_load(ggplot2, showtext)## Loading Google fonts (https://fonts.google.com/)font_add_google("Gochi Hand", "gochi")font_add_google("Schoolbell", "bell")font_add_google("Covered By Your Grace", "grace")font_add_google("Rock Salt", "rock")## Automatically use showtext to render text for future devicesshowtext_auto()# load csvchic = readr::read_csv("Desktop/chicago-nmmaps.csv")ggplot(chic, aes(x = date, y = temp)) +geom_point(color = "firebrick") +labs(x = "Year", y = "Temperature (°F)",title = "Temperatures in Chicago",subtitle = "Seasonal pattern of daily temperatures from 1997 to 2001",caption = "Data: NMMAPS",tag = "Fig. 1") + theme_classic() +theme(axis.title = element_text(family = "gochi"),plot.title = element_text(family = "bell", hjust = .5, size = 25),plot.subtitle = element_text(family = "bell", hjust = .5, size = 15),axis.text = element_text(family = "gochi"),plot.tag = element_text(family = "rock"),plot.caption = element_text(family = "rock"))
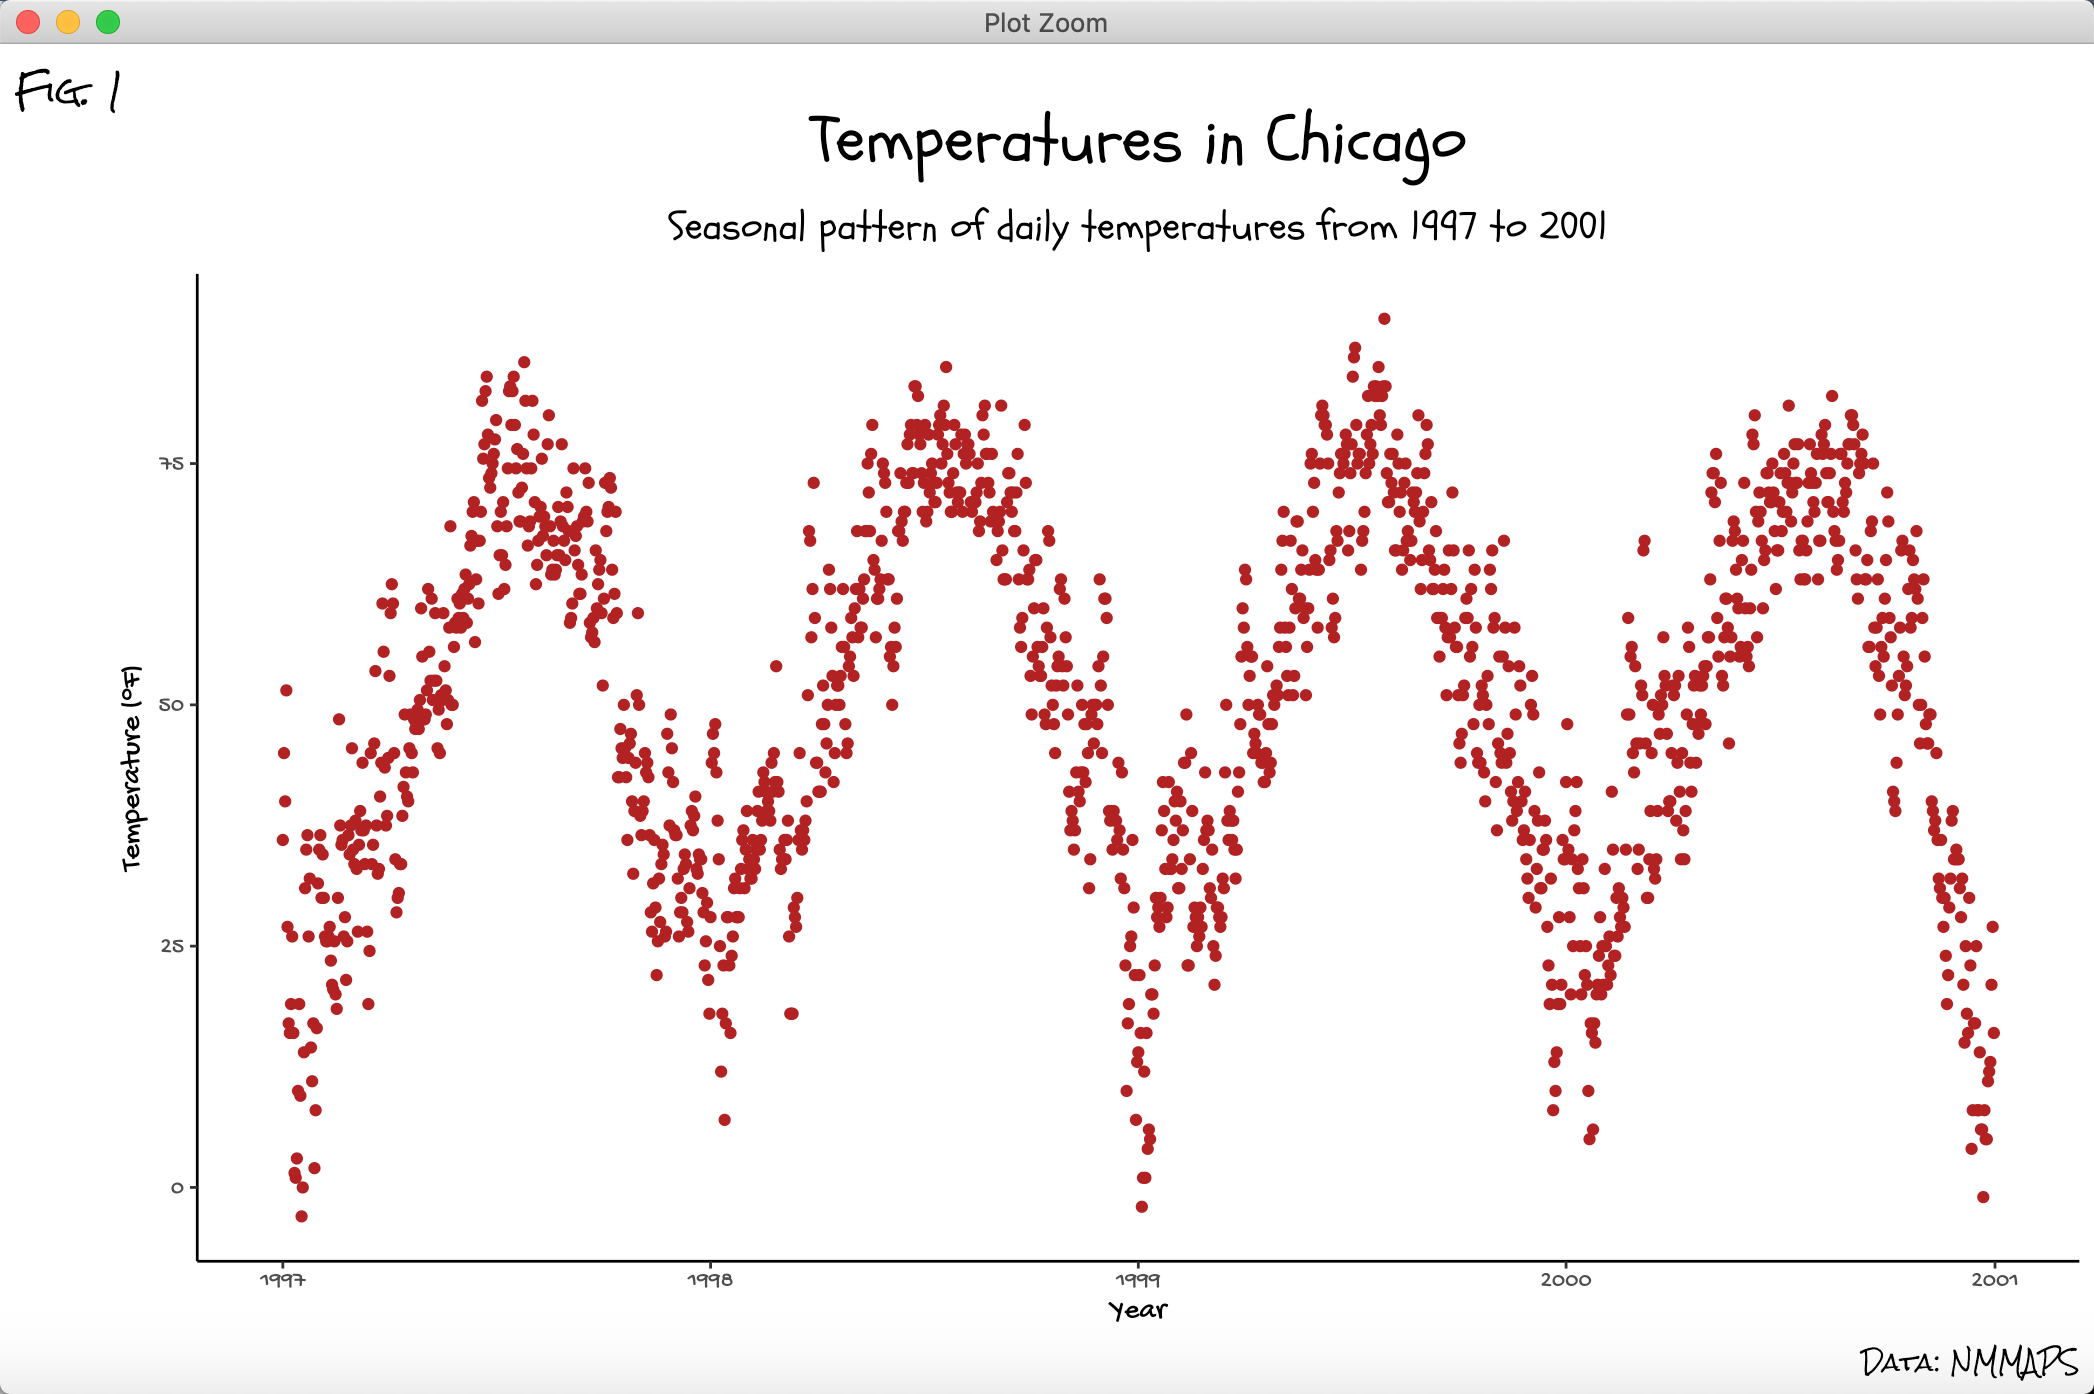
嘻嘻嘻~
其实如果想统一设置文字,可以直接对text 参数进行设置即可:
theme(text = element_text(family = "gochi"))
需要汉字的话,可以用下面的代码:
library(showtext)font_install(source_han_serif())font_families()## [1] "sans" "serif" "mono" "wqy-microhei"## [5] "source-han-serif-cn"
其他内容,可以参见:https://github.com/yixuan/showtext
设置所有字体
参见:https://guangchuangyu.github.io/cn/2017/09/ggplot2-set-font/
ggplot 中对theme 定义的文字类型,是限定在geom_text 意外的,是几何对象aes 以外的文字部分,因此是theme 是无法对其统一修改的。
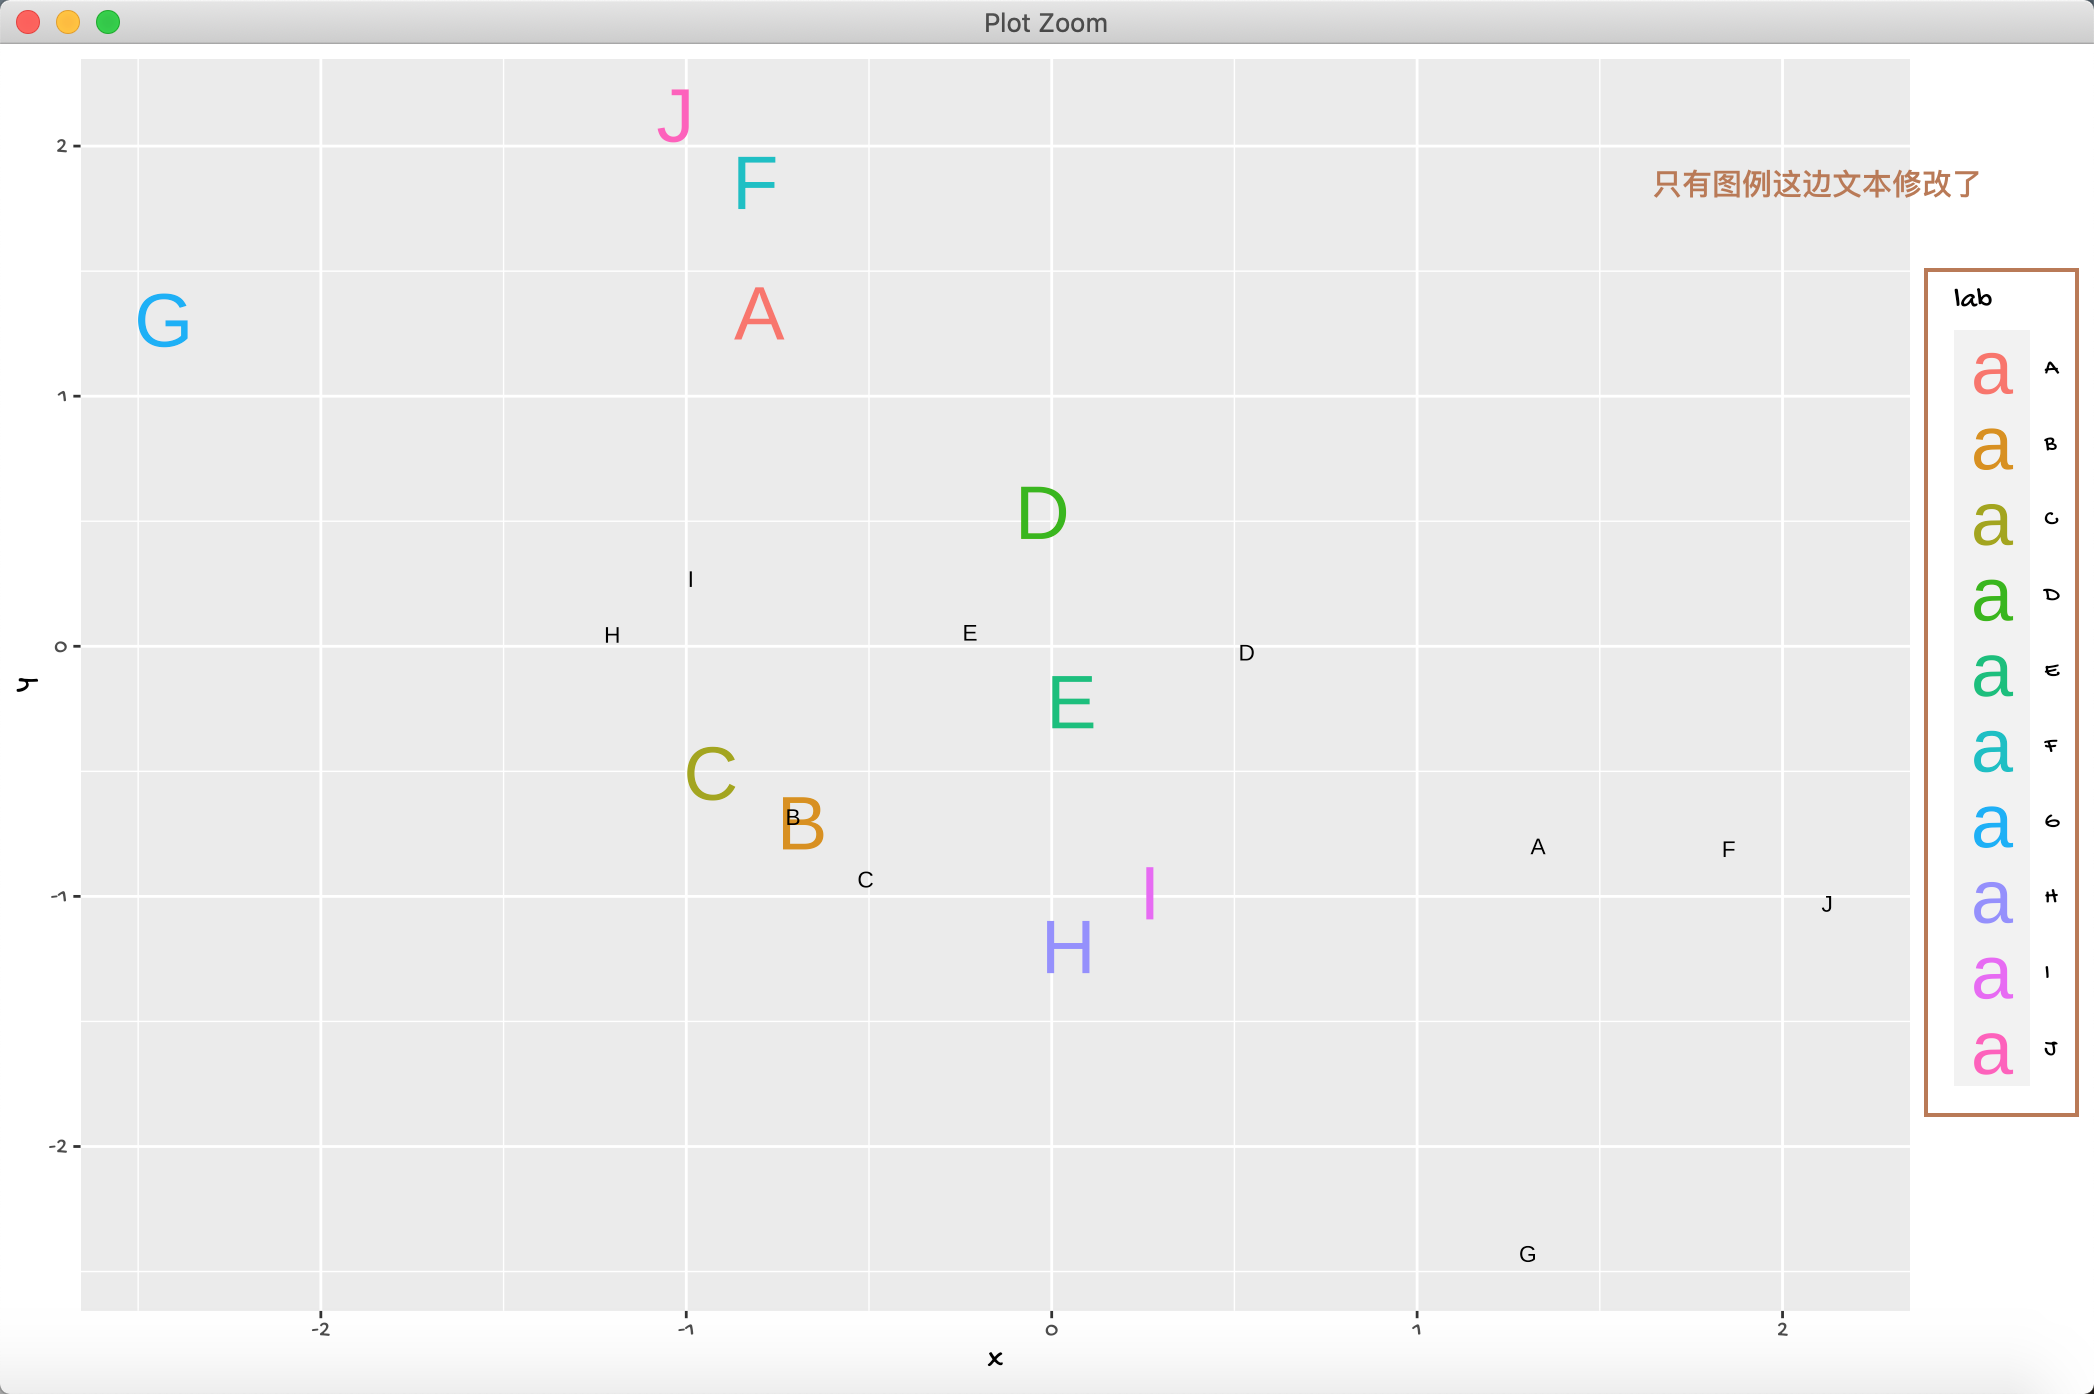
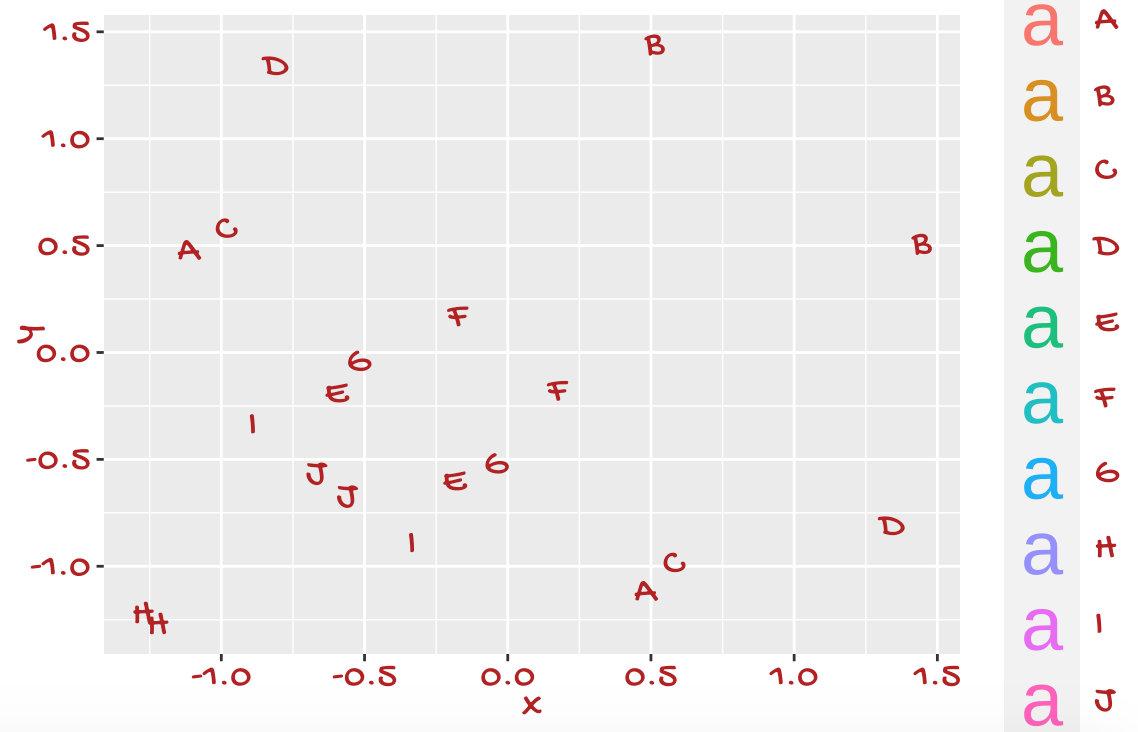
正好看到了Y 叔写的包,就一起来做笔记了。
d <- data.frame(x=rnorm(10), y=rnorm(10), lab=LETTERS[1:10])p <- ggplot(d, aes(x, y)) +geom_text(aes(label=lab, color=lab), size=10) +geom_text(aes(y, x, label=lab), size=3)p + theme(text = element_text(family = "gochi"))
这里先安装一下:
devtools::install_github("GuangchuangYu/yyplot")
直接在原本的图像对象基础之上使用:
library(yyplot)g <- set_font(p, family="gochi", color="firebrick", size=5)grid::grid.draw(g) # 最后需要手动输出一下
ps:y 叔叔的这个包有点粗暴,全部文字都变啦~
extrafont
extrafont包更改可视化的字体。首先,我们必须执行函数font_import()来查找笔记本电脑上的所有字体。你只需要执行这个函数一次。然后使用loadfonts()函数加载字体。您可以使用fonts()获得所有字体的列表。
作者:周运来就是我
链接:https://www.jianshu.com/p/6cc0c17e30ce
来源:简书
著作权归作者所有。商业转载请联系作者获得授权,非商业转载请注明出处。

若有收获,就点个赞吧
0 人点赞
