参见:https://shiny.rstudio.com/tutorial/written-tutorial/lesson5/
shiny 执行的顺序是,首先当适应shinyapp 允许命令后,会在全局环境中加载相关的内容。
而只有server 中的render 函数,才会在使用用户第一访问shiny 或通过交互按钮切换显示内容时才会被反复执行。
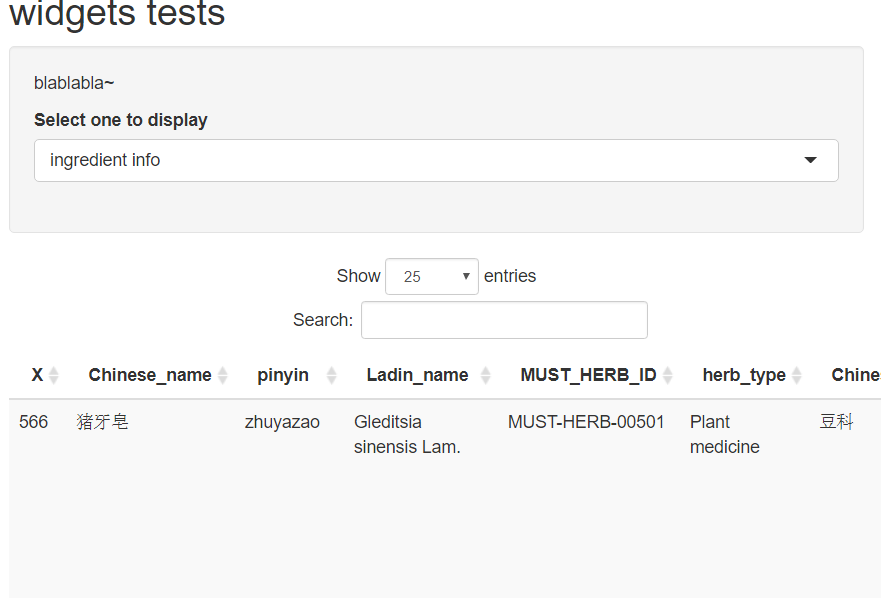
在运行官方提供的代码前,先解决一下先前的无法通过获得交互选项结果修改输出表格的问题。
非常的神奇,无论如何尝试,只有在使用swich 根据结果的判断来进行返回值的情况下,才能够正确的进行显示:
# Define server logic ----server <- function(input, output) {output$test_df <- renderDataTable({data <- switch(input$select,"Herb info" = test_list$`Herb info`,"ingredient info" = test_list$`ingredient info`)# a <- input$select# data <- test_list$a# data <- test_list$`input$select`#data})output$test_txt <- renderText({paste0("output is ", input$select)})}
看来以后绑定switch 了。
可是,如果是批量的进行赋值或者是连续性内容进行判断赋值呢?switch 有没有替代品呢?
我们还可以玩的更高级,将参数以列表的形式传递给函数:
server <- function(input, output) {output$map <- renderPlot({args <- switch(input$var,"Percent White" = list(counties$white, "darkgreen", "% White"),"Percent Black" = list(counties$black, "black", "% Black"),"Percent Hispanic" = list(counties$hispanic, "darkorange", "% Hispanic"),"Percent Asian" = list(counties$asian, "darkviolet", "% Asian"))args$min <- input$range[1]args$max <- input$range[2]do.call(percent_map, args)})}
全部内容如下:
#################################################### Project: Rescue the Princess## File name: app.R## Date: Fri Jun 25 16:47:13 2021## Author: Peng## R_Version: R version 4.0.2 (2020-06-22)## R_Studio_Version: 1.4.1106## Platform Version: Windows 10 x64 (build 19042)################################################### # pre-loaded data&library -----------------------------------------------# Load packages ----library(shiny)library(maps)library(mapproj)# Load data ----counties <- readRDS("./app-census/data/counties.rds")# Source helper functions -----source("helpers.R")# User interface ----ui <- fluidPage(titlePanel("censusVis"),sidebarLayout(sidebarPanel(helpText("Create demographic maps withinformation from the 2010 US Census."),selectInput("var",label = "Choose a variable to display",choices = c("Percent White", "Percent Black","Percent Hispanic", "Percent Asian"),selected = "Percent White"),sliderInput("range",label = "Range of interest:",min = 0, max = 100, value = c(0, 100))),mainPanel(plotOutput("map"))))# Server logic ----server <- function(input, output) {output$map <- renderPlot({data <- switch(input$var,"Percent White" = counties$white,"Percent Black" = counties$black,"Percent Hispanic" = counties$hispanic,"Percent Asian" = counties$asian)color <- switch(input$var,"Percent White" = "darkgreen","Percent Black" = '#fdcc8a',"Percent Hispanic" = '#fc8d59',"Percent Asian" = '#d7301f')legend.title <- switch(input$var,"Percent White" = "% White","Percent Black" = '% Black',"Percent Hispanic" = '% Hispanic',"Percent Asian" = '% Asian')percent_map(var = data, color = color, legend.title = legend.title, input$range[1], input$range[2])})}# Run app ----shinyApp(ui, server)

若有收获,就点个赞吧
0 人点赞
