这里面涉及到的知识点包括两个,一个是ggplot2 对象的拼图(柱状图+分组图),以及如何按照指定的分组要求按照指定的顺序排序(大小)。
先加载包:
# 开始绘图library(ggplot2)library(patchwork)library(RColorBrewer)
排序
首先看一下数据:
> dplyr::glimpse(mutation_number)Rows: 8,640Columns: 4$ name <chr> "case1_biorep_A_techrep_1", "case1_biorep_A_tech…$ type <chr> "case1", "case1", "case1", "case1", "case1", "ca…$ counts <int> 542, 542, 542, 542, 542, 542, 542, 542, 542, 542…$ mutation_type <fct> Missense_Mutation, Missense_Mutation, Frame_Shif…
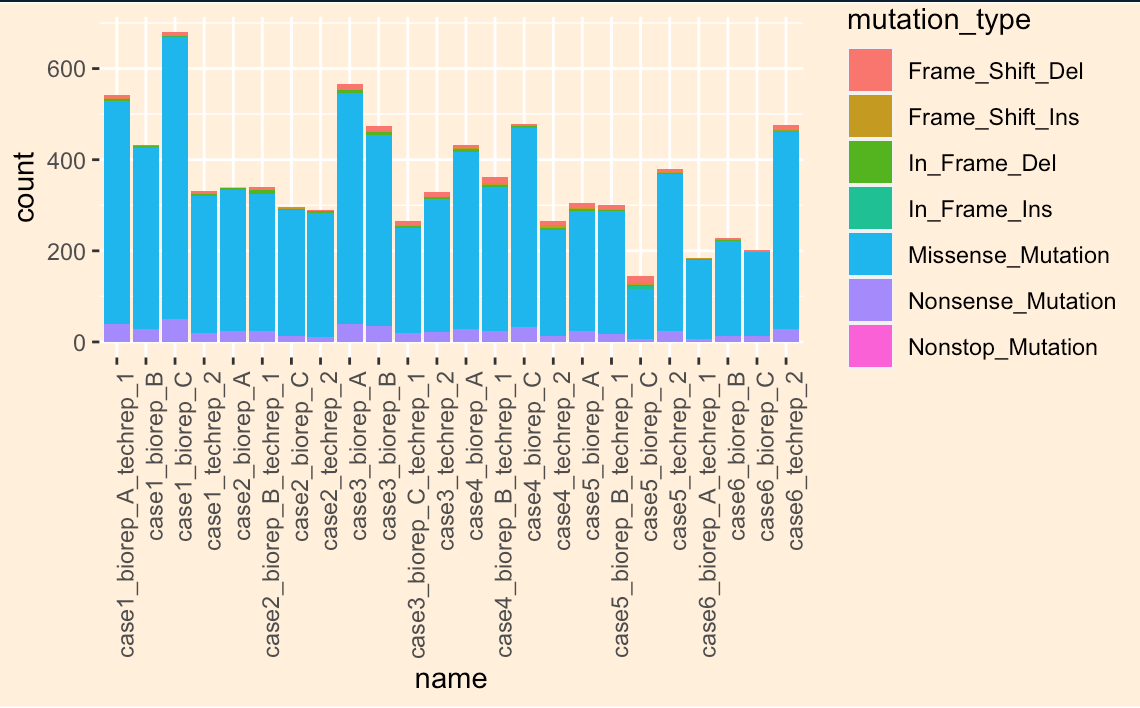
先做一个最简单的柱状图:
p1 <- ggplot(data = mutation_number) +geom_bar(mapping = aes(x = name, fill = mutation_type), position = "stack") +theme(axis.text.x = element_text(angle = 90, hjust = 1))p1 + theme(panel.background = element_rect(fill = NA),plot.background = element_rect(fill = "antiquewhite1"),legend.background = element_rect(fill = "transparent"))
如果想要对数据排序,则需要将指定数据列修改为factor 类型,接着通过指定levels,来设定顺序。
我们可以直接将排序后的内容作为levels :
mutation_number$name <- factor(mutation_number$name, levels = unique(mutation_number[order(mutation_number$counts),]$name))
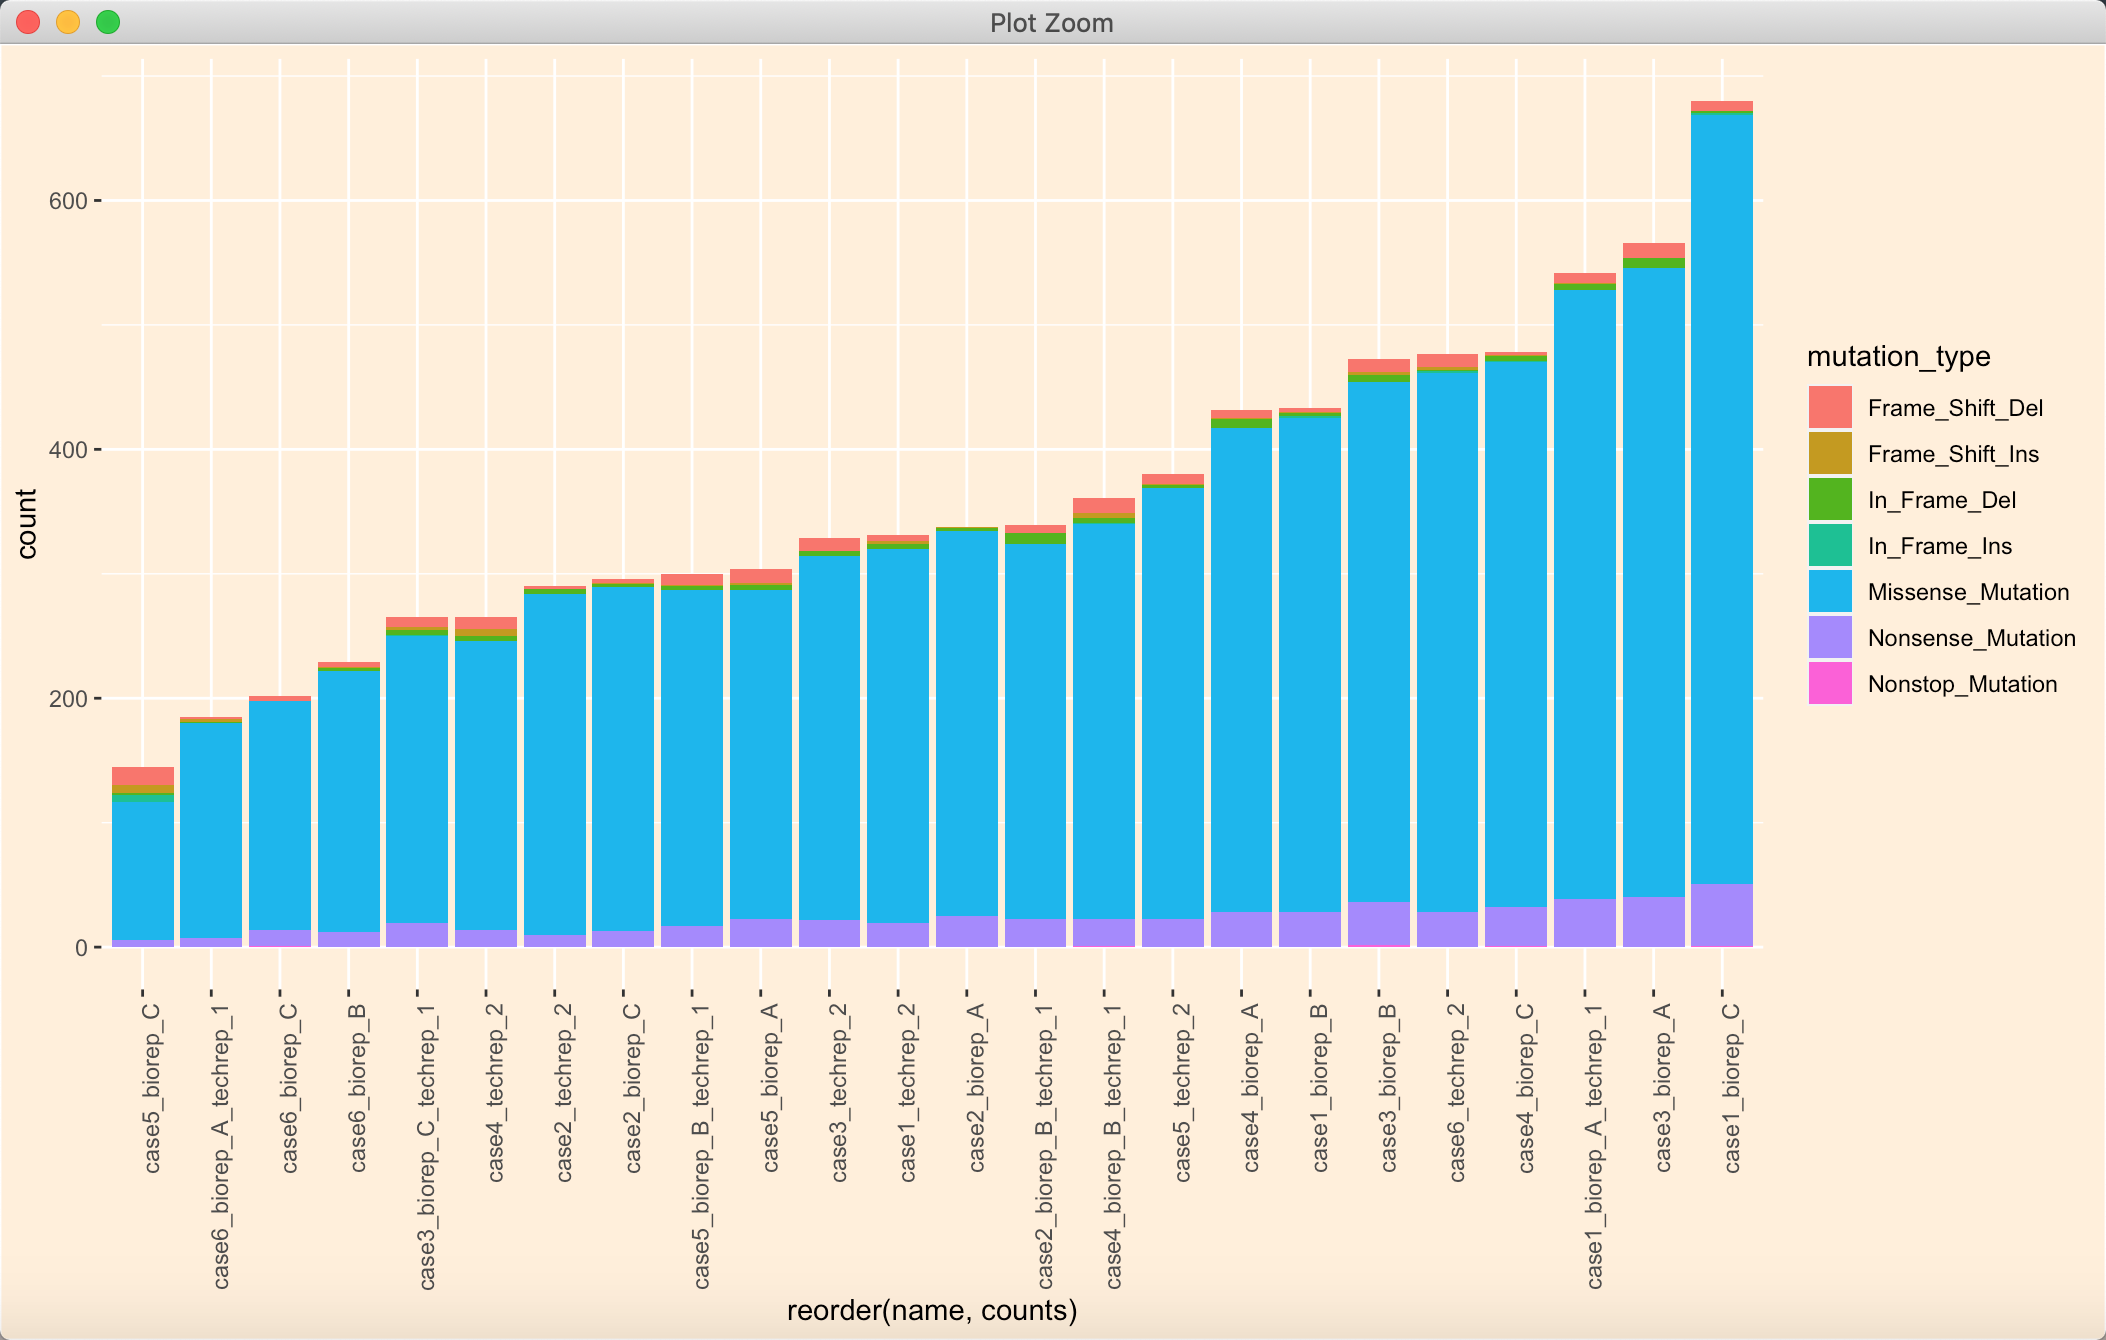
也可以先定义好因子,接着再利用reorder 函数,将A 列按照B 列大小排序:
a <- mutation_number$namemutation_number$name <- factor(mutation_number$name, levels = unique(mutation_number$name))p1 <- ggplot(data = mutation_number) +geom_bar(mapping = aes(x = reorder(name, counts), fill = mutation_type), position = "stack") +theme(axis.text.x = element_text(angle = 90, hjust = 1))p1 + theme(panel.background = element_rect(fill = NA),plot.background = element_rect(fill = "antiquewhite1"),legend.background = element_rect(fill = "transparent"))
这时候还是没有组间分组呀,本来是写的循环,将数据框按照指定类型列分组提取,接着将提取的结果排序:
# 这样还是不能实现组内排序,写个循环搞定mutation_number_list_by_type <- list()loop_count <- 1for (x in unique(annotationDat$type)) {tmp <- subset(mutation_number, type == x)tmp$name <- factor(tmp$name)tmp$name <- reorder(tmp$name, tmp$counts)mutation_number_list_by_type[[loop_count]] <- tmploop_count = loop_count + 1}mutation_number_new <- do.call("rbind", mutation_number_list_by_type)
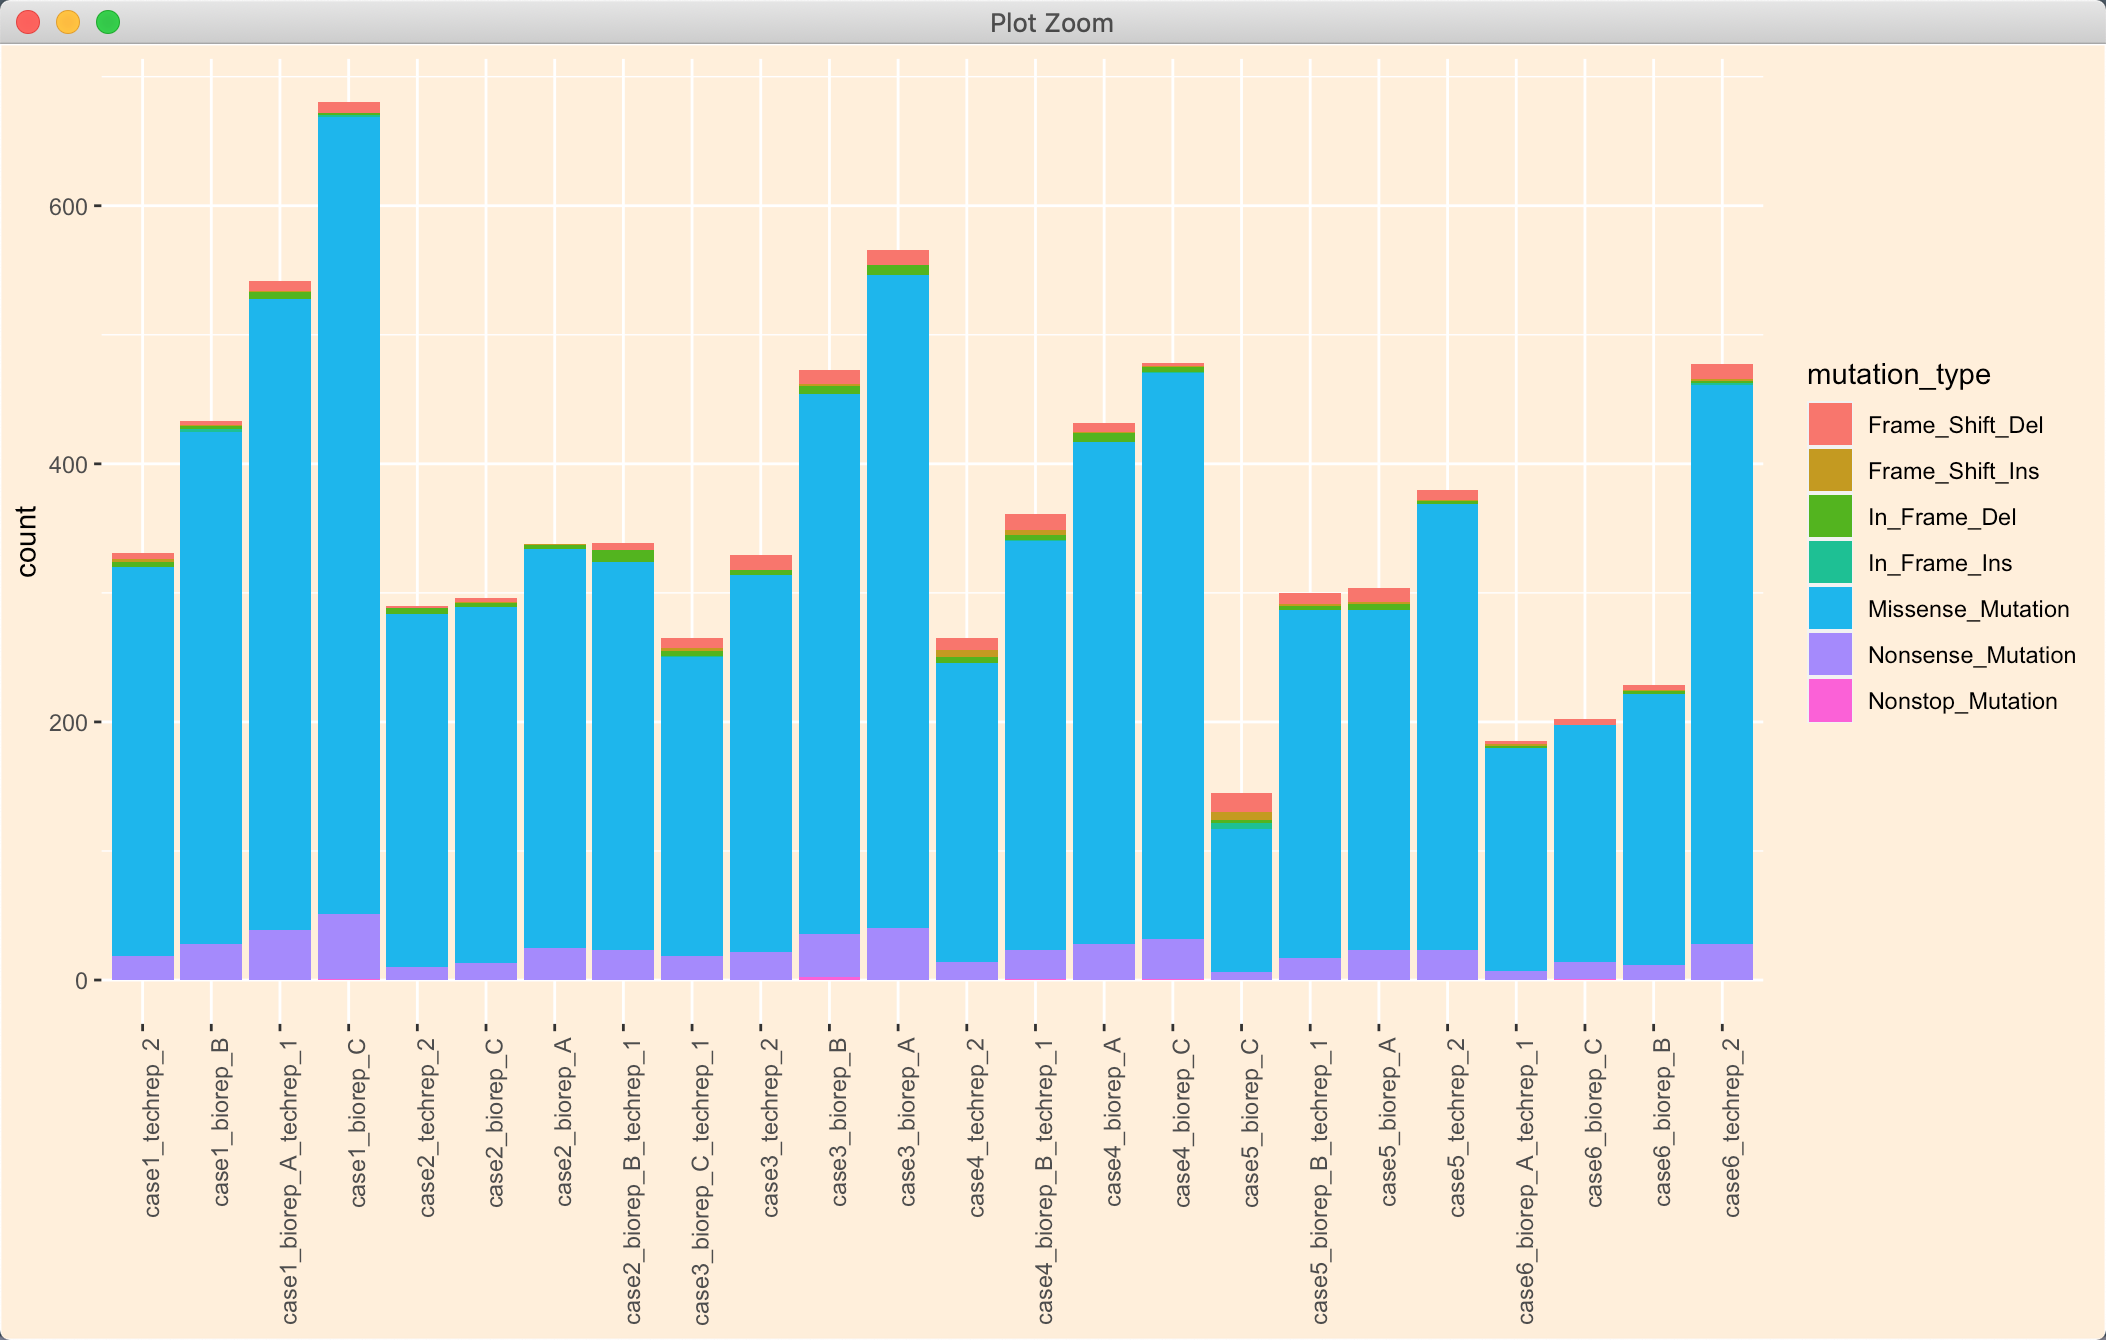
忽然发现这太笨啦,而且R 不喜欢循环;忽然注意到order 可以接受多个值,那我岂不是可以先按type 排序,再按count 排序?
# order 按照两列排序即可tmp = mutation_number[order(mutation_number$type,mutation_number$counts),]# 重新改一下levels 顺序tmp$name <- factor(tmp$name, levels = unique(tmp$name))
ps:reorder 貌似不可以接受多行排序。
分组图和拼图
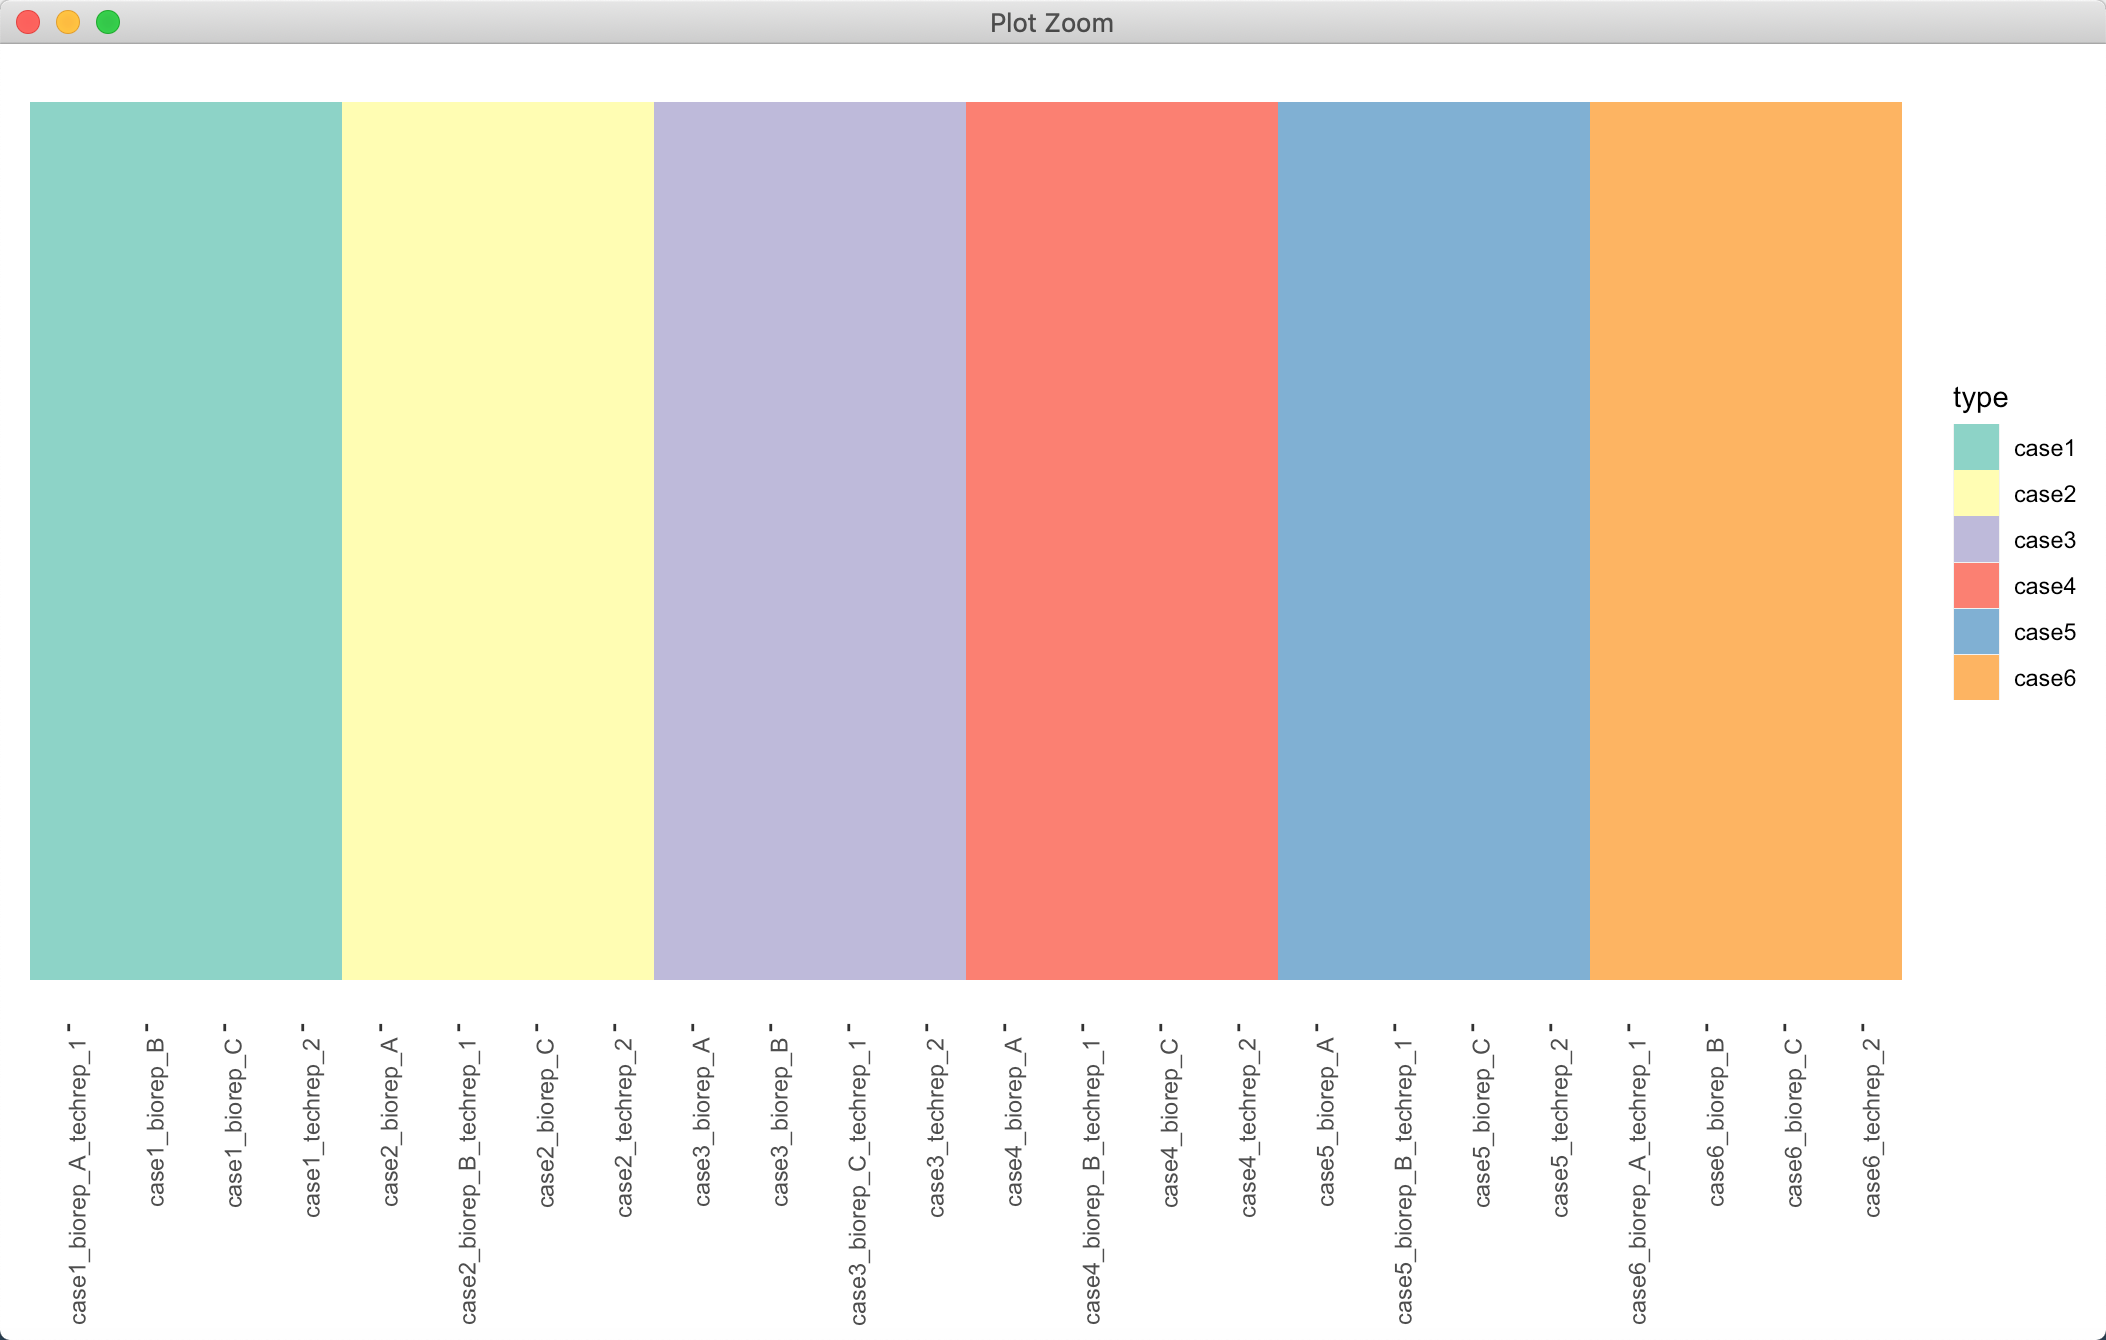
分组图实际也就是一个柱状图,我们把柱状图的各个边边角角,什么坐标轴呀,各种文字对象,只保留图和图例即可,其他统统去掉:
p2 <- ggplot(data = annotationDat, aes(x = name, y = 1)) + geom_tile(aes(fill = type)) +scale_fill_manual(values = brewer.pal(6, "Set3")) + theme(panel.grid = element_blank(),panel.background = element_blank(), axis.line = element_blank(),axis.ticks.y = element_blank(), axis.text.y = element_blank(),axis.title = element_blank(),axis.text.x = element_text(angle = 90, hjust = 1))
拼图也很简单,将柱状图放在上面(将x 轴文字去除),将分组图放在下面,合理分配一下上下比例(height 参数):
p <- wrap_plots(p1, p2, nrow = 2, heights = c(11, 1))p
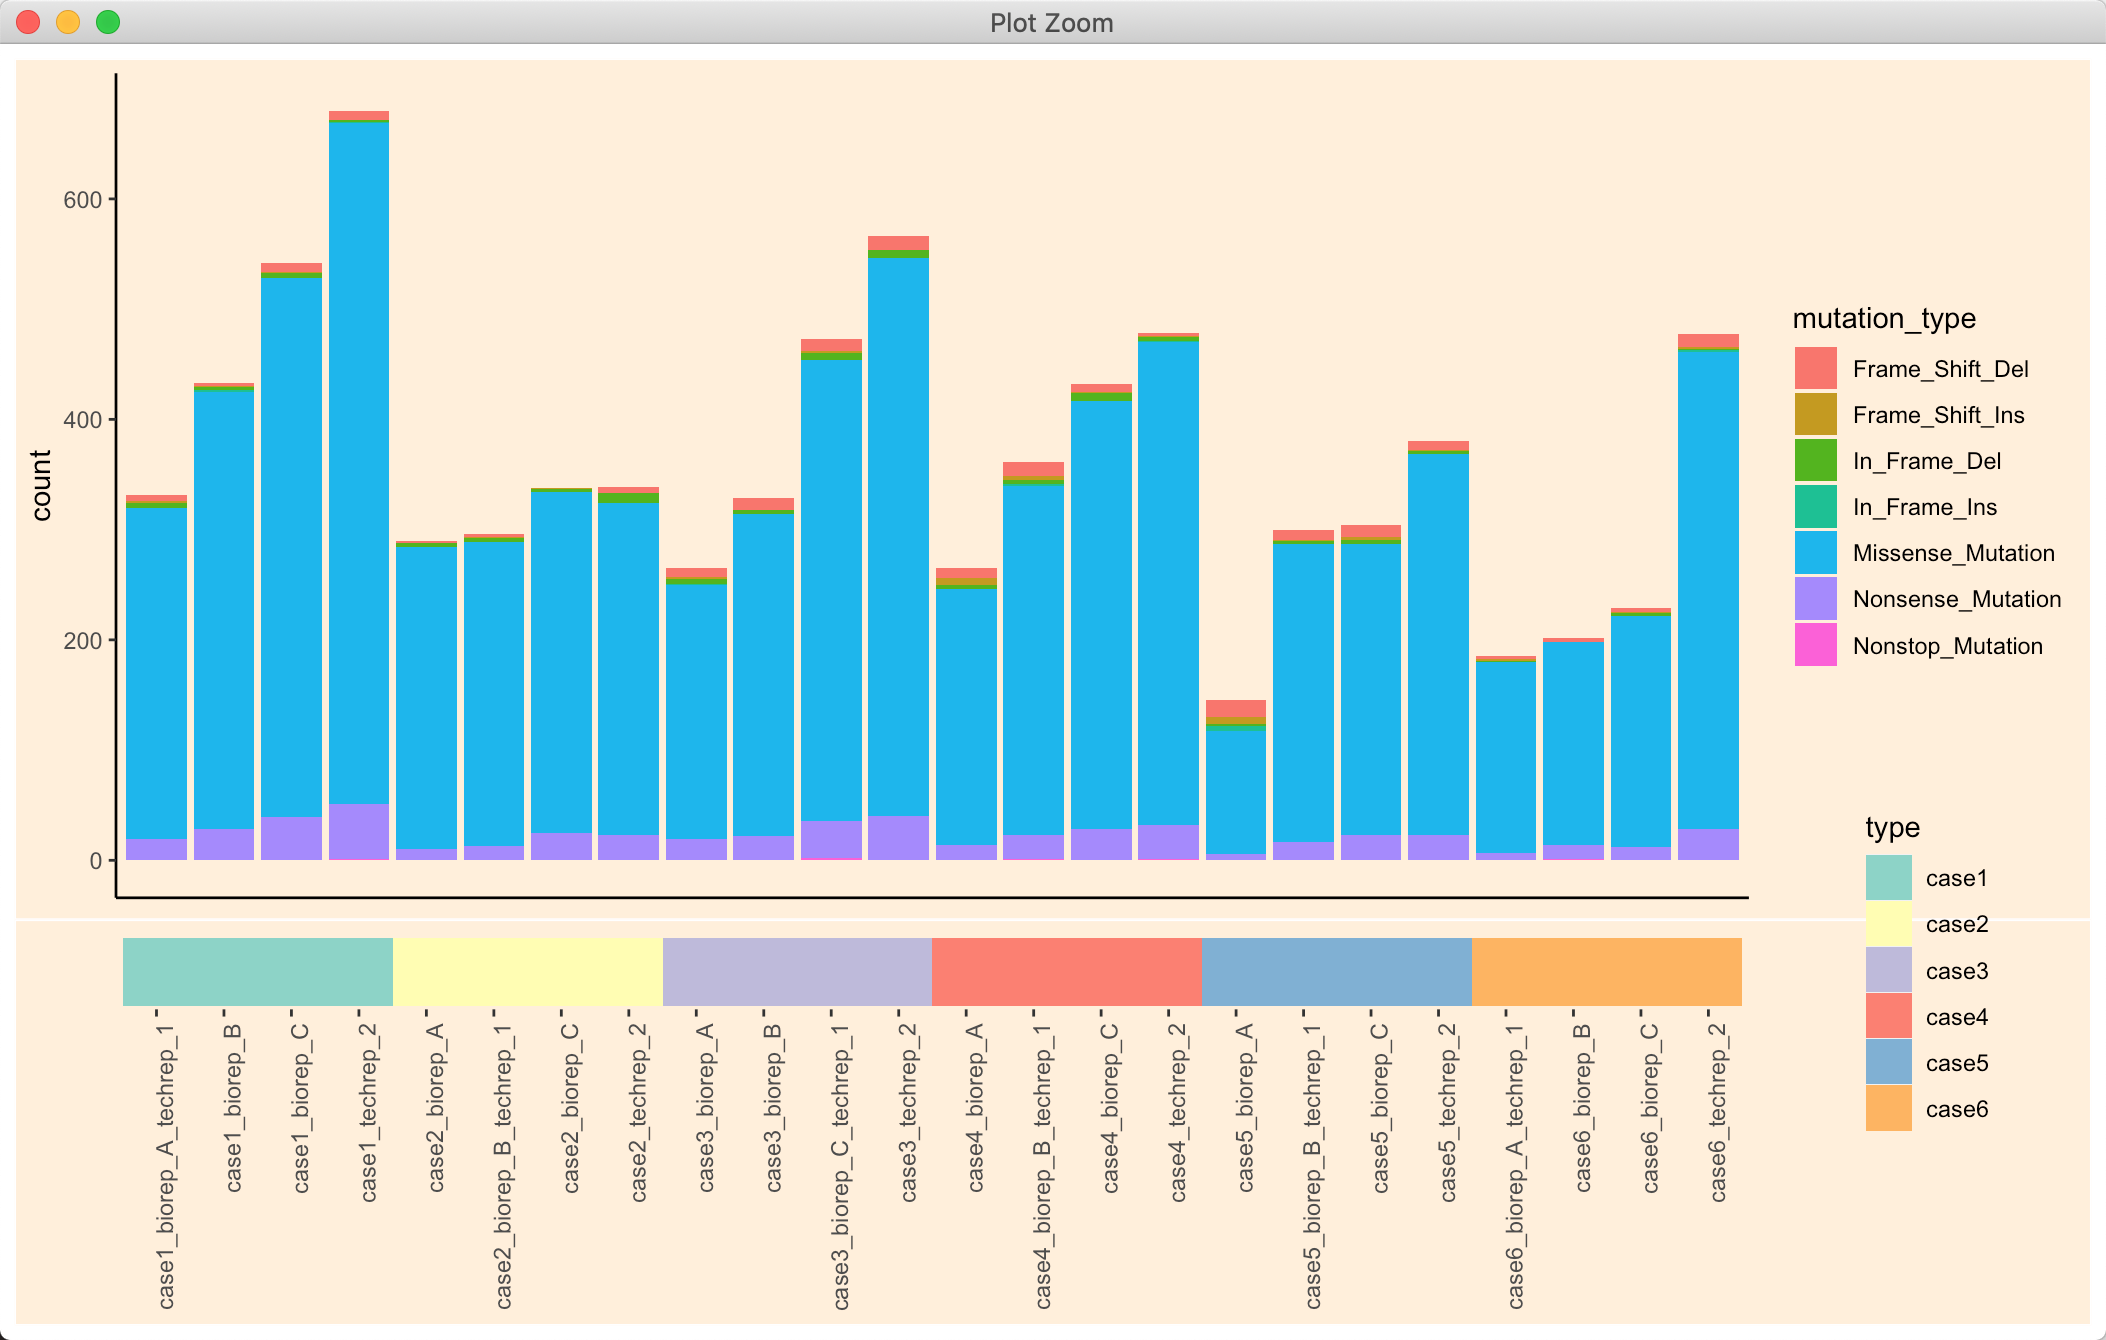
其实不设定背景也还好看:
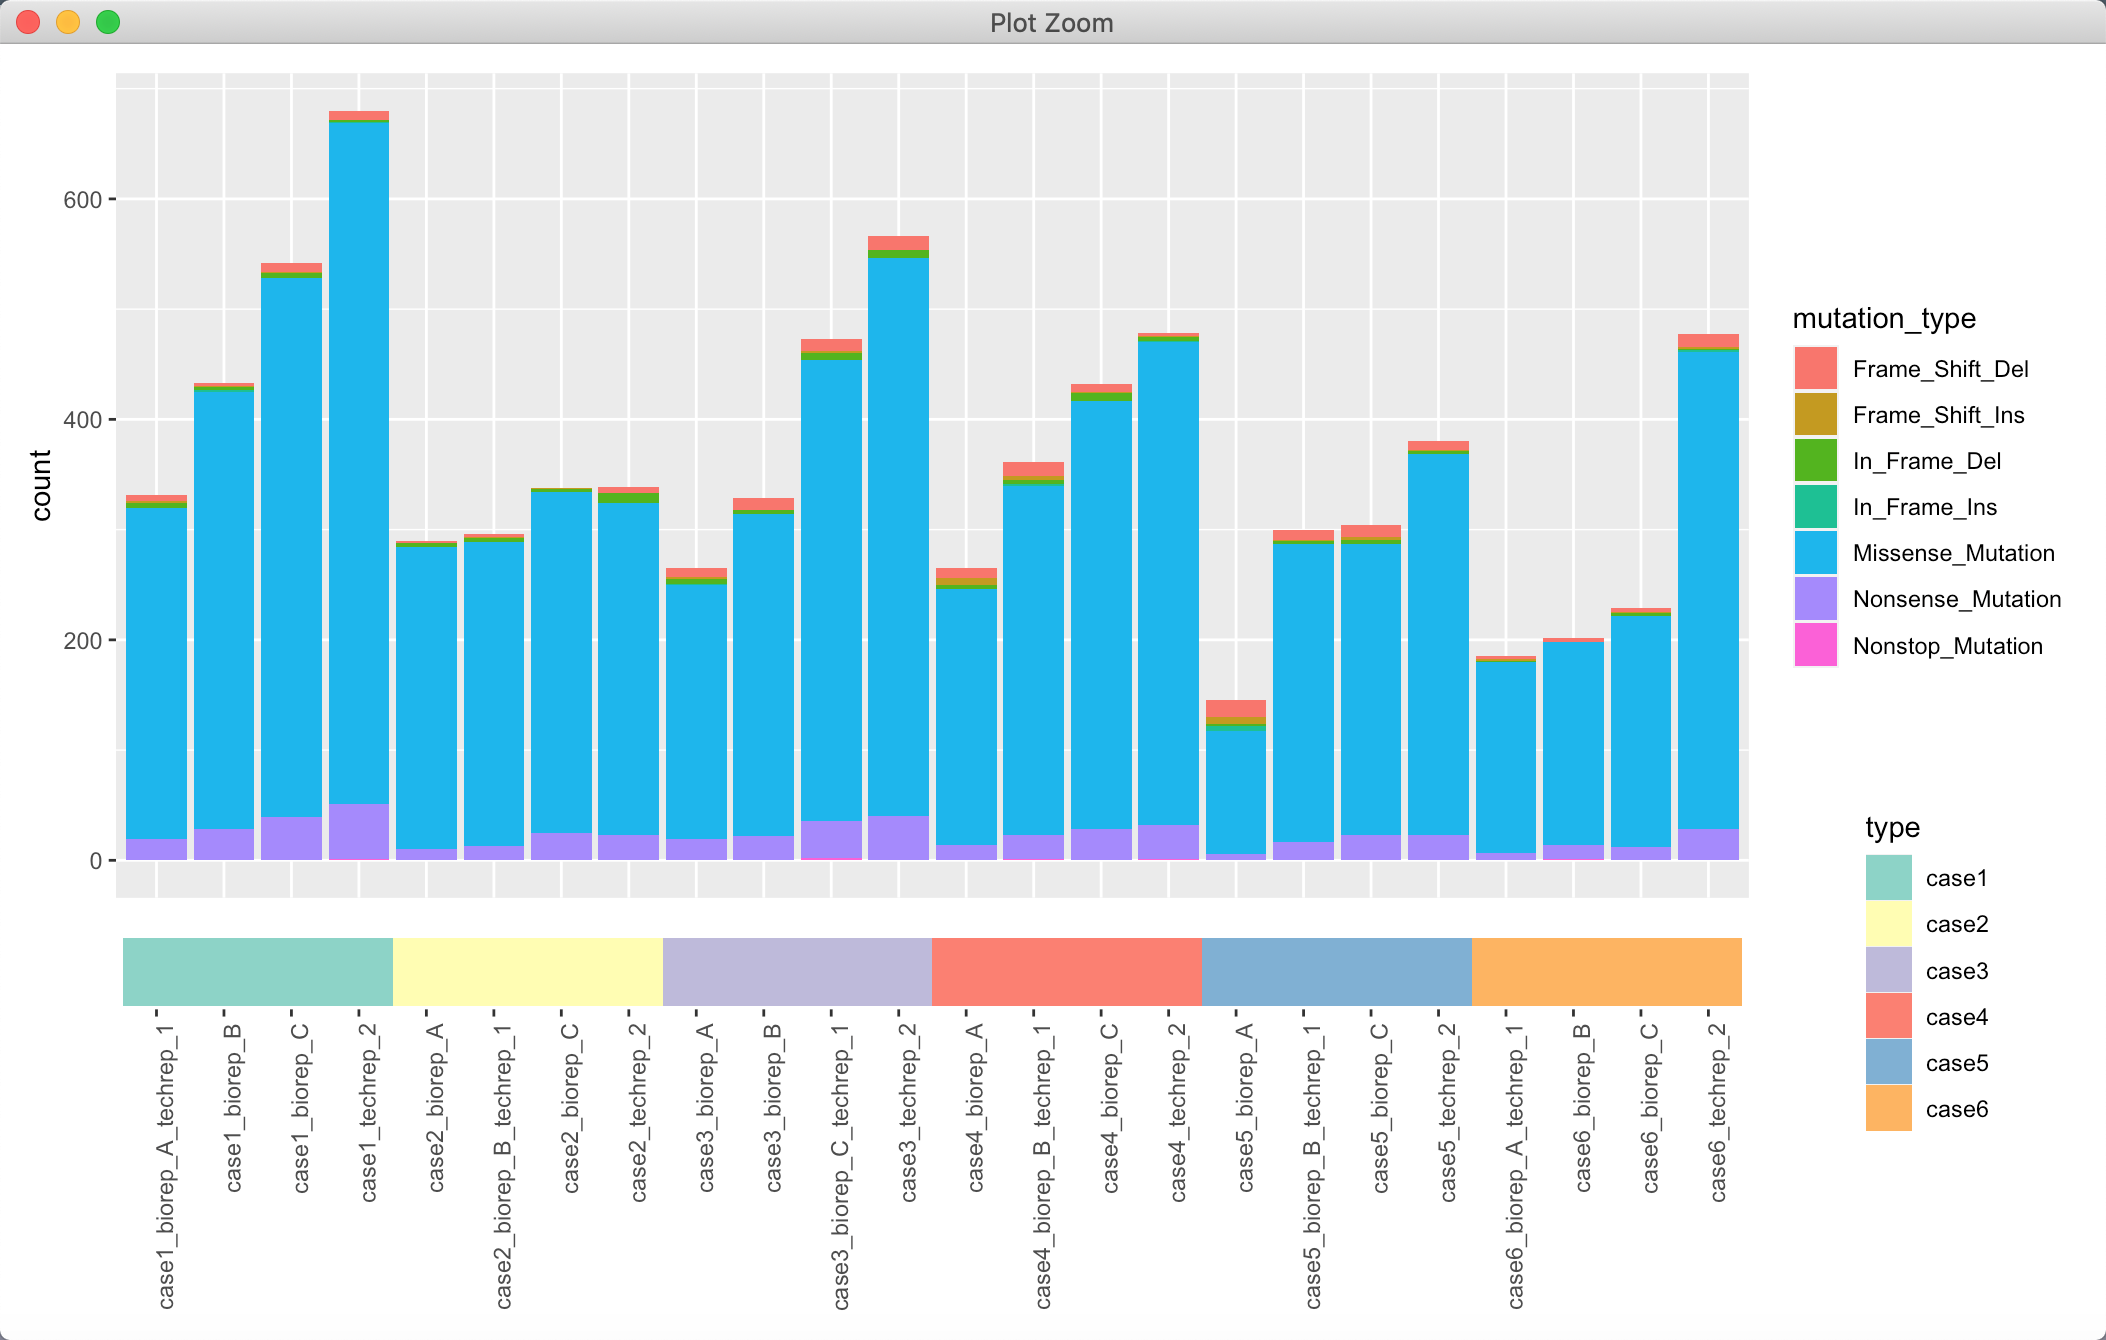
可能一些细节处的修改,可以后期查找各种ggplot 的内容慢慢打磨~
全部代码
# 排序mutation_number_new <- mutation_number[order(mutation_number$type,mutation_number$counts),]# 重新改一下levels 顺序mutation_number_new$name <- factor(mutation_number_new$name, levels = unique(mutation_number_new$name))# 画图p1 <- ggplot(data = mutation_number_new) +geom_bar(mapping = aes(x = name, fill = mutation_type), position = "stack") +theme(axis.text.x=element_blank(),axis.title.x=element_blank(),axis.ticks.x=element_blank())p1p2 <- ggplot(data = annotationDat, aes(x = name, y = 1)) + geom_tile(aes(fill = type)) +scale_fill_manual(values = brewer.pal(6, "Set3")) + theme(panel.grid = element_blank(),panel.background = element_blank(), axis.line = element_blank(),axis.ticks.y = element_blank(), axis.text.y = element_blank(),axis.title = element_blank(),axis.text.x = element_text(angle = 90, hjust = 1))p2p <- wrap_plots(p1, p2, nrow = 2, heights = c(11, 1))p

若有收获,就点个赞吧
0 人点赞
