使用起来非常的简单:
my_packages<- c("DataExplorer")boost_install_packages(my_packages = my_packages, loaded = T)laml_df <- as.data.frame(laml_filter@data)laml_df_select <- laml_df[,c("Hugo_Symbol","Variant_Classification","Variant_Type","Tumor_Sample_Barcode", "VAF")]annoplot_df2 <- annoplot_df; annoplot_df2$Tumor_Sample_Barcode <- rownames(annoplot_df2)rownames(annoplot_df2) <- NULLlaml_df_select <- merge(laml_df_select, annoplot_df2, by = "Tumor_Sample_Barcode")str(laml_df_select)create_report(laml_df_select)
就一个函数:create_report
最后会生成一个html 的report 文件:
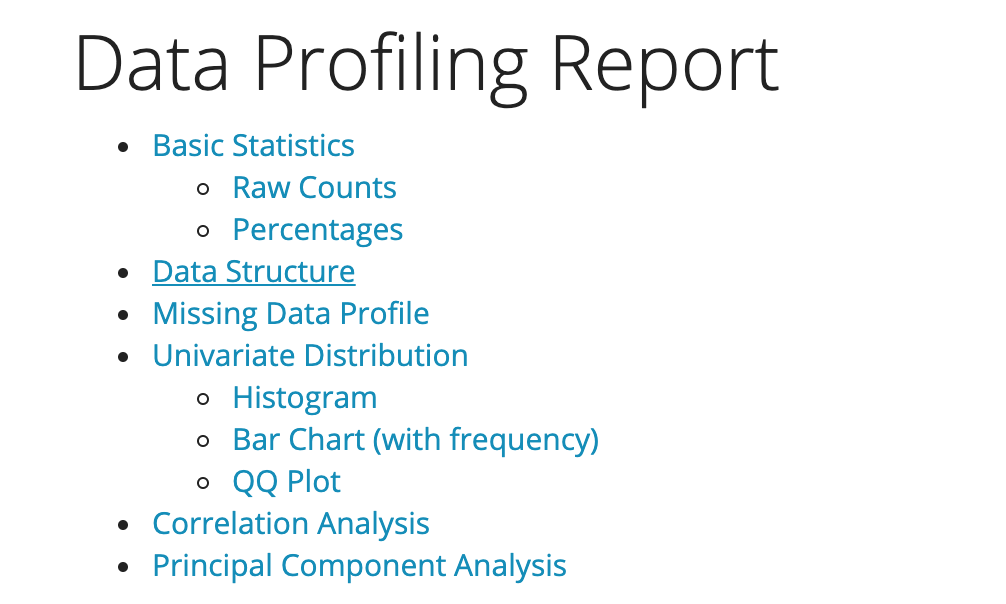
其实我比较感兴趣的是缺失值, histogram 和barplot。
可以比较方便的获得连续性数据以及分布数据的基本信息。
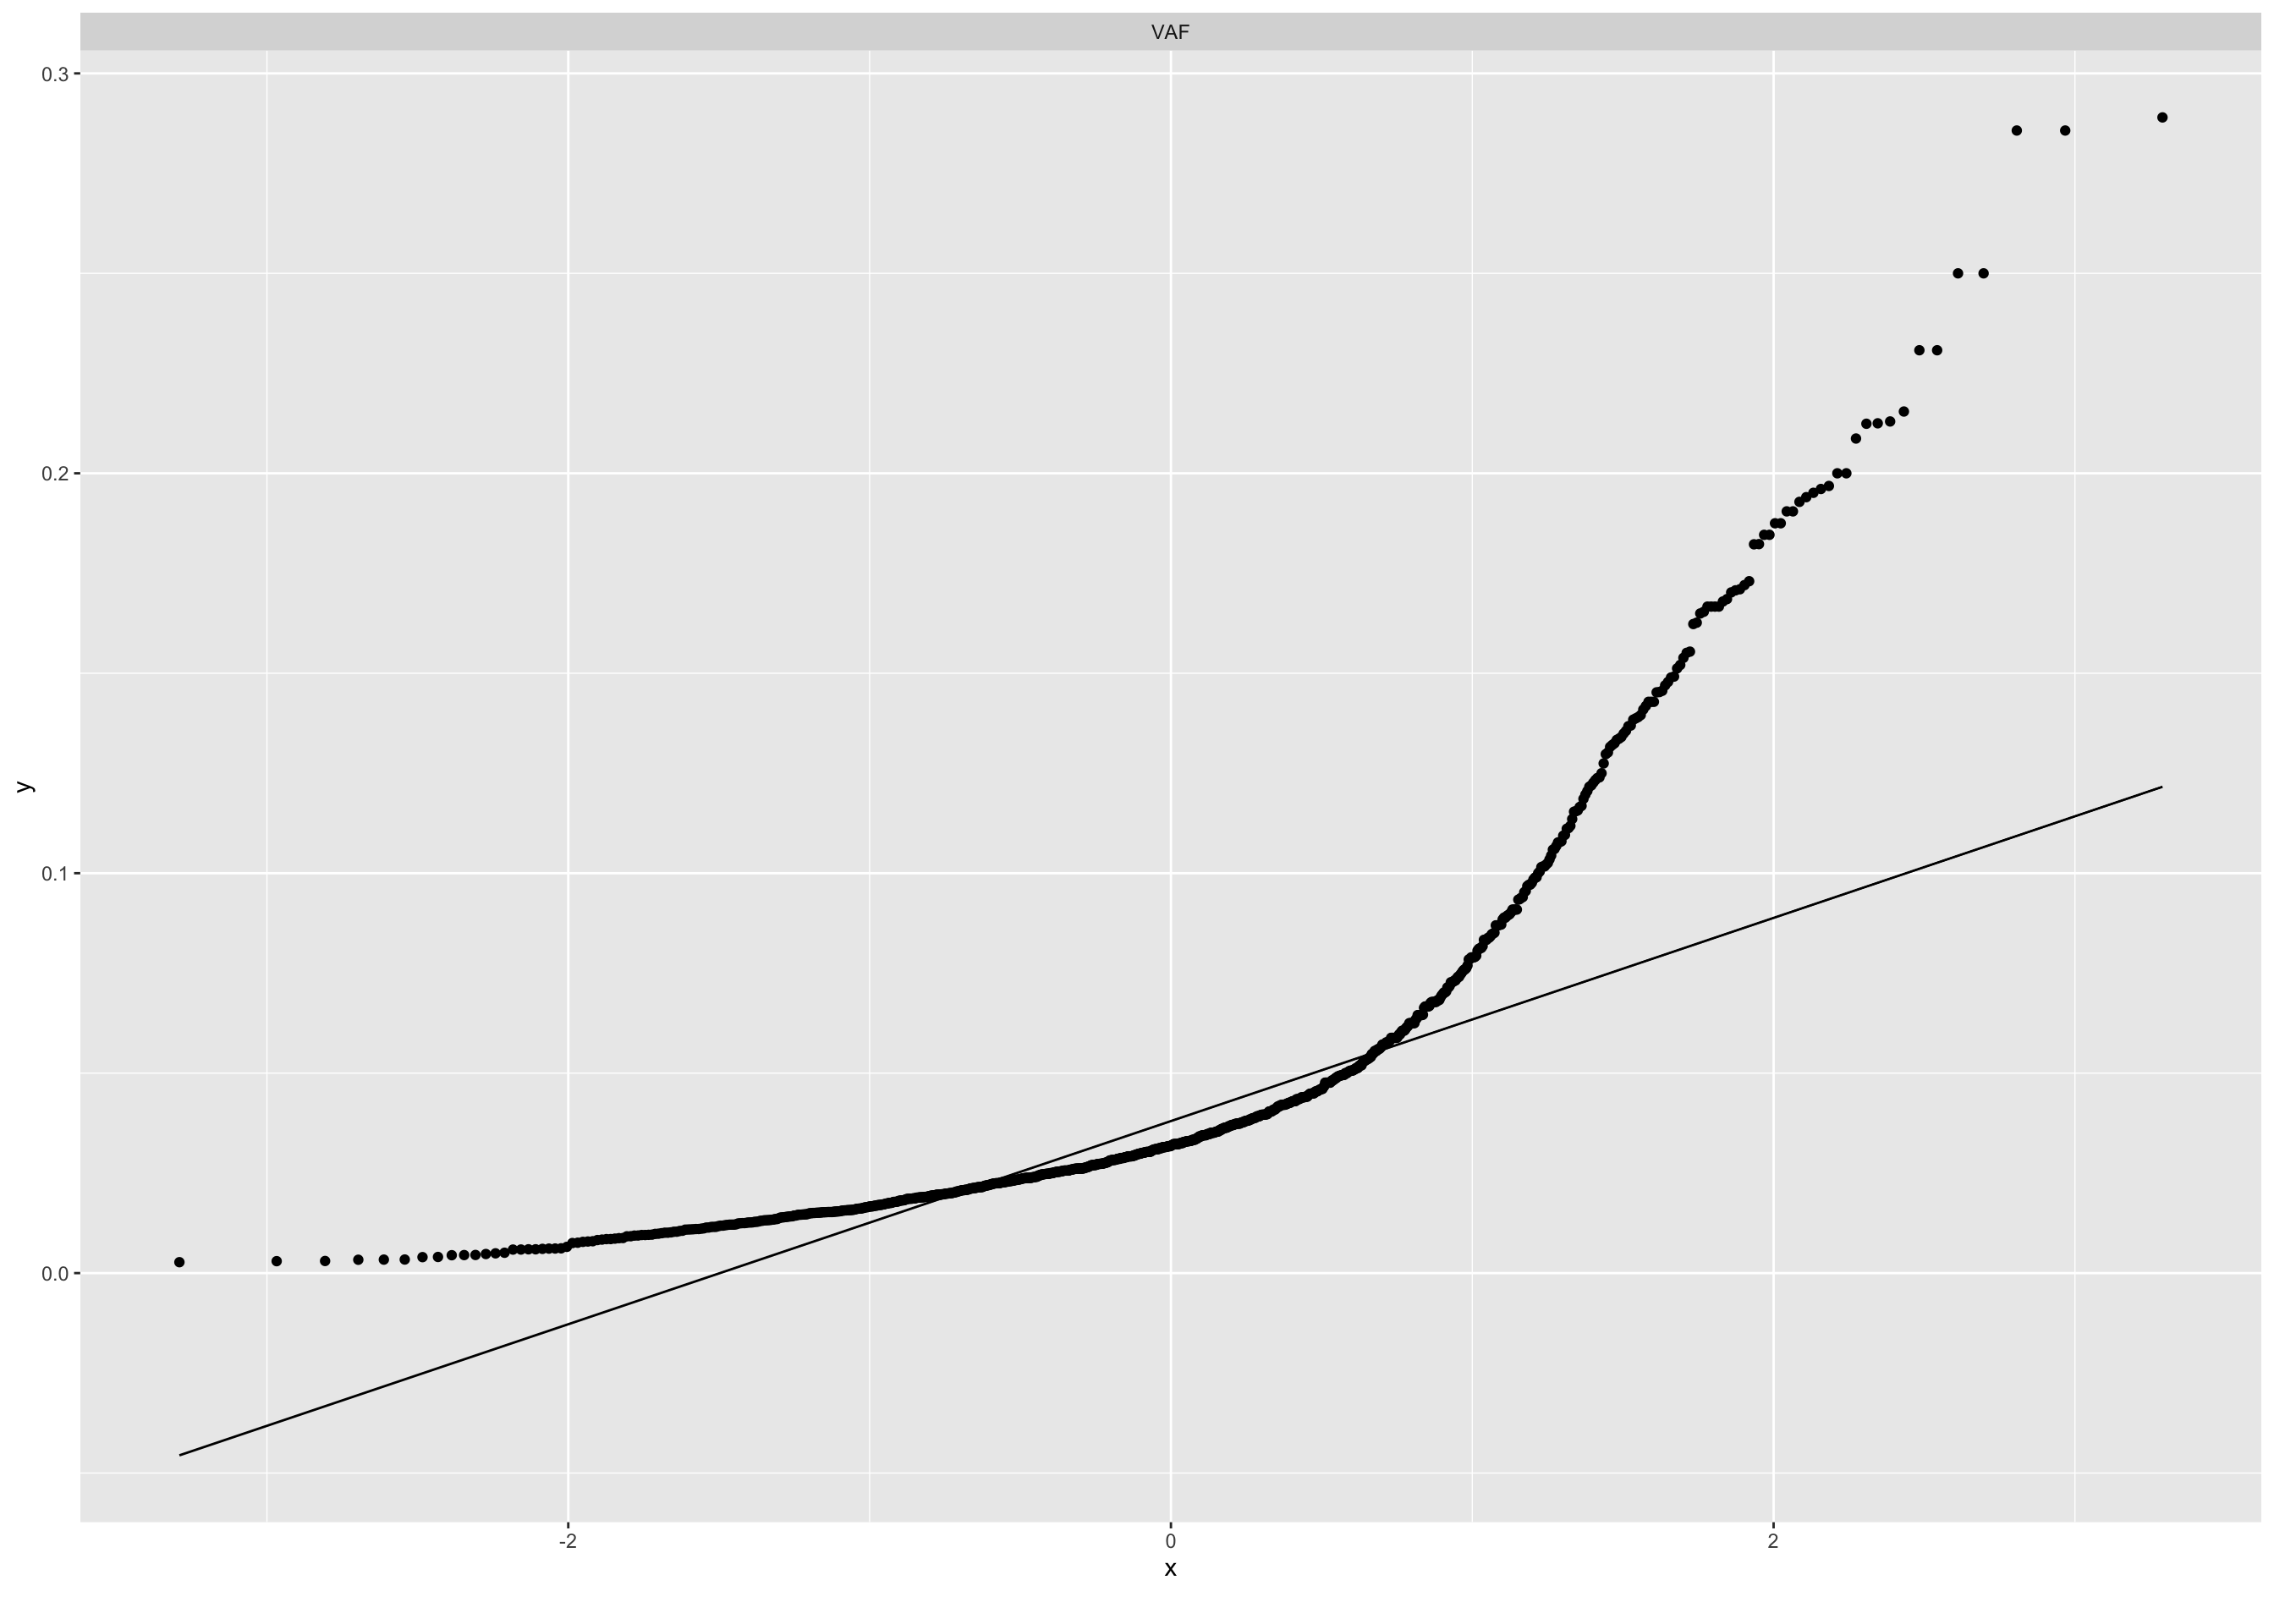
除此之外还有qq plot:

若有收获,就点个赞吧
0 人点赞
