- 1 服务监控
- 2 日志处理
- 3 Actuator 可视化监控
1 服务监控
1.1 Actuator 监控简介
1.1.1 概述
- 从严格意义上讲,SpringBoot 是为微服务而准备的,其中 Actuator 组件是所有项目开发过程中必须掌握的部分,因为 SpringCloud 也是需要通过 Actuator 实现一系列的监控机制。
- 在实际项目开发中,利用微服务可以有效的进行项目结构的拆分,将不同功能的微服务部署到不同的物理主机之中,这样当某一个微服务出现问题时就很难进行准确的定位,所以 SpringBoot 提供了 Actuator 组件来实现每一个微服务的状态监控。
1.1.2 microboot 项目
- 修改 build.gradle 文件,添加 actuator 组件:
project(':microboot-web') { // 设置子项目的配置,独享配置dependencies { // 配置子模块依赖implementation(project(':microboot-common')) // 引入其他子模块// 引入 SpringBoot 的 web 依赖implementation 'org.springframework.boot:spring-boot-starter-web'// 引入 SpringBoot 的 aop 依赖implementation group: 'org.springframework.boot', name: 'spring-boot-starter-aop'// 引入 SpringBoot 的 mail 依赖implementation group: 'org.springframework.boot', name: 'spring-boot-starter-mail'// 引入 SpringBoot 的 validation 依赖implementation group: 'org.springframework.boot', name: 'spring-boot-starter-validation'// 引入 SpringBoot 的 actuator 依赖implementation group: 'org.springframework.boot', name: 'spring-boot-starter-actuator'}gradle.taskGraph.whenReady { // 在所有的操作准备好之后触发tasks.each { task ->if (task.name.contains('javadoc')) { // 如果发现有 javadoc 任务,就跳过task.enabled = false // 当前任务不执行}}}}
1.1.3 microboot-web 子模块
- 正常启动当前的 SpringBoot 应用,可以看到如下的日志:
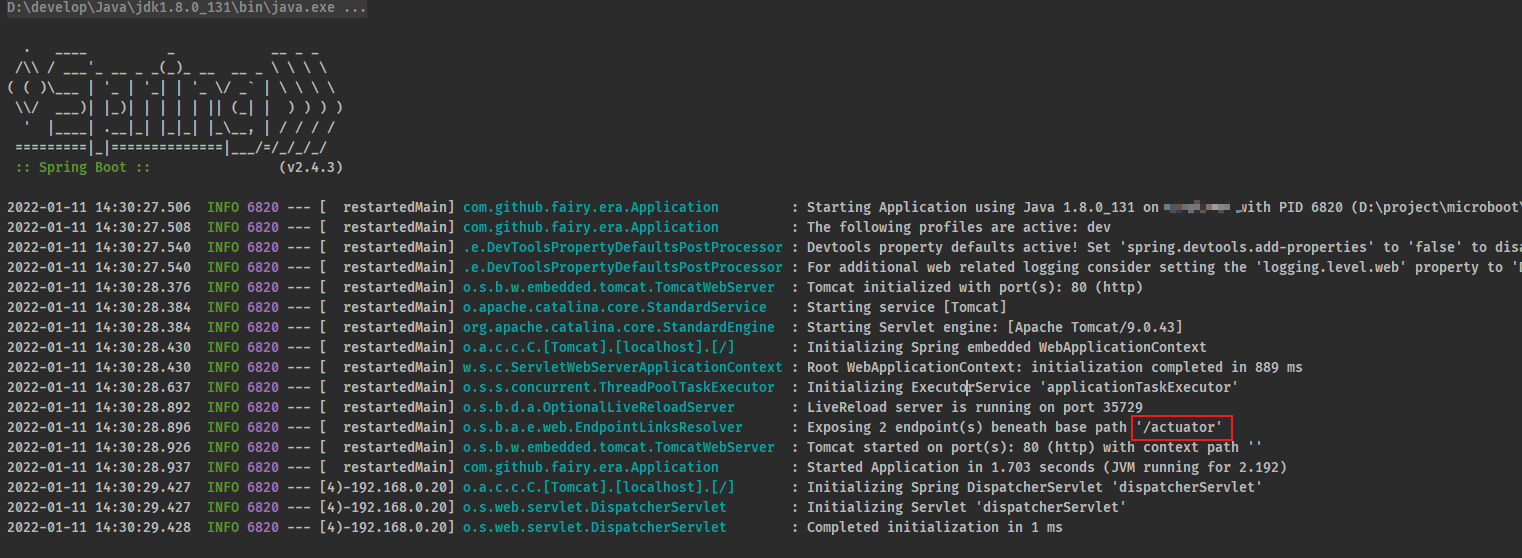
1.1.4 浏览器
- 既然当前项目已经成功启动了,那么就可以通过给定的路径进行页面的访问:
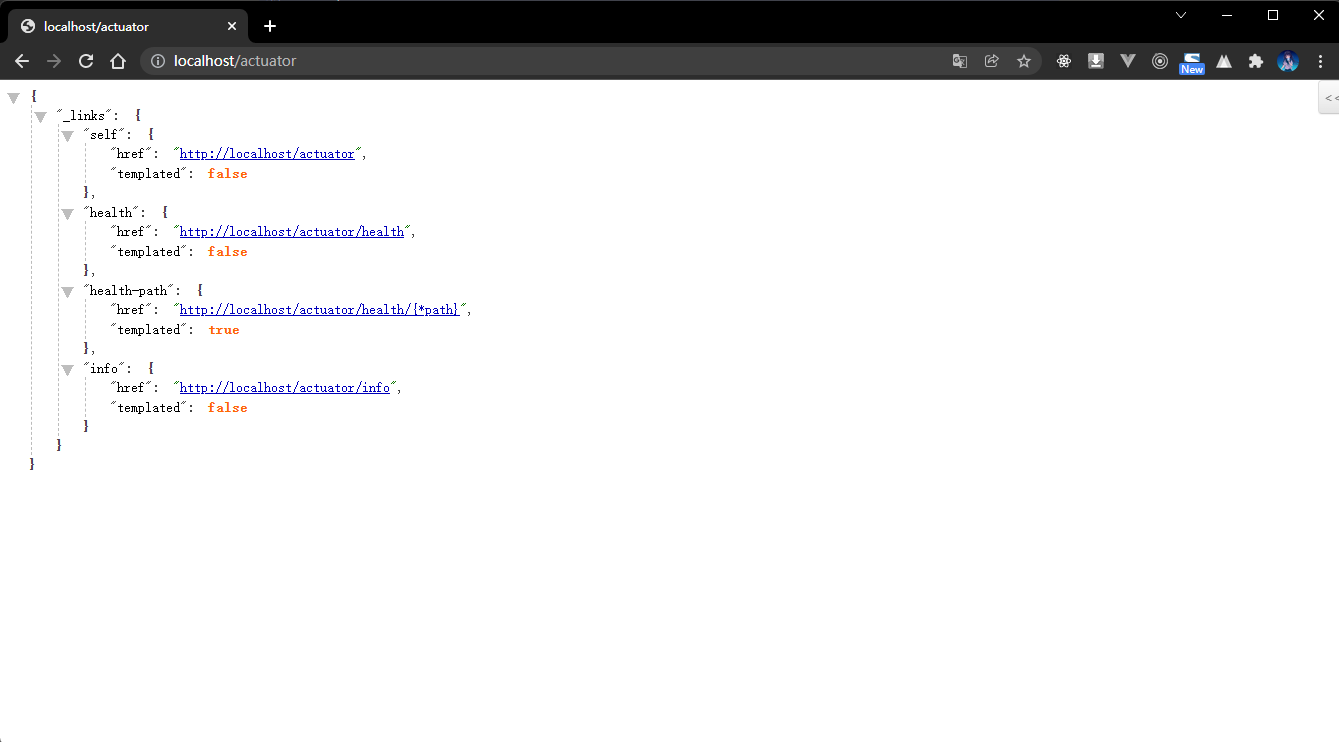
- 输出内容解释:
{"_links": { // 链接"self": {"href": "http://localhost/actuator","templated": false},"health": { // 健康信息(微服务的状态)"href": "http://localhost/actuator/health","templated": false},"health-path": { // 健康信息监控的路径"href": "http://localhost/actuator/health/{*path}","templated": true},"info": { // 微服务的信息"href": "http://localhost/actuator/info","templated": false}}}
1.1.5 浏览器
- 获取微服务的健康状态:

1.1.6 microboot-web 子模块
- 默认情况下虽然可以提供有一系列的监控信息,但是信息的数量是非常少的,因为默认情况下为了安全并没有启动此类的全部数据。
- 如果现在希望可以开启全部的 Actuator 监控,那么就需要修改 application.yml 配置文件:
management:endpoints:web:exposure:include: '*' # 开放全部的微服务监控端口base-path: /actuator # 监控服务的父路径,默认就是 /actuator
1.1.7 浏览器
- 再次访问 Actuator 的路径:
- 内容如下:
{"_links": {"self": {"href": "http://localhost/actuator","templated": false},"beans": { // Spring 容器中的全部的 bean 对象"href": "http://localhost/actuator/beans","templated": false},"caches-cache": { // 缓存的配置"href": "http://localhost/actuator/caches/{cache}","templated": true},"caches": {"href": "http://localhost/actuator/caches","templated": false},"health": {"href": "http://localhost/actuator/health","templated": false},"health-path": {"href": "http://localhost/actuator/health/{*path}","templated": true},"info": {"href": "http://localhost/actuator/info","templated": false},"conditions": {"href": "http://localhost/actuator/conditions","templated": false},"configprops": { // 配置属性"href": "http://localhost/actuator/configprops","templated": false},"env": { // 环境"href": "http://localhost/actuator/env","templated": false},"env-toMatch": {"href": "http://localhost/actuator/env/{toMatch}","templated": true},"loggers": { // 日志"href": "http://localhost/actuator/loggers","templated": false},"loggers-name": {"href": "http://localhost/actuator/loggers/{name}","templated": true},"heapdump": { // 堆内存信息"href": "http://localhost/actuator/heapdump","templated": false},"threaddump": { // 线程信息"href": "http://localhost/actuator/threaddump","templated": false},"metrics-requiredMetricName": {"href": "http://localhost/actuator/metrics/{requiredMetricName}","templated": true},"metrics": { // 衡量指标"href": "http://localhost/actuator/metrics","templated": false},"scheduledtasks": { // 定时任务"href": "http://localhost/actuator/scheduledtasks","templated": false},"mappings": { // 映射路径"href": "http://localhost/actuator/mappings","templated": false}}}
- 整个 SpringBoot 项目里面所有和环境有关的状态都是可以直接进行监控处理的,而这些就是 Actuator 所带来的优势所在了,但是它所能获取到的监控仅仅是某一时刻的监控。
1.2 Actuator 接口访问
1.2.1 概述
- 一旦项目中引入 Actuator 相关的依赖之后,就会自动的启动一些相应的监控接口,这些接口的数据全部都是以 REST 的方式返回的,在之前已经通过分析得到里面的全部接口了:
{"_links": {"self": {"href": "http://localhost/actuator","templated": false},"beans": { // Spring 容器中的全部的 bean 对象"href": "http://localhost/actuator/beans","templated": false},"caches-cache": { // 缓存的配置"href": "http://localhost/actuator/caches/{cache}","templated": true},"caches": {"href": "http://localhost/actuator/caches","templated": false},"health": {"href": "http://localhost/actuator/health","templated": false},"health-path": {"href": "http://localhost/actuator/health/{*path}","templated": true},"info": {"href": "http://localhost/actuator/info","templated": false},"conditions": {"href": "http://localhost/actuator/conditions","templated": false},"configprops": { // 配置属性"href": "http://localhost/actuator/configprops","templated": false},"env": { // 环境"href": "http://localhost/actuator/env","templated": false},"env-toMatch": {"href": "http://localhost/actuator/env/{toMatch}","templated": true},"loggers": { // 日志"href": "http://localhost/actuator/loggers","templated": false},"loggers-name": {"href": "http://localhost/actuator/loggers/{name}","templated": true},"heapdump": { // 堆内存信息"href": "http://localhost/actuator/heapdump","templated": false},"threaddump": { // 线程信息"href": "http://localhost/actuator/threaddump","templated": false},"metrics-requiredMetricName": {"href": "http://localhost/actuator/metrics/{requiredMetricName}","templated": true},"metrics": { // 衡量指标"href": "http://localhost/actuator/metrics","templated": false},"scheduledtasks": { // 定时任务"href": "http://localhost/actuator/scheduledtasks","templated": false},"mappings": { // 映射路径"href": "http://localhost/actuator/mappings","templated": false}}}
- Actuator 的默认终端:
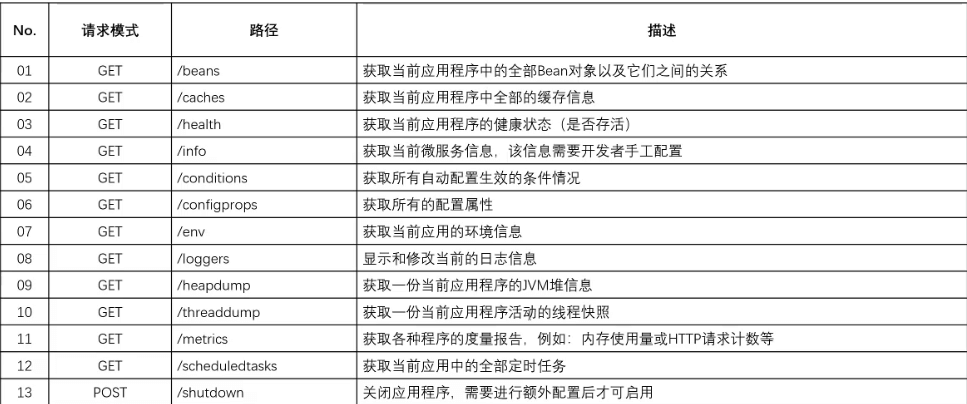
- 我们现在所见到的全部的接口路径并不是直接就能使用的,例如:在之前见到的 info 接口,这个接口并没有提供任务的数据信息,因为该接口需要开发者自己来进行完善。
1.2.2 浏览器
- 访问
/beans接口观察数据信息:

- 信息太多了,以下截取一部分:
"messageServiceImpl": {"aliases": [], // 别名"scope": "singleton", // 默认情况下都采用单例"type": "com.github.fairy.era.service.impl.MessageServiceImpl", // 对应的完整类型"resource": "file [D:\\project\\microboot\\microboot-web\\build\\classes\\java\\main\\com\\github\\fairy\\era\\service\\impl\\MessageServiceImpl.class]","dependencies": [] // 依赖环境(扫描的配置处理)},
"messageHandler": {"aliases": [],"scope": "singleton","type": "com.github.fairy.era.web.MessageHandler$$EnhancerBySpringCGLIB$$dbc79e18","resource": "file [D:\\project\\microboot\\microboot-web\\build\\classes\\java\\main\\com\\github\\fairy\\era\\web\\MessageHandler.class]","dependencies": []},
- SpringBoot 启动之后里面所有可能存在的 Bean 的数据都是可以获取的,利用这些 Bean 数据可以清楚的知道当前系统中存在有哪些实例(默认情况下是基于单例设计模式实现的)。
1.2.3 浏览器
- 访问
/conditions接口观察数据信息:获取所有配置生效的条件

- 信息太多了,以下截取一部分:
"ElasticsearchDataAutoConfiguration": {"notMatched": [{"condition": "OnClassCondition","message": "@ConditionalOnClass did not find required class 'org.springframework.data.elasticsearch.core.ElasticsearchRestTemplate'"}],"matched": []},
"JpaRepositoriesAutoConfiguration": {"notMatched": [{"condition": "OnClassCondition","message": "@ConditionalOnClass did not find required class 'org.springframework.data.jpa.repository.JpaRepository'"}],"matched": []},
1.2.4 浏览器
- 访问
/env接口观察数据信息:获取当前应用的环境信息
- 信息太多了,以下截取一部分:
"activeProfiles": ["dev"],"propertySources": [{"name": "server.ports","properties": {"local.server.port": {"value": 80}}},{"name": "servletContextInitParams","properties": {}},],"management.endpoints.web.base-path": {"value": "/actuator","origin": "class path resource [application.yml] - 21:18"}
- 此时所能够见到的属性的内容有部分是由 JDK 所自带的环境属性,而除了这些属性之外,实际上还存在有一些 SpringBoot 启动的时候自动配置的环境属性。
1.3 heapdump 信息
1.3.1 概述
- SpringBoot 是基于 JVM 进程运行的,所有的对象都是保存在堆内存的,SpringBoot 程序一旦进行了部署,就必须及时的获取相关 SpringBoot 之中的 JVM 堆内存的使用信息。
- 在 SpringBoot 之中,只要引入 Actuator 依赖,就可以直接通过
/heapdump接口获取相关的 JVM 堆内存的使用信息,如果直接访问这个路径,将获取一个完整离线数据。
1.3.2 浏览器
- 获取当前的堆内存信息:
- 获取到的堆内存的数据信息文件内容全部都是二进制的数据信息,这种文件需要特定的工具打开,在 JDK 9之前存在有 visualvm 的工具,在 JDK 9 之后就不再默认提供了,需要额外的下载,下载地址。
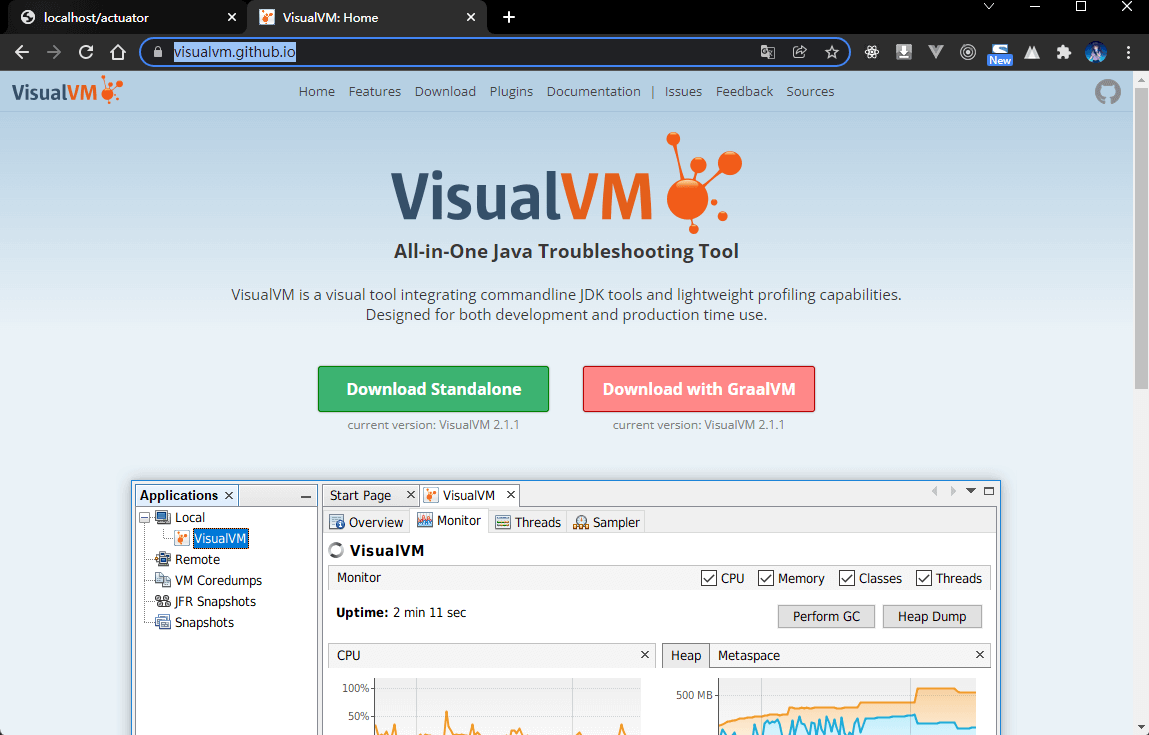
- 使用 visualvm 打开 heapdump 文件:

- 以上的这种监控应该是一种持续监控的装填,比如:采用一些曲线图等进行完整显示,但是这种的处理机制往往需要特定的环境的支持,而这个支持的首要部分就是需要提供有数据接口。
1.4 info 信息
1.4.1 概述
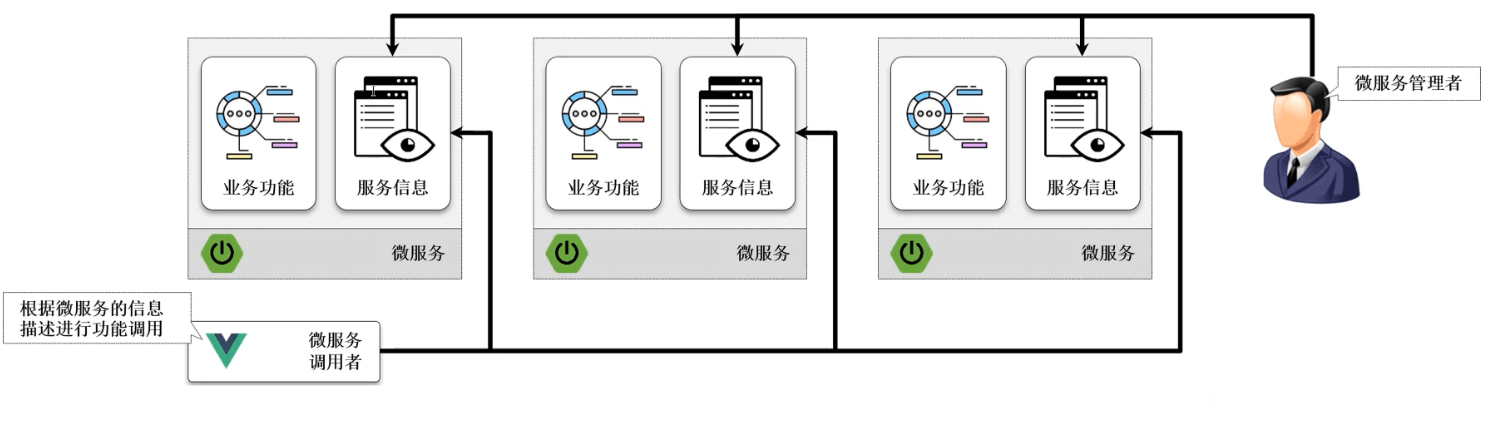
- 在整个的 Actuator 之中对于微服务的数据信息的获取主要依靠的是
/info,实际上通过这个接口可以直接对外公布当前系统中微服务的主要功能,因为在一个完整的微服务项目中会存在有大量的子服务,为了可以明确的告诉使用者每一个微服务的作用,就可以自定义/info微服务信息。
1.4.2 microboot-web 子模块
- 如果要进行微服务信息的配置,则需要修改 application.yml 文件:
# actuatormanagement:endpoints:web:exposure:include: '*' # 开放全部的微服务监控端口base-path: /actuator # 监控服务的父路径,默认就是 /actuator# 配置 infoinfo:app:name: 订单微服务group: com.githubversion: 2.4.3description: 基于 SpringBoot 实现订单微服务author: 许大仙
1.4.3 浏览器
- 访问
/info接口观察数据信息:
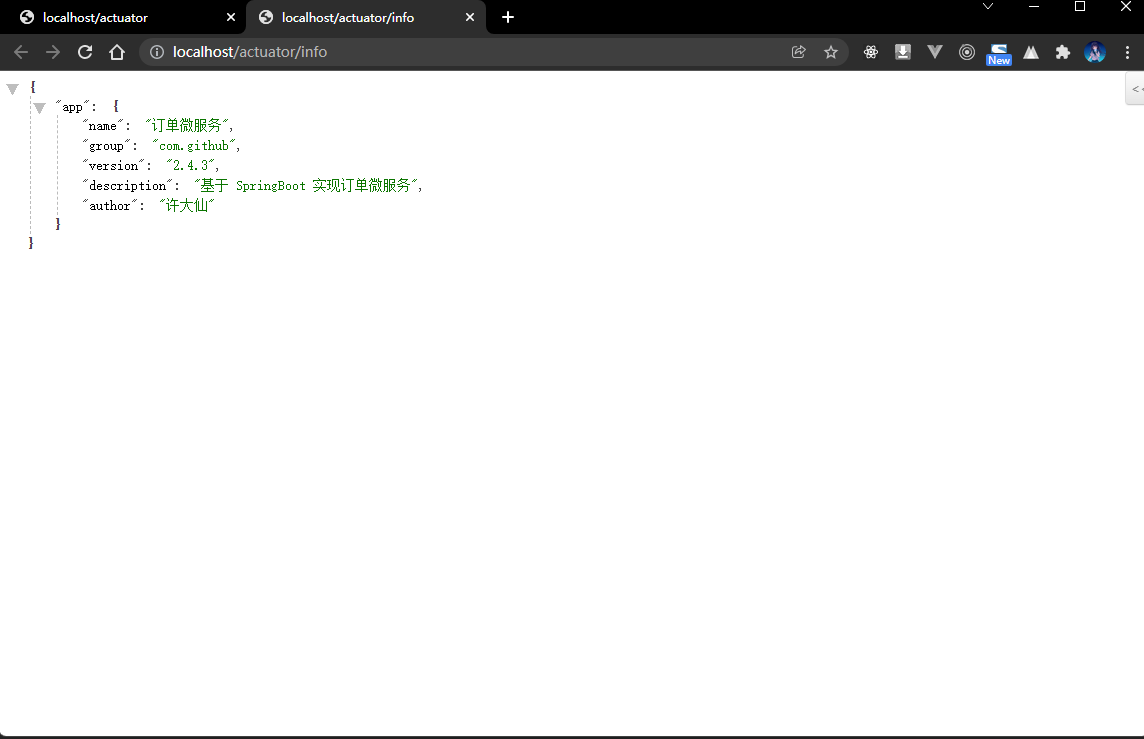
- 最重要的一点就是这个接口的数据可以由开发者自行配置,只需要按照特定的结构完成即可。
1.4.4 microboot-web 子模块
- 如果说现在所有的 info 信息都是通过 application.yml 文件来直接进行配置,如果在实际开发中需要修改的话,就需要重新进行项目的打包、部署,因为所有的配置项都是固定在 application.yml 文件的,最佳的做法是可以通过数据库来进行存储,这样就要有一个特定额程序来实现数据库信息的读取,为了解决这样的问题,SpringBoot 提供了一个专属的 info 创建器。
package com.github.fairy.era.actuator;import org.springframework.boot.actuate.info.Info;import org.springframework.boot.actuate.info.InfoContributor;import org.springframework.stereotype.Component;/*** 自定义 info 构建器** @author 许大仙* @version 1.0* @since 2022-01-11 16:24*/@Componentpublic class MicroServiceInfoContributor implements InfoContributor {@Overridepublic void contribute(Info.Builder builder) {builder.withDetail("company.name", "江苏科技大学");builder.withDetail("company.address", "江苏南京");}}
1.4.5 浏览器
- 访问
/info接口观察数据信息:
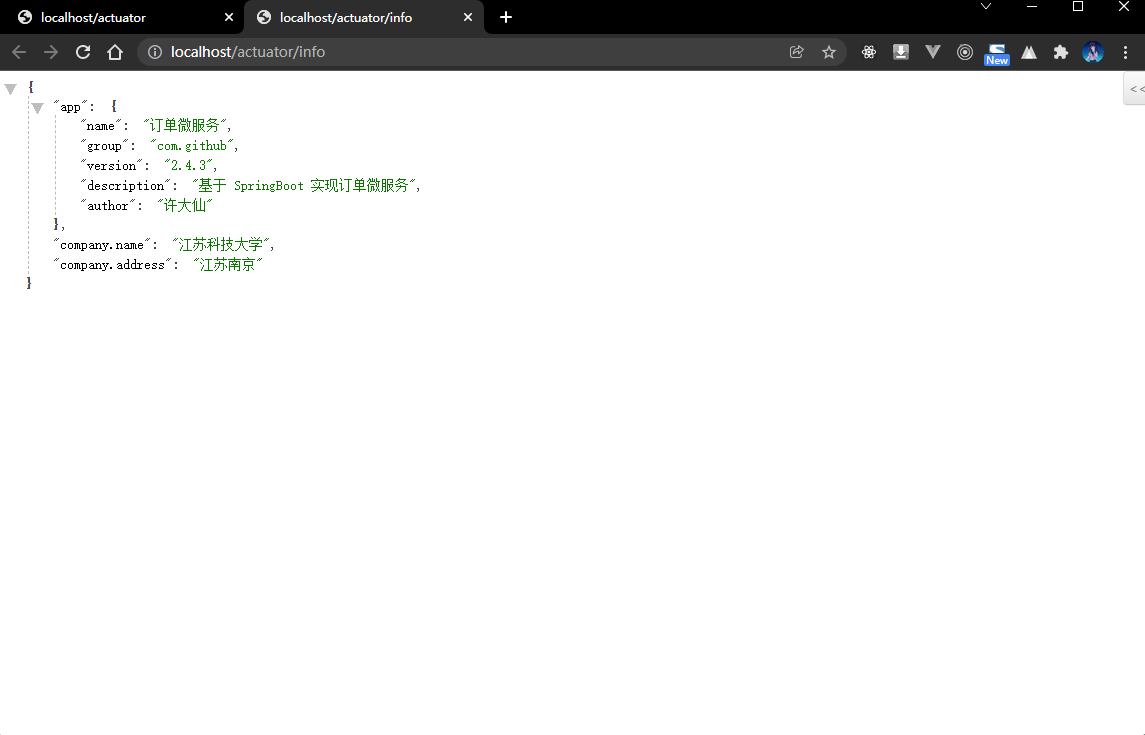
- 此时通过类配置的内容和 application.yml 配置的内容是不冲突的,都是可以直接在 info 中进行显示的。
1.5 health 服务信息
1.5.1 概述
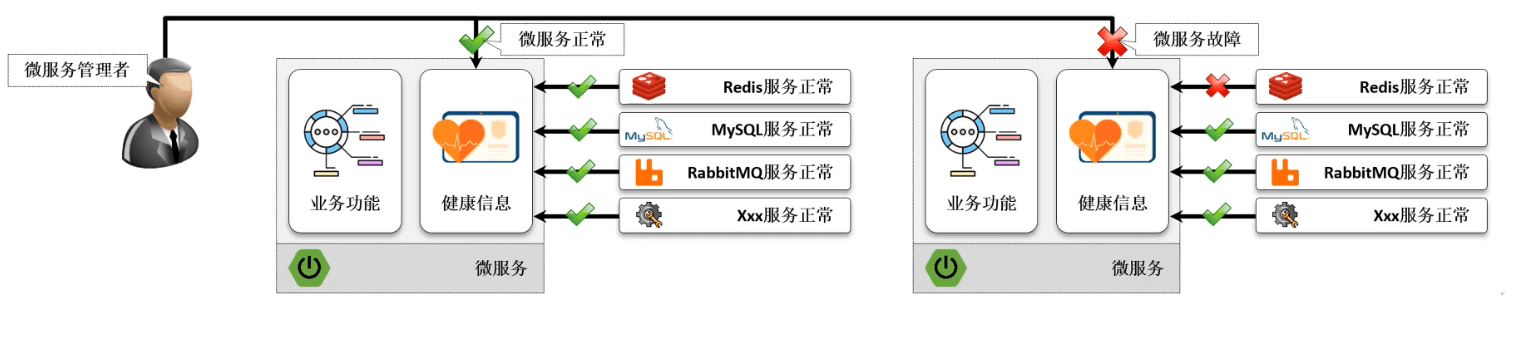
- 如果项目架构中采用的是微服务的处理架构,最终就会造成大量的服务节点的出现,如果需要知道某一个节点的存活状态,就需要进行监控数据的获取,默认情况下如果在没有引入第三方组件的时候,可以获取到的信息一定是处于健康的状态的。
- 如果一个微服务项目中经常会引入大量的其他服务组件,例如:Redis、MySQL、MQ等,实际上这些第三方组件的服务健康也会直接影响到最终的健康状态。
1.5.2 浏览器
- 获取当前的健康状态:

1.5.3 microboot-web 子模块
- 在项目的开发过程中,会不断的引入各种的组件,那么对于健康状态就可能引起问题了,那么就需要动态的获取到这些组件服务的状态信息,从而来判断最终的微服务是否健康。
- 为了便于微服务健康状态的排查,在 SpringBoot 的 Actuator 里面提供有一个健康状态检测的接口标准,该接口定义如下:
package org.springframework.boot.actuate.health;/*** Strategy interface used to contribute {@link Health} to the results returned from the* {@link HealthEndpoint}.**/@FunctionalInterfacepublic interface HealthIndicator extends HealthContributor {/*** Return an indication of health.* @param includeDetails if details should be included or removed* @return the health* @since 2.2.0*/default Health getHealth(boolean includeDetails) {Health health = health();return includeDetails ? health : health.withoutDetails();}/*** Return an indication of health.* @return the health*/Health health();}
- 定义 HealthIndicator 的接口子类,实现微服务状态的监控:
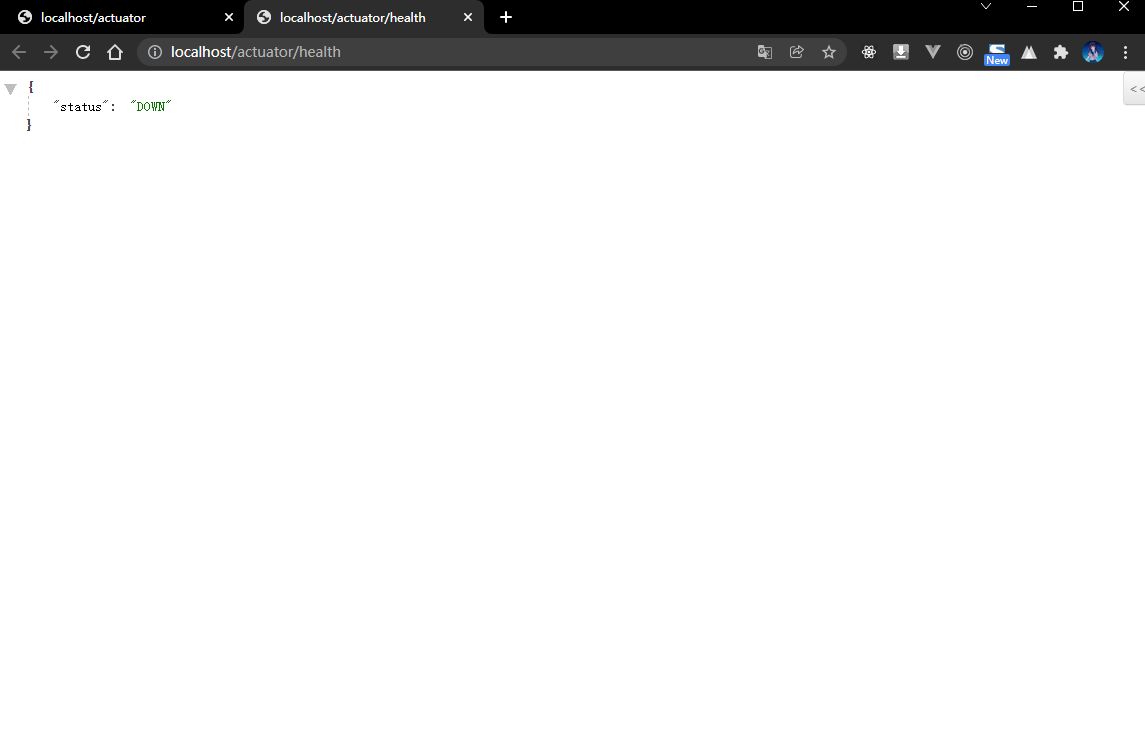
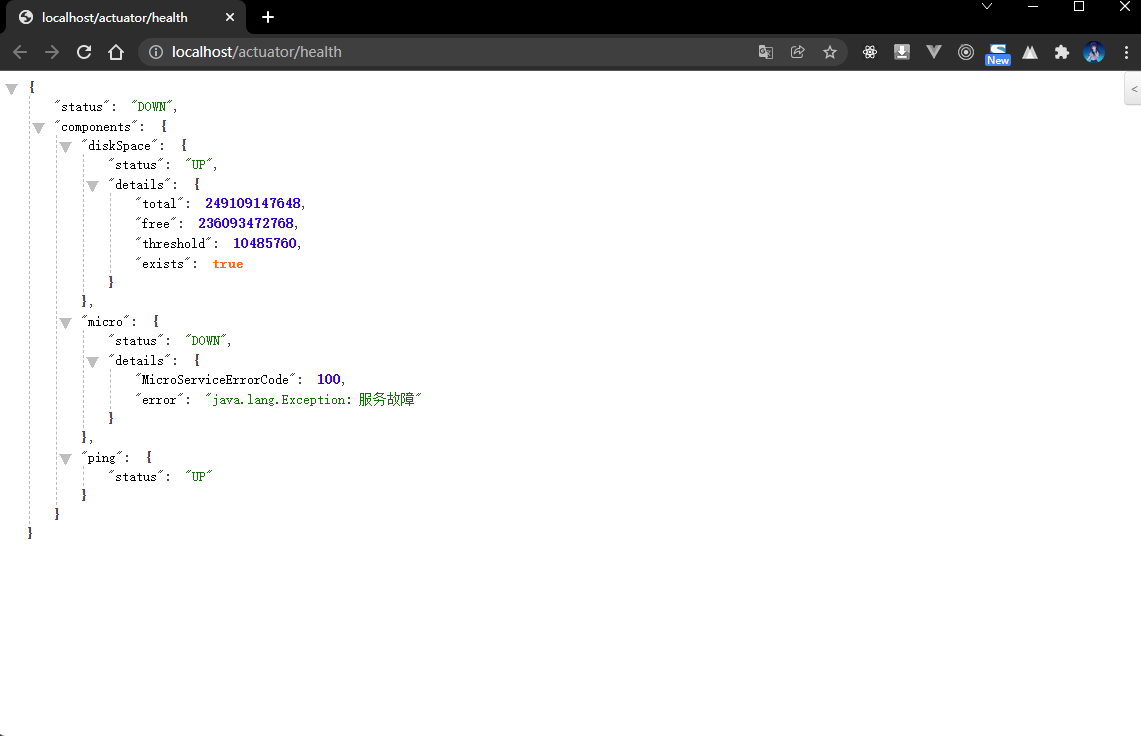
package com.github.fairy.era.actuator;import org.springframework.boot.actuate.health.Health;import org.springframework.boot.actuate.health.HealthIndicator;import org.springframework.stereotype.Component;/*** @author 许大仙* @version 1.0* @since 2022-01-11 16:56*/@Componentpublic class MicroHealthIndicator implements HealthIndicator {/*** 现在是一个独立的 Bean 组件,就可以直接注入其他依赖** @return 返回健康状态*/@Overridepublic Health health() {// 假设存在有一个错误编码int errorCode = 100;// 触发返回错误的条件if (0 != errorCode) {// 当前的微服务不健康return Health.down().withDetail("MicroServiceErrorCode", errorCode).withException(new Exception("服务故障")).build();}// 当期的微服务监控return Health.up().build();}}
- 以后在整合很多组件的时候会遇到很多类似这样结构形式的代码,只不过这些代码都会由各个组件的依赖库提供了,就不需要我们单独来配置。
1.5.4 浏览器
- 获取当前的健康状态:
1.5.5 microboot-web 子模块
- 此时在进行健康数据处理的时候实际上返回有一些数据内容,但是现在却无法显示,因为需要通过 application.yml 来进行配置:
# actuatormanagement:endpoints:web:exposure:include: '*'base-path: /actuatorendpoint:health:enabled: trueshow-details: always # 显示异常信息show-components: always # 显示组件信息
1.5.6 浏览器
- 获取当前的健康状态:
1.6 远程关闭
1.6.1 概述
- 在引入 Actuator 组件之后,会提供有一个专属的端点
/shutdown来远程停止掉微服务。
1.6.2 命令行
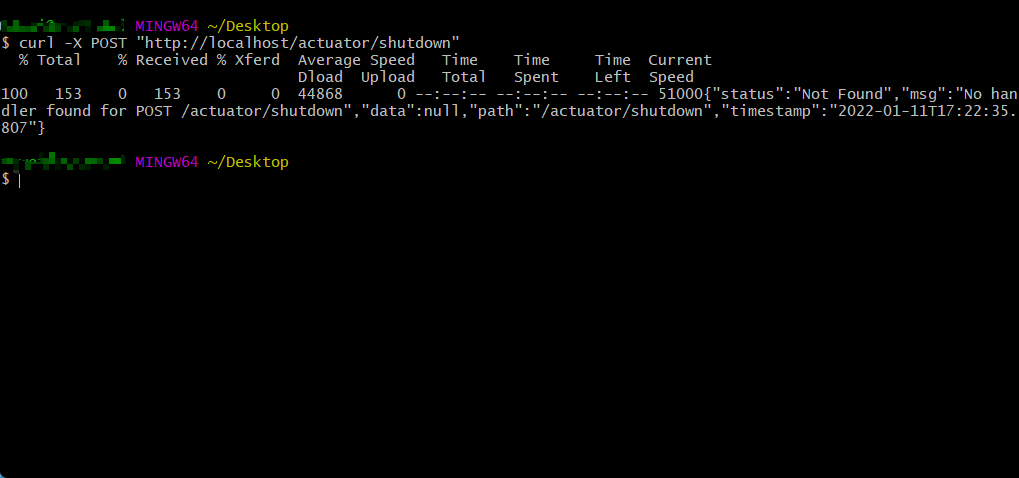
- 本次需要通过 curl 来模拟 POST 请求:
curl -X POST "http://localhost/actuator/shutdown"
- 程序执行结果:
1.6.3 microboot-web 子模块
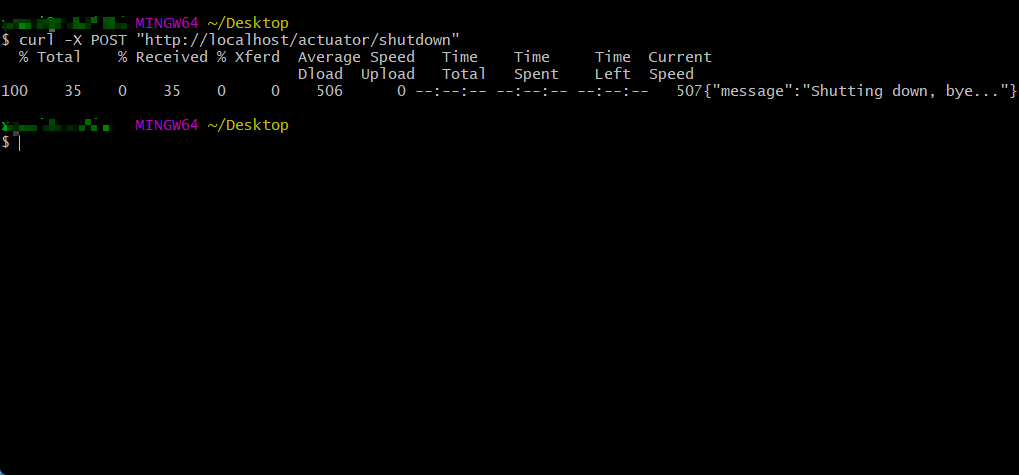
- 默认情况下远程关闭没有开启,需要手动开启,修改 application.yml 配置文件:
# actuatormanagement:endpoints:web:exposure:include: '*'base-path: /actuatorendpoint:health:enabled: trueshow-details: alwaysshow-components: alwaysshutdown:enabled: true # 开启远程关闭
1.6.4 命令行
- 通过 curl 来模拟 POST 请求:
curl -X POST "http://localhost/actuator/shutdown"
- 程序执行结果:
1.7 自定义 EndPoint
1.7.1 概述
- 在引入了 Actuator 组件之后实际上会自动提供有一系列的 endpoint ,但是如果用户有需要也可以根据自己的要求自定义 EndPoint 。
- 如果要想自定义 EndPoint 的处理操作,一般需要通过一个
@EndPoint注解来完成,同时对于具体的数据信息的返回也有如下的三种形式:- ① 【GET 请求】
@ReadOption:可以获取数据。 - ② 【POST 请求】
@WriteOption:向 EndPoint 中写入数据。 - ③ 【Delete 请求】
@DeleteOption:删除 EndPoint 中的数据。
- ① 【GET 请求】
1.7.2 microboot-web 子模块
- 自定义 EndPoint :
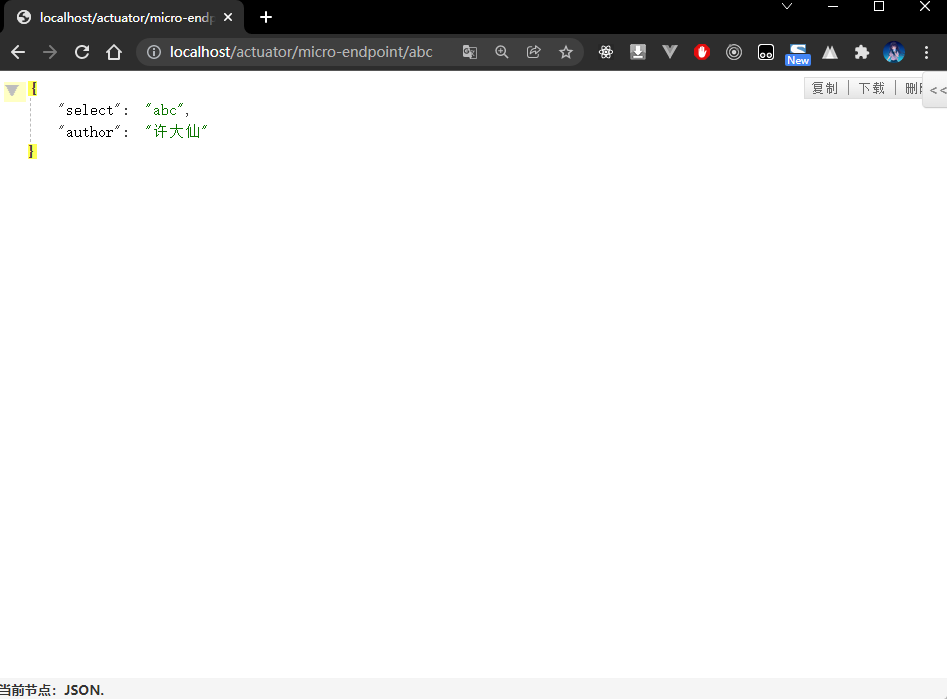
package com.github.fairy.era.actuator;import org.springframework.boot.actuate.endpoint.annotation.Endpoint;import org.springframework.boot.actuate.endpoint.annotation.Selector;import org.springframework.context.annotation.Configuration;import java.util.HashMap;import java.util.Map;/*** @author 许大仙* @since 2022-01-11 21-49*/@Configuration@Endpoint(id = "micro-endpoint")public class MicroEndPoint {/*** @param select 获取一些参数的数据* @return*/public Map<String, Object> endpoint(@Selector String select) {Map<String, Object> result = new HashMap<>(16);result.put("author", "许大仙");result.put("select", select);return result;}}
- applicatoin.yml 中配置端点:
# actuatormanagement:endpoints:web:exposure:include: '*' # 开放全部的微服务监控端口base-path: /actuator # 监控服务的父路径,默认就是 /actuator
1.7.3 浏览器
2 日志处理
2.1 Lombok 日志注解
2.1.1 概述
- 只要使用开发框架,一般都会存在有日志的问题,使用日志可以更加方便的进行问题的定位。
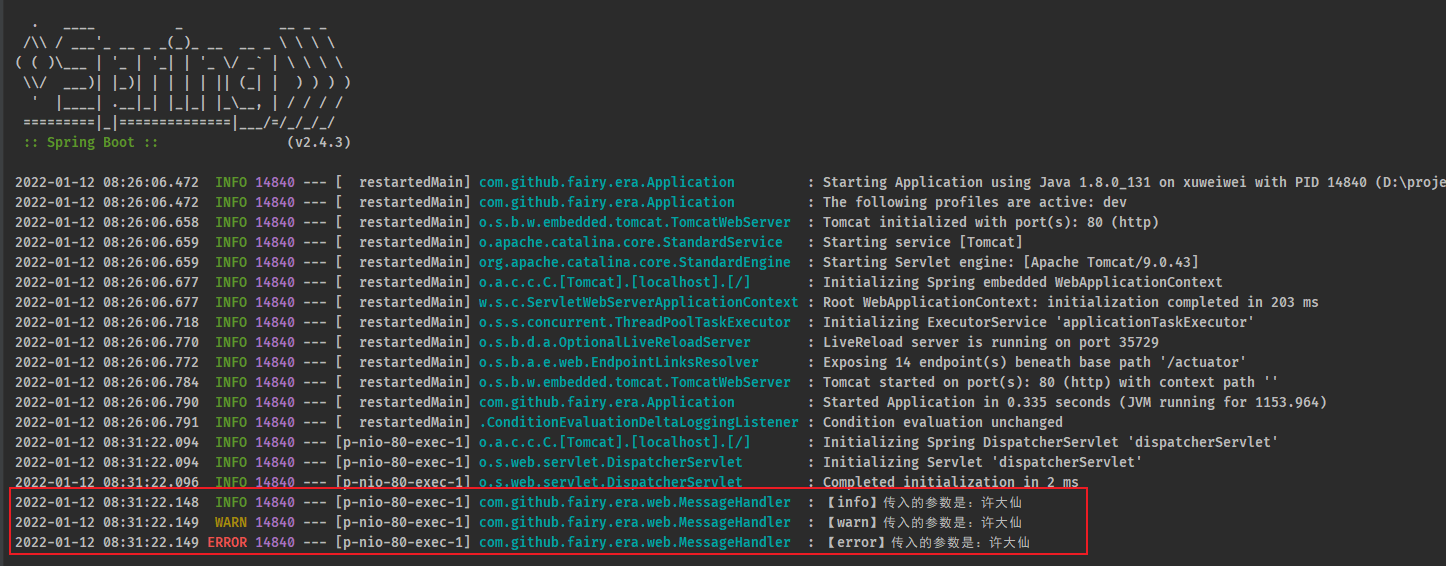
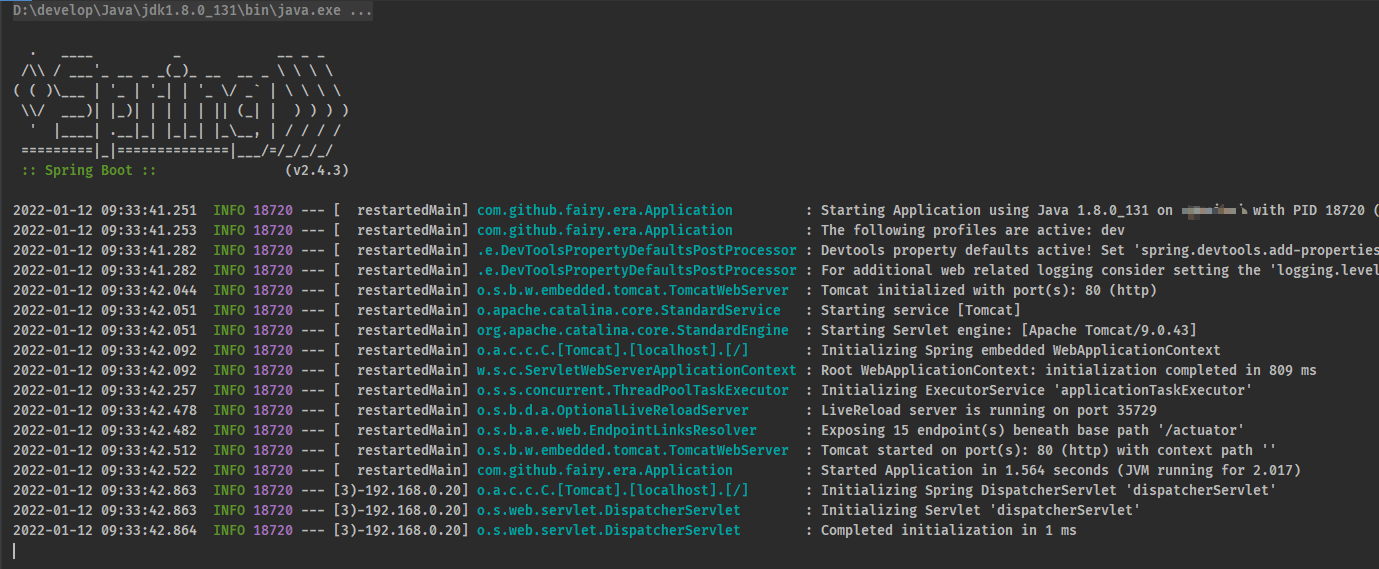
- 对于 SpringBoot 来讲,所有的程序是在启动的时候进行日志的输出的,如下所示:
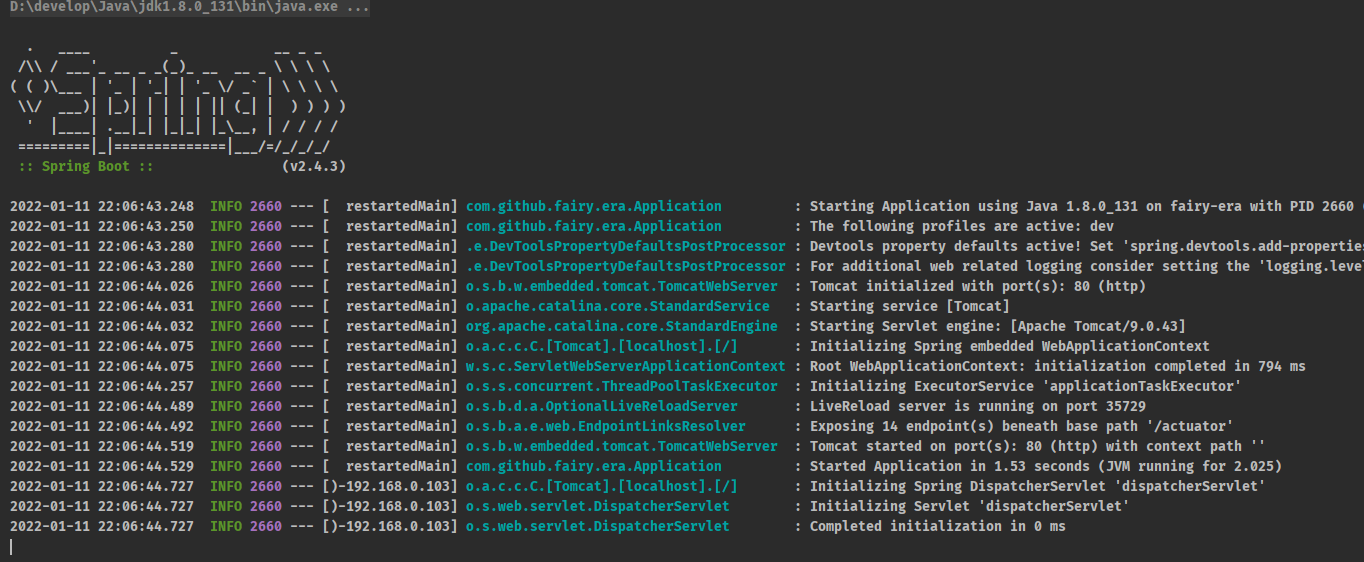
- 以上的日志实际上都是 SpringBoot 内置的系统输出,但是在实际的项目里面也需要针对于业务的处理进行一些日志上的记录,按照传统的方式就需要引入 SLF4j 的门面,以及 Log4j、Logback 等具体的日志实现。
注意:SpringBoot 选择的是 Slf4j + Logback 。
2.1.2 microboot-web 子模块
- 传统的日志处理形式:
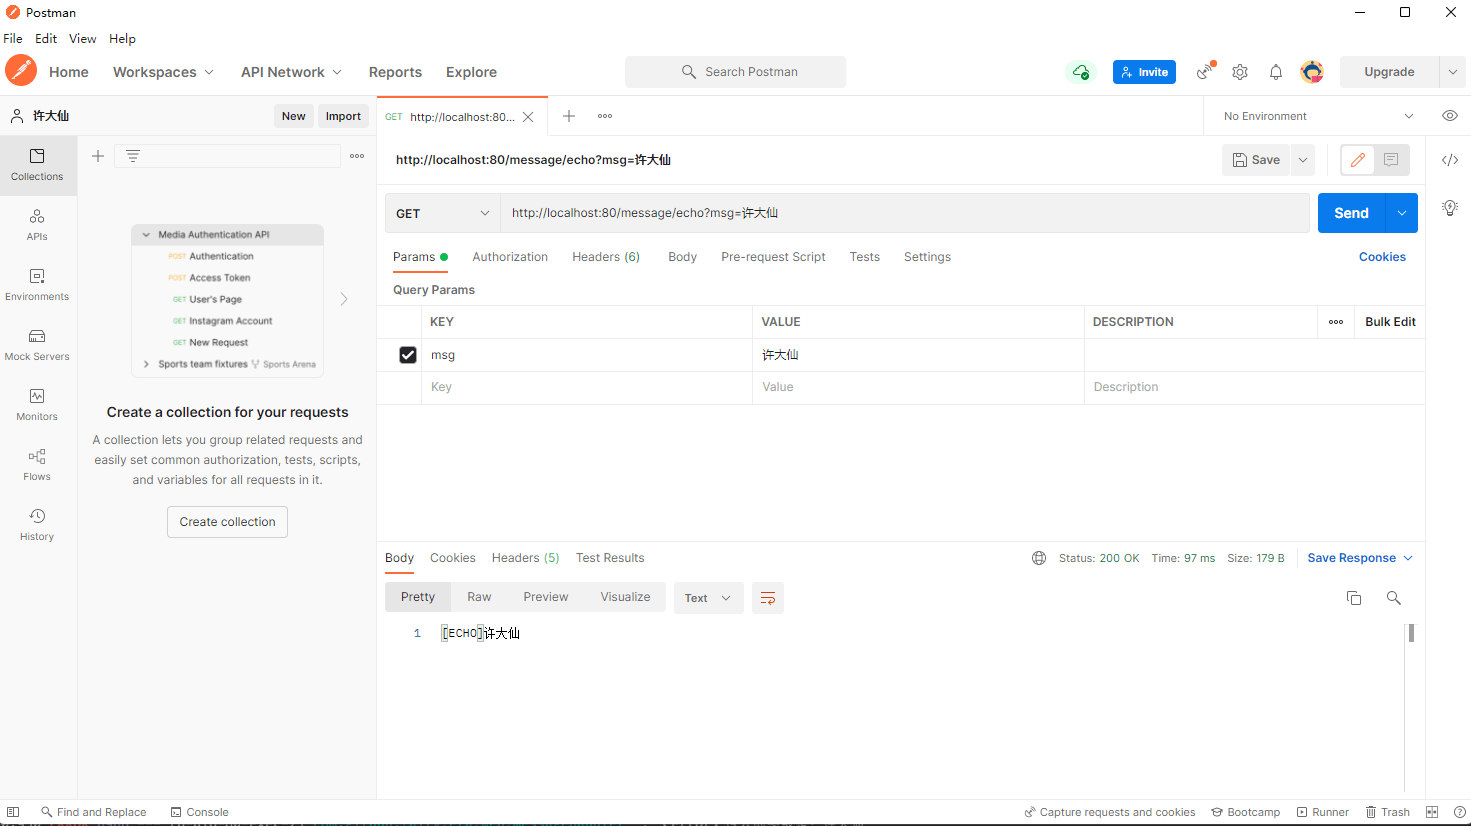
package com.github.fairy.era.web;import org.slf4j.Logger;import org.slf4j.LoggerFactory;import org.springframework.web.bind.annotation.GetMapping;import org.springframework.web.bind.annotation.RequestMapping;import org.springframework.web.bind.annotation.RestController;/*** @author 许大仙* @since 2022-01-09 19-56*/@RestController@RequestMapping(value = "/message")public class MessageHandler {// 获取日志的实例private static final Logger LOGGER = LoggerFactory.getLogger(MessageHandler.class);@GetMapping(value = "/echo")public String echo(String msg) {LOGGER.info("传入的参数是:{}", msg); // 使用 slf4j 的时候,可以使用占位符return "[ECHO]" + msg;}}
- postman 测试接口:
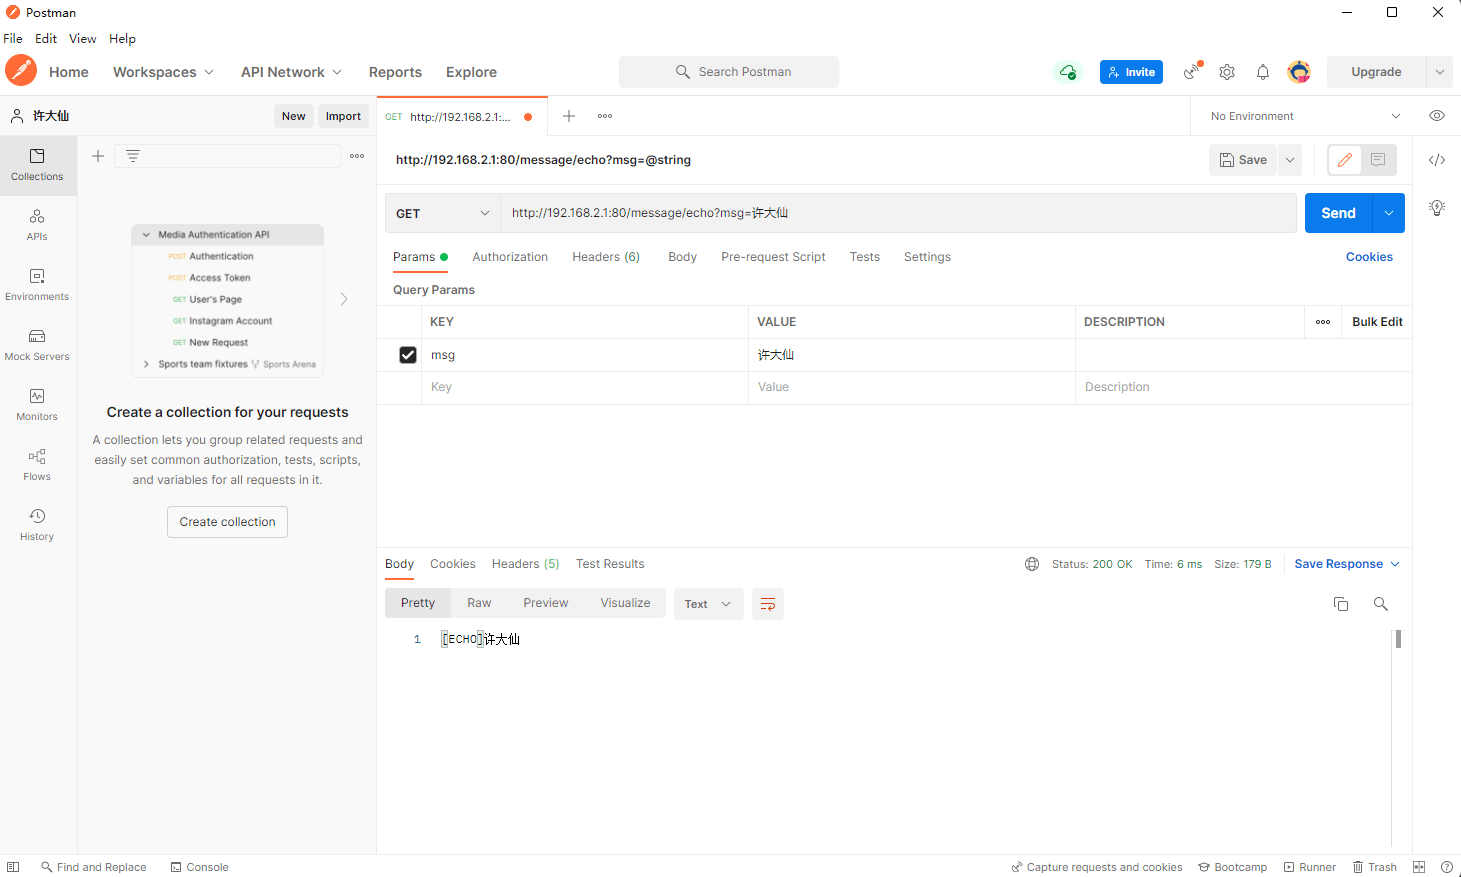
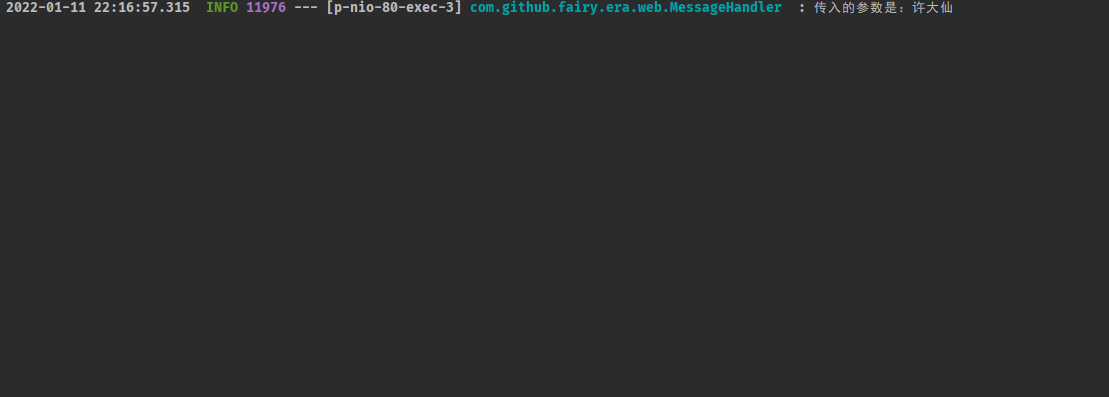
- 后台日志输出:
2.1.3 microboot-web 子模块
- 在传统的处理操作过程中,必须手动的 Logger 接口对象的实例获取,但是这样的操作实在是太麻烦了。
- 本次项目中已经使用了 Lombok 的组件,Lombok 提供了
@Slf4j注解来解决此类问题。
package com.github.fairy.era.web;import lombok.extern.slf4j.Slf4j;import org.springframework.web.bind.annotation.GetMapping;import org.springframework.web.bind.annotation.RequestMapping;import org.springframework.web.bind.annotation.RestController;/*** @author 许大仙* @since 2022-01-09 19-56*/@RestController@RequestMapping(value = "/message")@Slf4j // 当使用了此注解以后,就会在程序中自动出现 log 的日志对象public class MessageHandler {@GetMapping(value = "/echo")public String echo(String msg) {log.info("传入的参数是:{}", msg); // 使用 slf4j 的时候,可以使用占位符return "[ECHO]" + msg;}}
- 那么,以后开发就可以直接利用 Lombok 简化日志的处理。
2.2 SpringBoot 日志配置
2.2.1 概述
- SpringBoot 内置好了所有可能用到的日志组件,所以在 SpringBoot 内部就可以在每次启动的时候直接进行控制台的日志输出了,需要注意的是:在日志开发过程中是存在有若干个不同的级别。
Spring Boot uses Commons Logging for all internal logging but leaves the underlying log implementation open. Default configurations are provided for Java Util Logging, Log4J2, and Logback. In each case, loggers are pre-configured to use console output with optional file output also available.By default, if you use the “Starters”, Logback is used for logging. Appropriate Logback routing is also included to ensure that dependent libraries that use Java Util Logging, Commons Logging, Log4J, or SLF4J all work correctly.
Log Level: ERROR, WARN, INFO, DEBUG, or TRACE.
- 在 SpringBoot 给出的官方文档里面清楚的标记了可能使用到的日志级别,其实常见的 5 个级别是:trace < debug < info < warn < error ,在实际开发中如果要进行日志的记录,建议使用 warn 以及以上的日志级别,否则将导致日志体积过大。
2.2.2 microboot-web 子模块
- 定义一个 Handler ,并实现所有日志级别的数据输出:
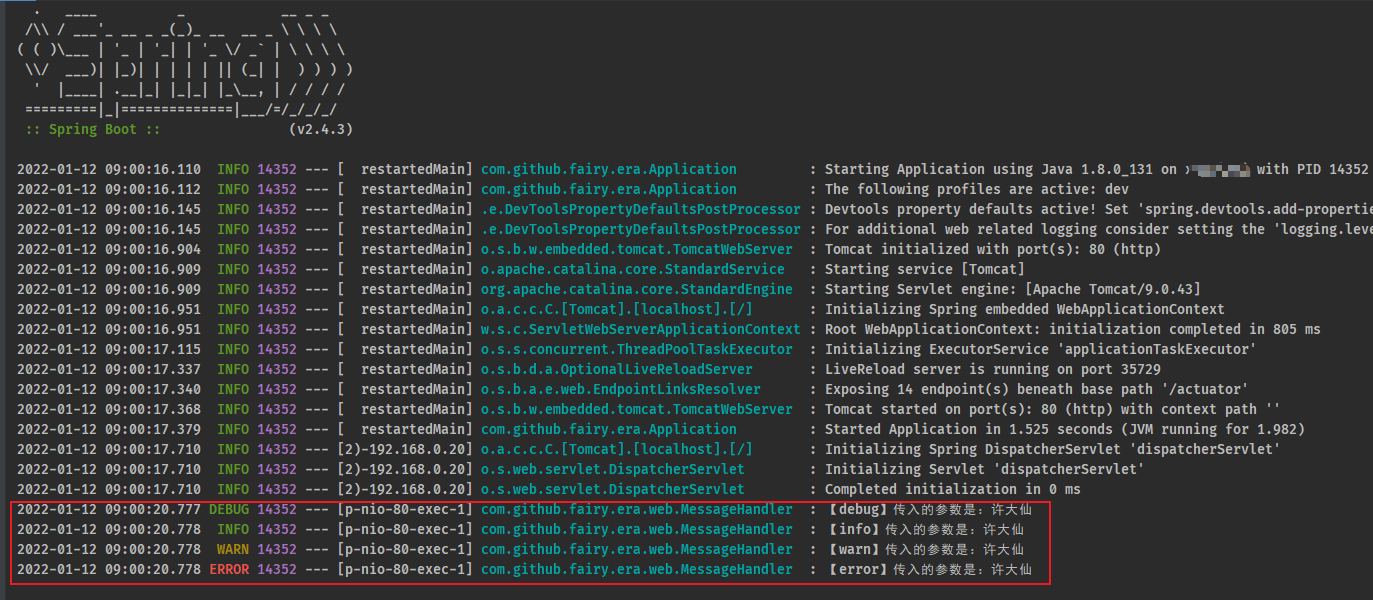
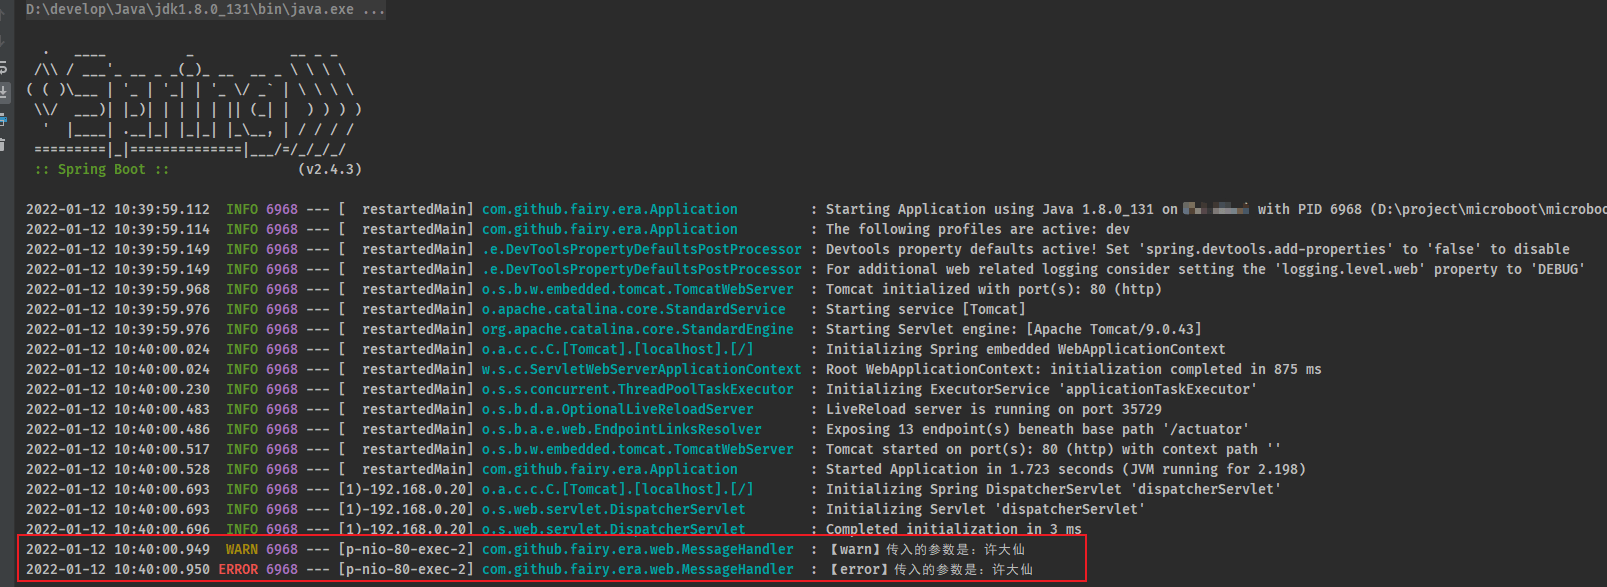
package com.github.fairy.era.web;import lombok.extern.slf4j.Slf4j;import org.springframework.web.bind.annotation.GetMapping;import org.springframework.web.bind.annotation.RequestMapping;import org.springframework.web.bind.annotation.RestController;/*** @author 许大仙* @since 2022-01-09 19-56*/@RestController@RequestMapping(value = "/message")@Slf4jpublic class MessageHandler {@GetMapping(value = "/echo")public String echo(String msg) {log.trace("【trace】传入的参数是:{}", msg);log.debug("【debug】传入的参数是:{}", msg);log.info("【info】传入的参数是:{}", msg);log.warn("【warn】传入的参数是:{}", msg);log.error("【error】传入的参数是:{}", msg);return "[ECHO]" + msg;}}
2.2.3 postman
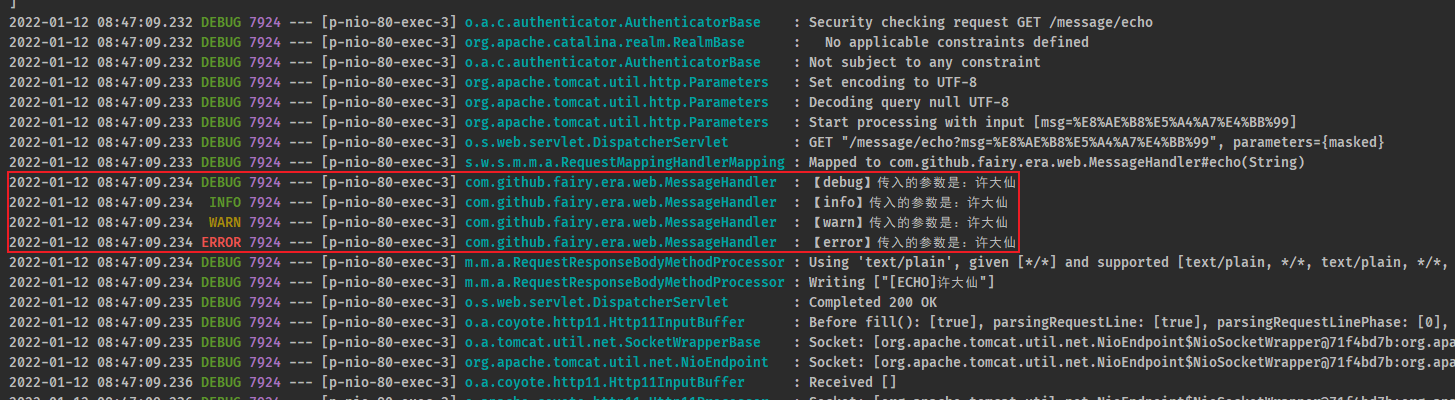
- 通过 postman 对该接口进行测试:
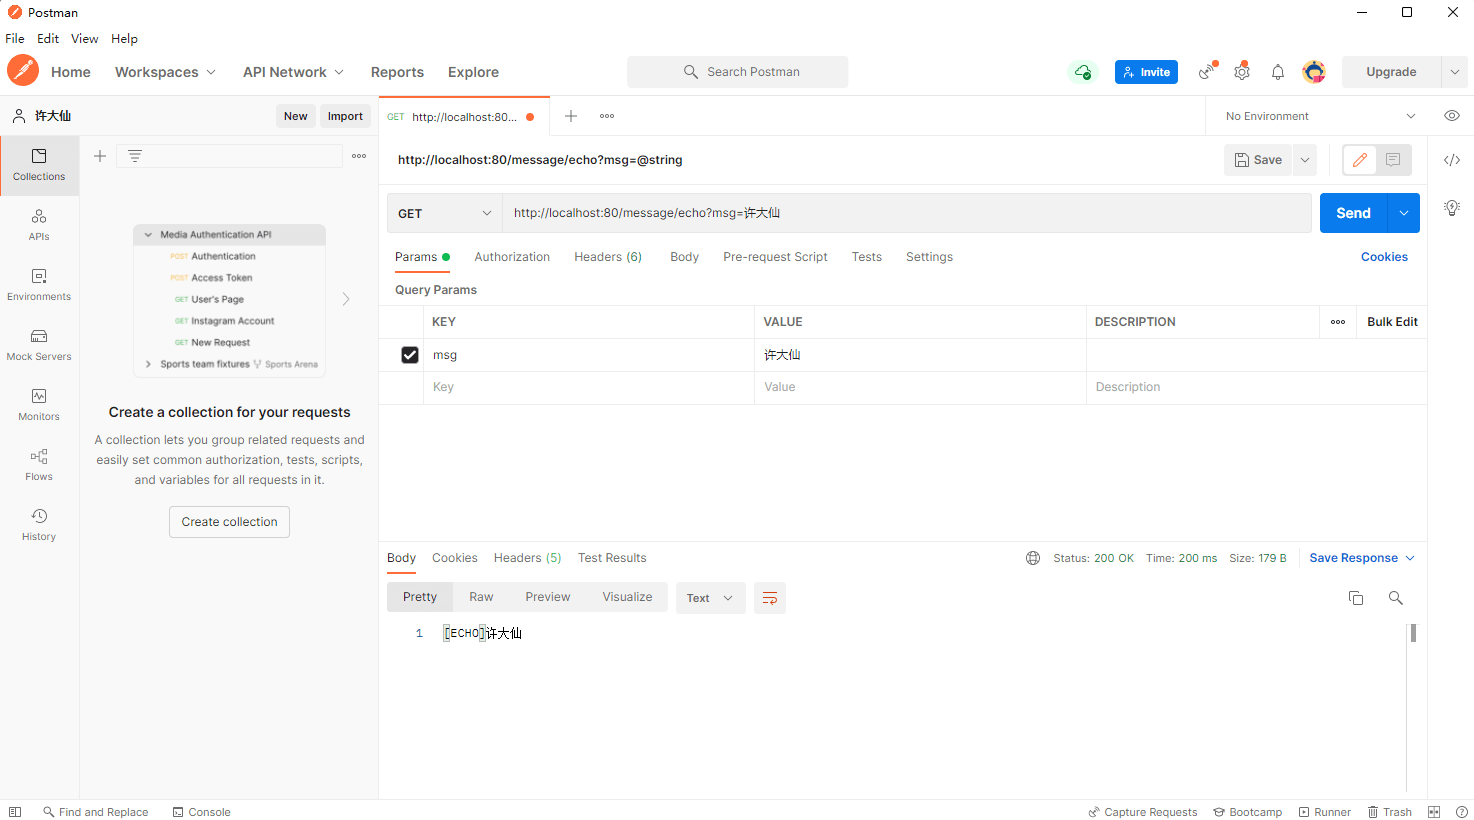
- 控制台输出信息:
- 此时虽然定义有 5 个级别的日志,但是最终可以显示的日志全部都是 info 以及以上级别的日志信息,因为默认情况下 SpringBoot 不会开启 info 级别以下的日志。
2.2.4 microboot-web 子模块
- 修改 application.yml 配置文件,修改日志的级别:
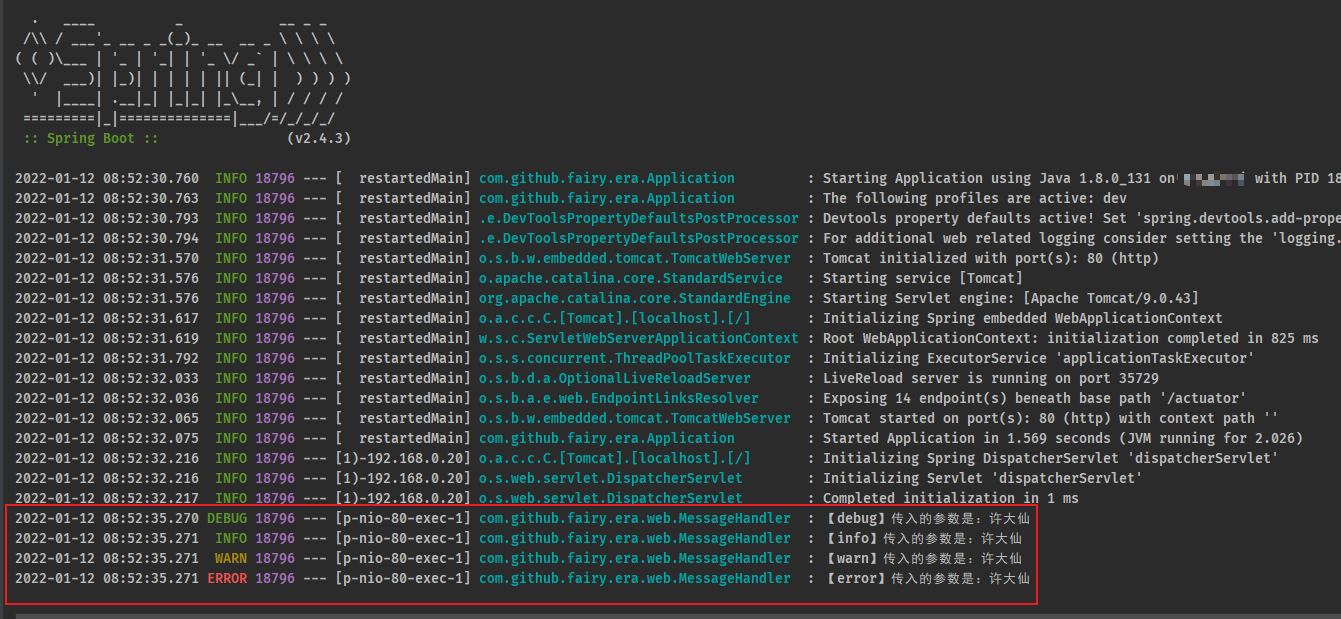
logging:level: # 日志级别root: debug # 设置日志级别,root表示根节点,即整体应用日志级别
- 当前的日志级别修改之后所带的一个明显的问题在于,SpringBoot 启动的时候日志明显增多了。
2.2.5 postman
- 通过 postman 对该接口进行测试,控制台输出信息:
2.2.6 microboot-web 子模块
- 现在为止如果要开启较低级别的日志,就会造成启动日志的庞大激增,如果对于 MessageHandler 类来说又希望进行最全面的日志跟踪,需要怎么做?
- 修改 application.yml 配置文件:
logging:level: # 日志级别root: infocom.github.fairy.era: debug # 设置某个包的日志级别
2.2.7 postman
- 通过 postman 对该接口进行测试,控制台输出信息:
2.2.8 microboot-web 子模块
- 此时,虽然也对 MessageHandler 类进行了全面的日志跟踪,但是又希望只开启 service 或 web 包的日志,那么就需要对日志进行分组。
- 修改 application.yml 配置文件:
logging:group: # 日志分组message: # 自定义组名,设置当前组中包含的包- com.github.fairy.era.web- com.github.fairy.era.servicelevel: # 日志级别root: infomessage: debug # 设置分组的日志级别
2.2.9 postman
- 通过 postman 对该接口进行测试,控制台输出信息:
2.2.7 microboot-web 子模块
- 日志已经能够记录了,但是目前记录的格式是SpringBoot给我们提供的,如果想自定义控制就需要自己设置了。先分析一下当前日志的记录格式。
- 对于单条日志信息来说,日期,触发位置,记录信息是最核心的信息。级别用于做筛选过滤,PID与线程名用于做精准分析。了解这些信息后就可以DIY日志格式了。
- 修改 application.yml 配置文件:
logging:level:root: infopattern:file: "%d{yyyy-MM-dd HH:mm:ss} [%thread] %-5level [%logger] %msg%n" # 文件格式console: "%d{yyyy-MM-dd HH:mm:ss} [%thread] %-5level [%logger] %msg%n" # 控制台格式
2.2.8 microboot-web 子模块
- 日志不能仅显示在控制台上,要把日志记录到文件中,方便后期维护查阅。
- 对于日志文件的使用存在各种各样的策略,例如每日记录,分类记录,报警后记录等。这里主要研究日志文件如何记录。
- 将日志存储到文件中格式非常简单,设置日志文件名即可。
logging:group:message:- com.github.fairy.era.web- com.github.fairy.era.servicelevel: # 日志级别root: infomessage: debug # 设置分组的日志级别file: # 日志文件name: server.log # 默认为 spring.logpath: micro-logs # 日志保存路径
- 虽然使用上述格式可以将日志记录下来了,但是面对线上的复杂情况,一个文件记录肯定是不能够满足运维要求的,通常会每天记录日志文件,同时为了便于维护,还要限制每个日志文件的大小。下面给出日志文件的常用配置方式:
logging:group:message:- com.github.fairy.era.web- com.github.fairy.era.servicelevel:root: infomessage: debugfile: # 日志文件name: server.log # 默认为 spring.logpath: micro-logs # 日志保存路径logback:rollingpolicy: # 日志的滚动策略max-file-size: 3KBfile-name-pattern: server.%d{yyyy-MM-dd}.%i.logmax-history: 365 # 删除超过365天的日志文件
- 以上格式是基于 logback 日志技术设置每日日志文件的设置格式,要求容量到达 3KB 以后就转存信息到第二个文件中。文件命名规则中的
%d标识日期,%i是一个递增变量,用于区分日志文件。
2.3 整合 Logback 日志配置文件
2.3.1 概述
- 通过 SpringBoot 提供的 application.yml 配置文件可以实现日志管理配置,可以由开发者自定义日志的输出结构,以及日志的保存文件,但是如果我只想在日志文件中保存 warn 级别的日志,就无能为力了。
- 如果要想在 SpringBoot 中整合 Logback 组件,就需要提供有 Logback 的日志文件,默认是需要使用 logback-spring.xml 命名的,当然也支持修改。
2.3.2 microboot-web 子模块
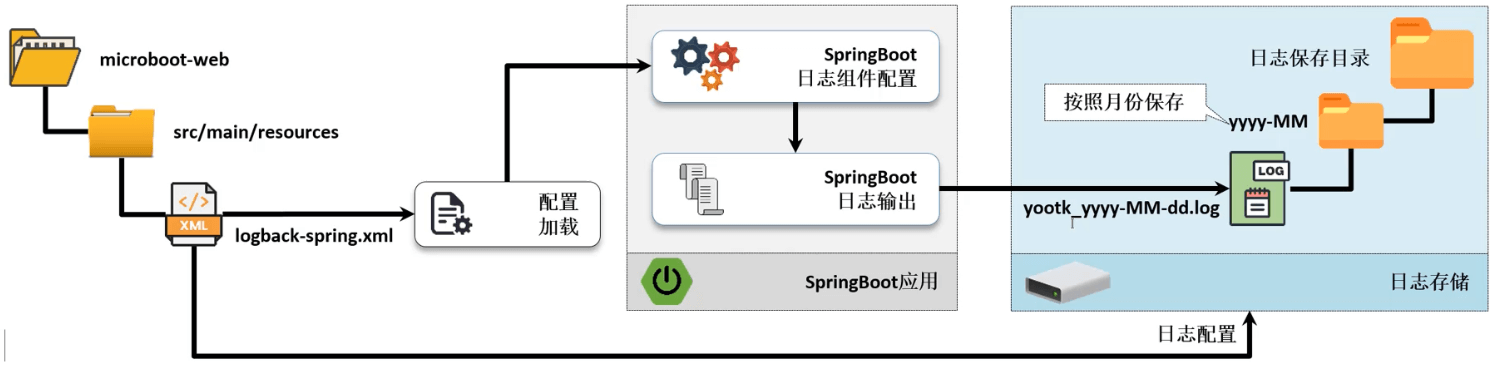
- 在 src/main/resources 目录下创建 logback-spring.xml 配置文件,内容如下:
<?xml version="1.0" encoding="UTF-8"?><configuration scan="true" scanPeriod="60 seconds" debug="false"><contextName>logback</contextName><!-- 定义控制台输出匹配格式 --><substitutionProperty name="logging.pattern.console"value="%clr(%d{${LOG_DATEFORMAT_PATTERN:-yyyy-MM-dd HH:mm:ss.SSS}}){faint} %clr(${LOG_LEVEL_PATTERN:-%5p}) %clr([%X{requestId}]) %clr(${PID:- }){magenta} %clr(---){faint} %clr([%15.15t]){faint} %clr(%-40.40logger{39}){cyan} %clr(:){faint} %m%n${LOG_EXCEPTION_CONVERSION_WORD:-%ewtpc}"/><!-- 定义日志文件输出匹配格式 --><substitutionProperty name="logging.pattern.file"value="%d{${LOG_DATEFORMAT_PATTERN:-yyyy-MM-dd HH:mm:ss.SSS}} ${LOG_LEVEL_PATTERN:-%5p} %clr([%X{requestId}]) ${PID:- } --- [%t] %-40.40logger{39} : %m%n${LOG_EXCEPTION_CONVERSION_WORD:-%ewtpc}"/><conversionRule conversionWord="clr" converterClass="org.springframework.boot.logging.logback.ColorConverter"/><conversionRule conversionWord="wtpc"converterClass="org.springframework.boot.logging.logback.WhitespaceThrowableProxyConverter"/><conversionRule conversionWord="ewtpc"converterClass="org.springframework.boot.logging.logback.ExtendedWhitespaceThrowableProxyConverter"/><appender name="console" class="ch.qos.logback.core.ConsoleAppender"> <!-- 控制台输出 --><layout class="ch.qos.logback.classic.PatternLayout"> <!-- 使用layout节点 --><pattern>${logging.pattern.console}</pattern> <!-- 格式引用 --></layout></appender><!-- 将每天的日志保存在一个文件之中 --><appender name="file" class="ch.qos.logback.core.rolling.RollingFileAppender"><Prudent>true</Prudent><rollingPolicy class="ch.qos.logback.core.rolling.TimeBasedRollingPolicy"><!-- 设置日志保存路径,本次按照月份创建日志目录,而后每天的文件归档到一组 --><FileNamePattern>micro-logs/%d{yyyy-MM}/micro_%d{yyyy-MM-dd}.log</FileNamePattern><MaxHistory>365</MaxHistory><!-- 删除超过365天的日志文件 --></rollingPolicy><filter class="ch.qos.logback.classic.filter.ThresholdFilter"><level>ERROR</level> <!-- 保存ERROR及以上级别的日志 --></filter><encoder><Pattern>${logging.pattern.file}</Pattern> <!-- 格式引用 --></encoder></appender><root level="INFO"> <!-- 全局日志级别 --><appender-ref ref="console"/><appender-ref ref="file"/></root></configuration>
2.4 动态修改日志级别
2.4.1 概述
- 如果在进行系统日志配置的时候,配置的日志级别过低,会造成日志文件攀升的问题;但是如果日志的级别过高,很多开发的问题又不太容易发现。比如:开发的系统在生产环境中运行,突然发现了问题,但是查看半天的日志却没有发现问题的根源,那么最佳的做法就是降低日志级别。
- 如果要想进行日志级别的调整,常规的做法就是进行项目中日志级别的修改,随后重新打包、上传、进行项目的部署,而后等待这个错误的再一次出现(某些错误可能只在极为特殊的环境下才能发生),所以在这样的生产环境的要求下,就希望程序可以自动的实现日志级别的调整,比如:原始是 error 的级别,现在希望降低为 info 或 debug 级别。
- 从 SpringBoot 1.5 开始,开发者就可以直接通过 Actuator 组件实现日志级别的动态调整。
2.4.2 microboot 项目
- 必须在项目中引入 Actuator 组件的相关依赖:
project(':microboot-web') { // 设置子项目的配置,独享配置dependencies { // 配置子模块依赖implementation(project(':microboot-common')) // 引入其他子模块// 引入 SpringBoot 的 web 依赖implementation 'org.springframework.boot:spring-boot-starter-web'// 引入 SpringBoot 的 actuator 依赖implementation group: 'org.springframework.boot', name: 'spring-boot-starter-actuator'}gradle.taskGraph.whenReady { // 在所有的操作准备好之后触发tasks.each { task ->if (task.name.contains('javadoc')) { // 如果发现有 javadoc 任务,就跳过task.enabled = false // 当前任务不执行}}}}
2.4.3 microboot-web 子模块
- 修改 application.yml 配置文件,进行 Actuator 的启用,以及日志级别的配置:
# actuatormanagement:# server:# port: 9090 # 指定 Actuator 的端口endpoints:web:exposure:include: '*' # 开放全部的微服务监控端口base-path: /actuator # 监控服务的父路径,默认就是 /actuatorendpoint:health:enabled: trueshow-details: always # 显示异常信息show-components: always # 显示组件信息# 日志logging:level: # 日志级别root: infocom.github.fairy.era.web: warn
2.4.4 postman
- 通过 postman 进行接口的测试:
- 控制台输出信息:
2.4.5 浏览器
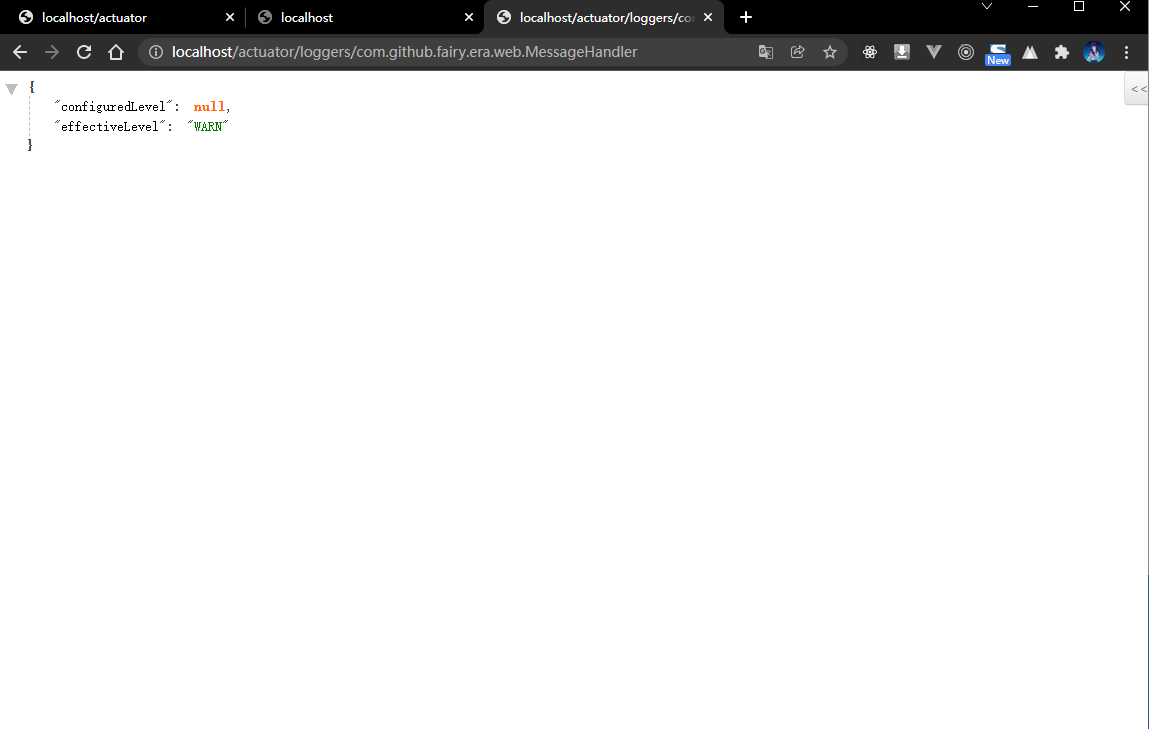
- 一旦在项目中引入了 Actuator 组件之后就可以根据监控路径获取到完整的日志信息。
2.4.6 命令行
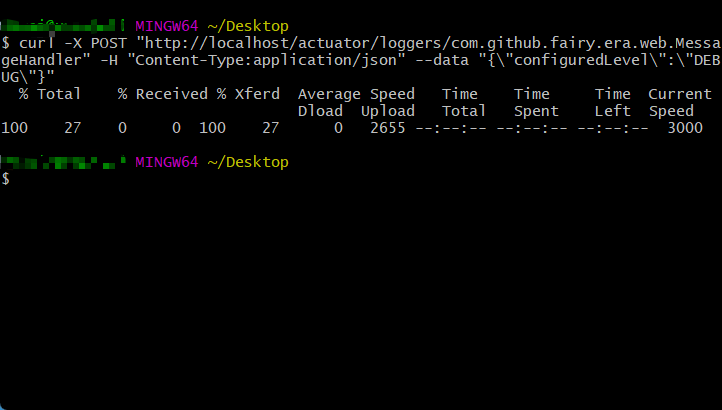
- 如果要想进行日志等级的调整,需要通过 Actuator 提供的接口进行操作。
curl -X POST "http://localhost/actuator/loggers/com.github.fairy.era.web.MessageHandler" -H "Content-Type:application/json" --data "{\"configuredLevel\":\"DEBUG\"}"
2.4.7 浏览器
- 再次通过浏览器查看日志的等级:

2.5 MDC 全链路追踪
2.5.1 问题引入
- 在之前已经完整的实现了一个日志的处理操作,那么按照正常的程序逻辑来讲,需要在各个层(web、service、dao等)进行日志的输出,这样当出现问题的时候就能进行准备的排查了,下面先按照最原始的方式进行各个层的日志管理。
2.5.2 microboot-web 子模块
- 在业务层进行日志的记录:
package com.github.fairy.era.service;/*** @author 许大仙* @since 2022-01-03 07-06*/public interface IMessageService {/*** echo** @param msg* @return*/String echo(String msg);}
package com.github.fairy.era.service.impl;import org.springframework.stereotype.Service;import com.github.fairy.era.service.IMessageService;import lombok.extern.slf4j.Slf4j;/*** @author 许大仙* @since 2022-01-03 07-52*/@Service@Slf4jpublic class MessageServiceImpl implements IMessageService {@Overridepublic String echo(String msg) {log.info("消息回应消息处理,传递的消息参数是:msg = {}", msg);return "【ECHO】" + msg;}}
- 在 web 层进行业务对象的注入:
package com.github.fairy.era.web;import org.springframework.web.bind.annotation.GetMapping;import org.springframework.web.bind.annotation.RequestMapping;import org.springframework.web.bind.annotation.RestController;import com.github.fairy.era.service.IMessageService;import lombok.NonNull;import lombok.RequiredArgsConstructor;import lombok.extern.slf4j.Slf4j;/*** @author 许大仙* @since 2022-01-09 19-56*/@Slf4j@RestController@RequiredArgsConstructor@RequestMapping(value = "/message")public class MessageHandler {@NonNullprivate IMessageService messageService;@GetMapping(value = "/echo")public String echo(String msg) {log.info("web 层接收到用户的请求,请求参数为:msg = {}", msg);return this.messageService.echo(msg);}}
2.5.3 postman
- 通过 postman 进行接口的测试:
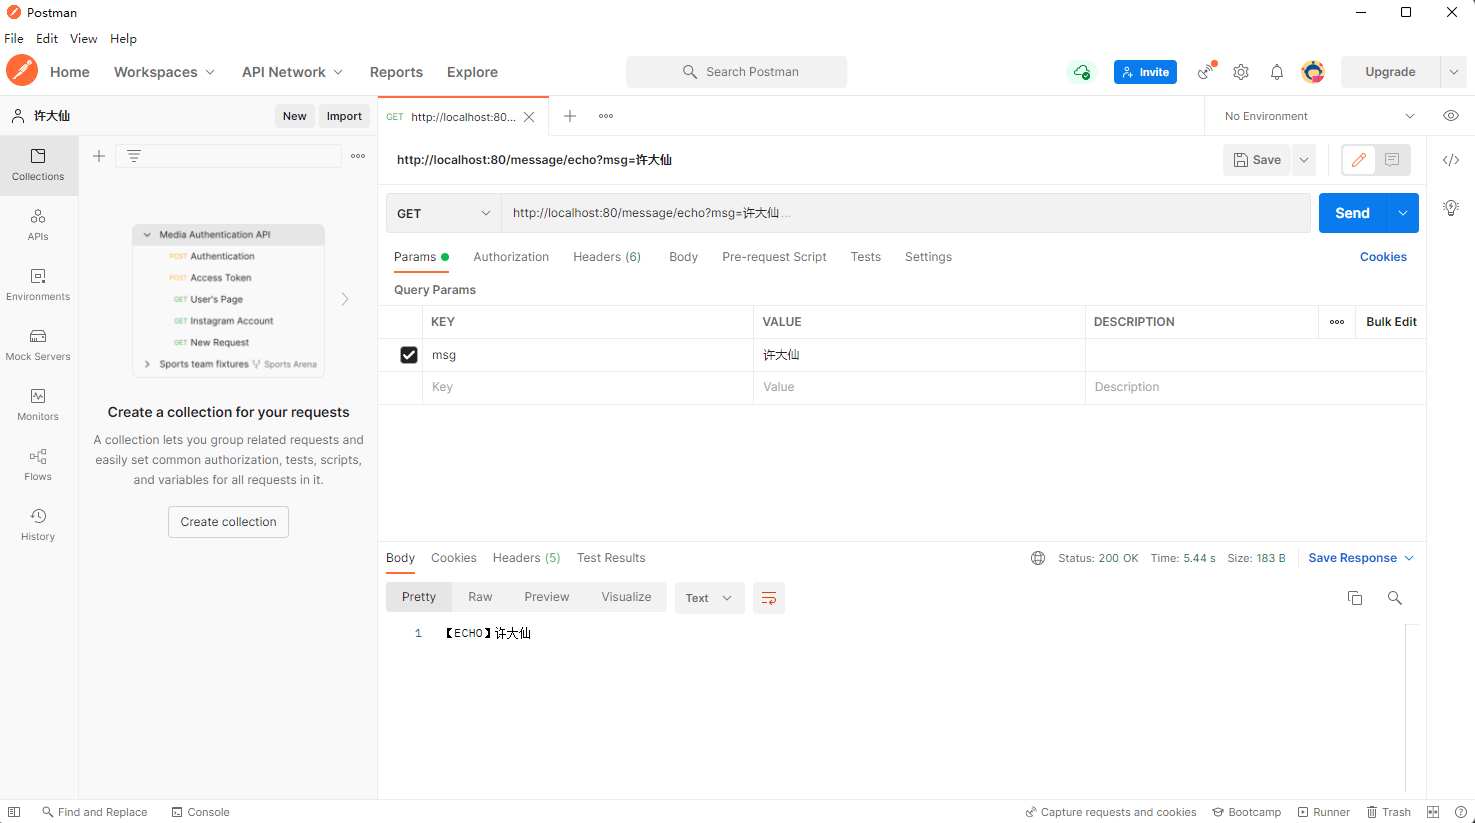
- 控制台输出信息:
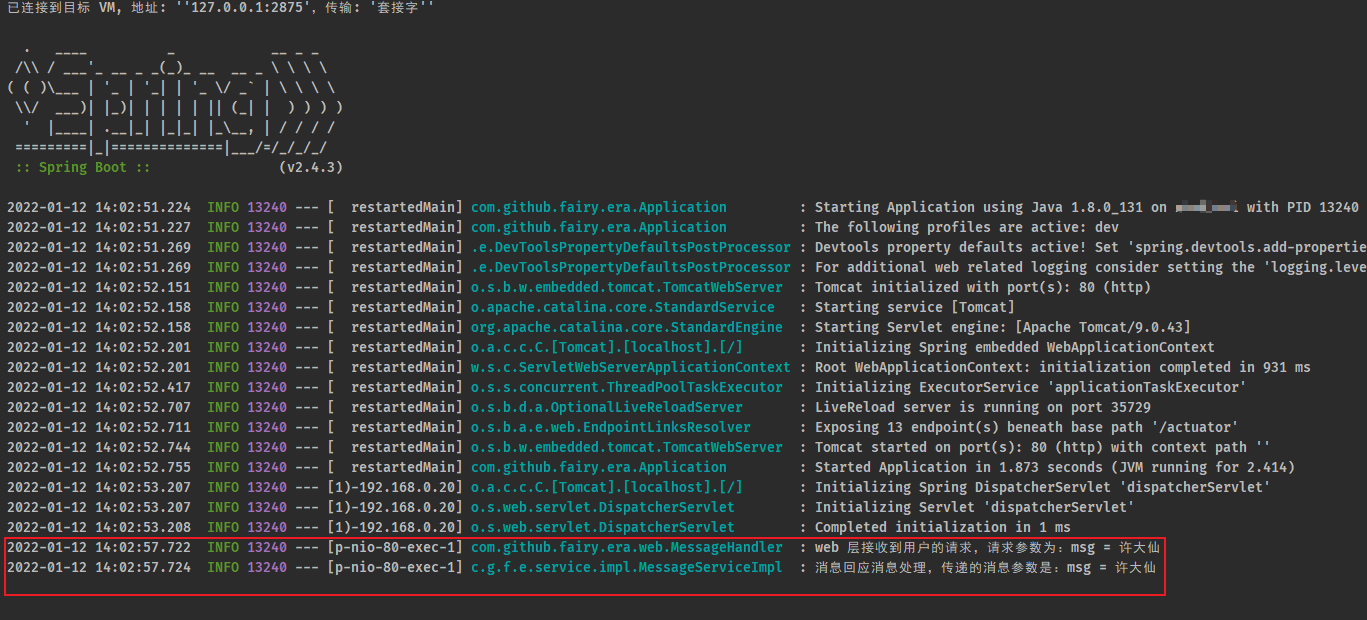
- 如果现在有很多用户并发进行访问,那么此时我们如何分辨出哪个用户访问这个接口?
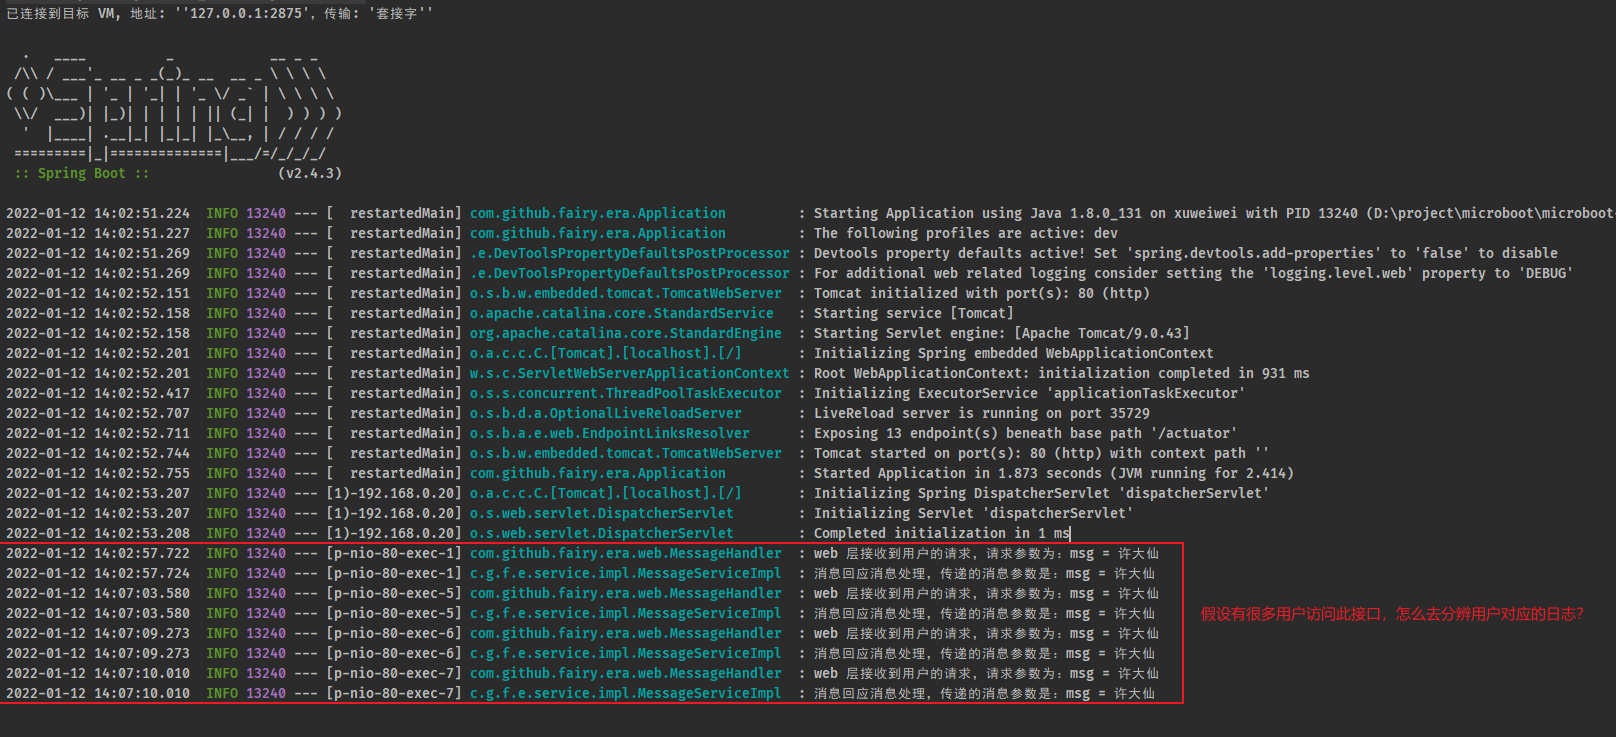
- 对于传统的日志记录来说,最大的实现技术问题就在于:日志仅仅能够记录用户的访问操作,却无法追踪到某个用户的完整日志记录,所以即便出现了问题,即使项目中已经存在了日志,我们也很难去定位问题并解决问题,此时就需要提供有一个全链路的追踪。
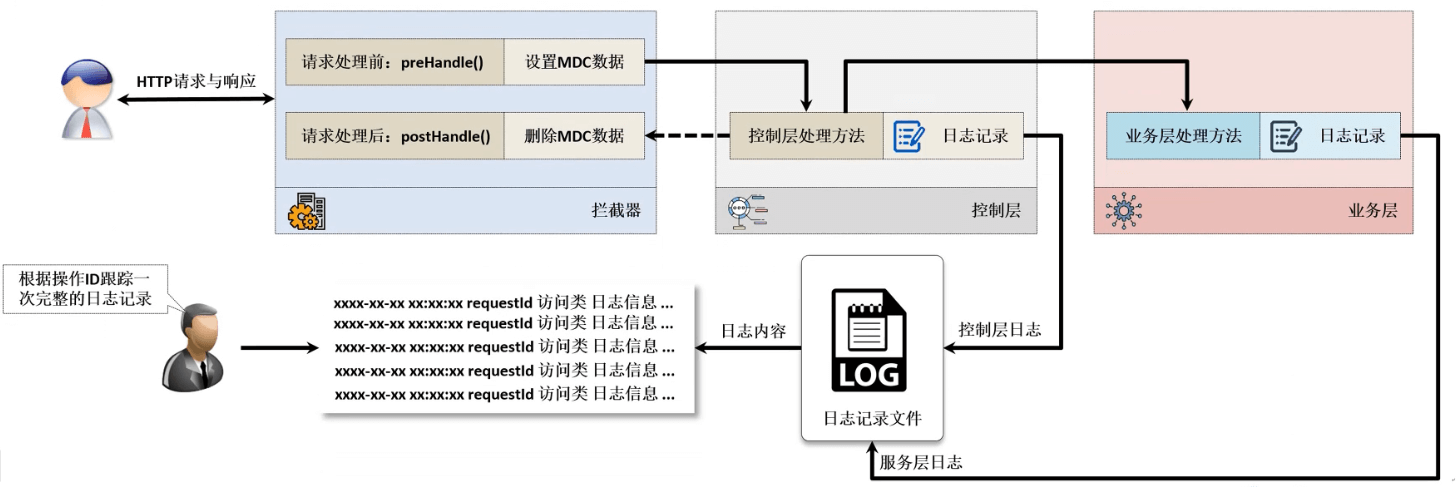
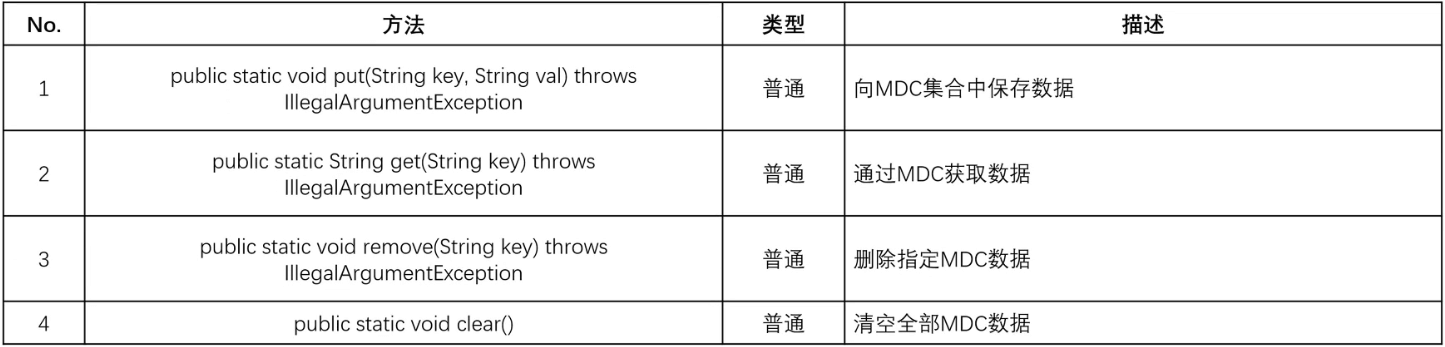
2.5.4 MDC(全链路追踪)
- 为了更加清楚的实现用户记录的日志处理,在良好的日志系统设计时一般都会使用 MDC(Mapped Diagnostic Context,映射调试上下文)全链路追踪日志,在日志记录中保留有一个线程的唯一请求标记(假定为 requestId),同时和该用户请求的所有相关日志在进行记录的时候都要准确的记录下这个 requestId ,这样在最终进行日志分析的时候,就可以依据这个 requestId 进行用户操作链路的完整追踪。
- requestId 是不能重复的,在开发之中可以使用 UUID 或者用户的设备 ID 等。
- 既然要进行 MDC 数据处理操作,那么肯定需要有一种专属的类型来实现 MDC 数据的存储,那个这个数据的存储就可以依靠 ThreadLocal 来实现,但是既然使用了日志,也可以通过日志组件里面所提供的 MDC 工具来完成。
2.5.5 microboot-web 子模块
- 使用拦截器来实现 MDC 功能:
package com.github.fairy.era.interceptor;import java.util.UUID;import javax.servlet.http.HttpServletRequest;import javax.servlet.http.HttpServletResponse;import org.slf4j.MDC;import org.springframework.web.servlet.HandlerInterceptor;import org.springframework.web.servlet.ModelAndView;import lombok.extern.slf4j.Slf4j;/*** @author 许大仙* @version 1.0* @since 2022-01-12 14:32*/@Slf4jpublic class MDCInterceptor implements HandlerInterceptor {private static final String RESPONSE_ID = "requestId";/*** 每次请求前进行 MDC 的绑定** @param request* @param response* @param handler* @return* @throws Exception*/@Overridepublic boolean preHandle(HttpServletRequest request, HttpServletResponse response, Object handler)throws Exception {String forward = request.getHeader("X-Forwarded-For");String clientId = request.getRemoteAddr();String uuid = UUID.randomUUID().toString();log.info("MDC 操作记录开始:requestId = {}", uuid);log.info("requestId = {},clientId = {},forward = {}", uuid, clientId, forward);MDC.put(RESPONSE_ID, uuid);return true;}/*** 每次请求后进行 MDC 的绑定** @param request* @param response* @param handler* @param modelAndView* @throws Exception*/@Overridepublic void postHandle(HttpServletRequest request, HttpServletResponse response, Object handler,ModelAndView modelAndView) throws Exception {String uuid = MDC.get(RESPONSE_ID);log.info("MDC 操作记录结束:requestId = {}", uuid);MDC.remove(RESPONSE_ID);}}
- 注册拦截器到 Spring 容器中:
package com.github.fairy.era.config;import org.springframework.context.annotation.Configuration;import org.springframework.web.servlet.config.annotation.InterceptorRegistry;import org.springframework.web.servlet.config.annotation.WebMvcConfigurer;import com.github.fairy.era.interceptor.MDCInterceptor;/*** @author 许大仙* @version 1.0* @since 2022-01-12 14:46*/@Configurationpublic class SpringConfig implements WebMvcConfigurer {@Overridepublic void addInterceptors(InterceptorRegistry registry) {registry.addInterceptor(new MDCInterceptor()).addPathPatterns("/**");}}
- 最需要控制的部分就是日志的管理操作,在日志处理的时候需要为其配置 MDC数据标记的输出位置,修改 logback-spring.xml 配置文件:
<?xml version="1.0" encoding="UTF-8"?><configuration scan="true" scanPeriod="60 seconds" debug="false"><contextName>logback</contextName><!-- 定义控制台输出匹配格式 --><substitutionProperty name="logging.pattern.console"value="%clr(%d{${LOG_DATEFORMAT_PATTERN:-yyyy-MM-dd HH:mm:ss.SSS}}){faint} %clr(${LOG_LEVEL_PATTERN:-%5p}) %clr([%X{requestId}]) %clr(${PID:- }){magenta} %clr(---){faint} %clr([%15.15t]){faint} %clr(%-40.40logger{39}){cyan} %clr(:){faint} %m%n${LOG_EXCEPTION_CONVERSION_WORD:-%ewtpc}"/><!-- 定义日志文件输出匹配格式 --><substitutionProperty name="logging.pattern.file"value="%d{${LOG_DATEFORMAT_PATTERN:-yyyy-MM-dd HH:mm:ss.SSS}} ${LOG_LEVEL_PATTERN:-%5p} %clr([%X{requestId}]) ${PID:- } --- [%t] %-40.40logger{39} : %m%n${LOG_EXCEPTION_CONVERSION_WORD:-%ewtpc}"/><conversionRule conversionWord="clr" converterClass="org.springframework.boot.logging.logback.ColorConverter"/><conversionRule conversionWord="wtpc"converterClass="org.springframework.boot.logging.logback.WhitespaceThrowableProxyConverter"/><conversionRule conversionWord="ewtpc"converterClass="org.springframework.boot.logging.logback.ExtendedWhitespaceThrowableProxyConverter"/><appender name="console" class="ch.qos.logback.core.ConsoleAppender"> <!-- 控制台输出 --><layout class="ch.qos.logback.classic.PatternLayout"> <!-- 使用layout节点 --><pattern>${logging.pattern.console}</pattern> <!-- 格式引用 --></layout></appender><!-- 将每天的日志保存在一个文件之中 --><appender name="file" class="ch.qos.logback.core.rolling.RollingFileAppender"><Prudent>true</Prudent><rollingPolicy class="ch.qos.logback.core.rolling.TimeBasedRollingPolicy"><!-- 设置日志保存路径,本次按照月份创建日志目录,而后每天的文件归档到一组 --><FileNamePattern>micro-logs/%d{yyyy-MM}/micro-%d{yyyy-MM-dd}.log</FileNamePattern><MaxHistory>365</MaxHistory><!-- 删除超过365天的日志文件 --></rollingPolicy><filter class="ch.qos.logback.classic.filter.ThresholdFilter"><level>INFO</level> <!-- 保存ERROR及以上级别的日志 --></filter><encoder><Pattern>${logging.pattern.file}</Pattern> <!-- 格式引用 --></encoder></appender><root level="INFO"> <!-- 全局日志级别 --><appender-ref ref="console"/><appender-ref ref="file"/></root></configuration>
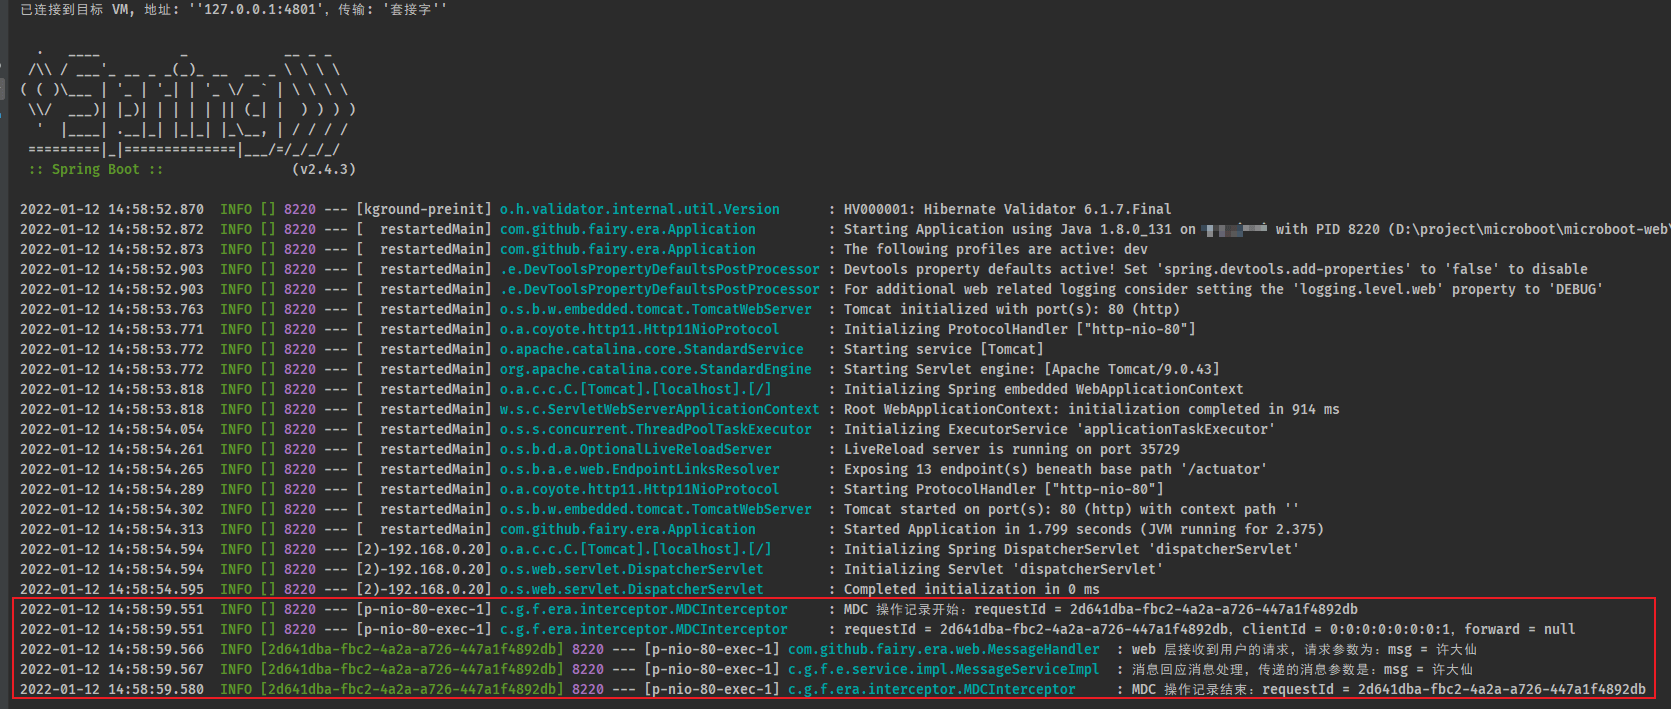
2.5.6 postman
- 通过 postman 进行接口的测试:
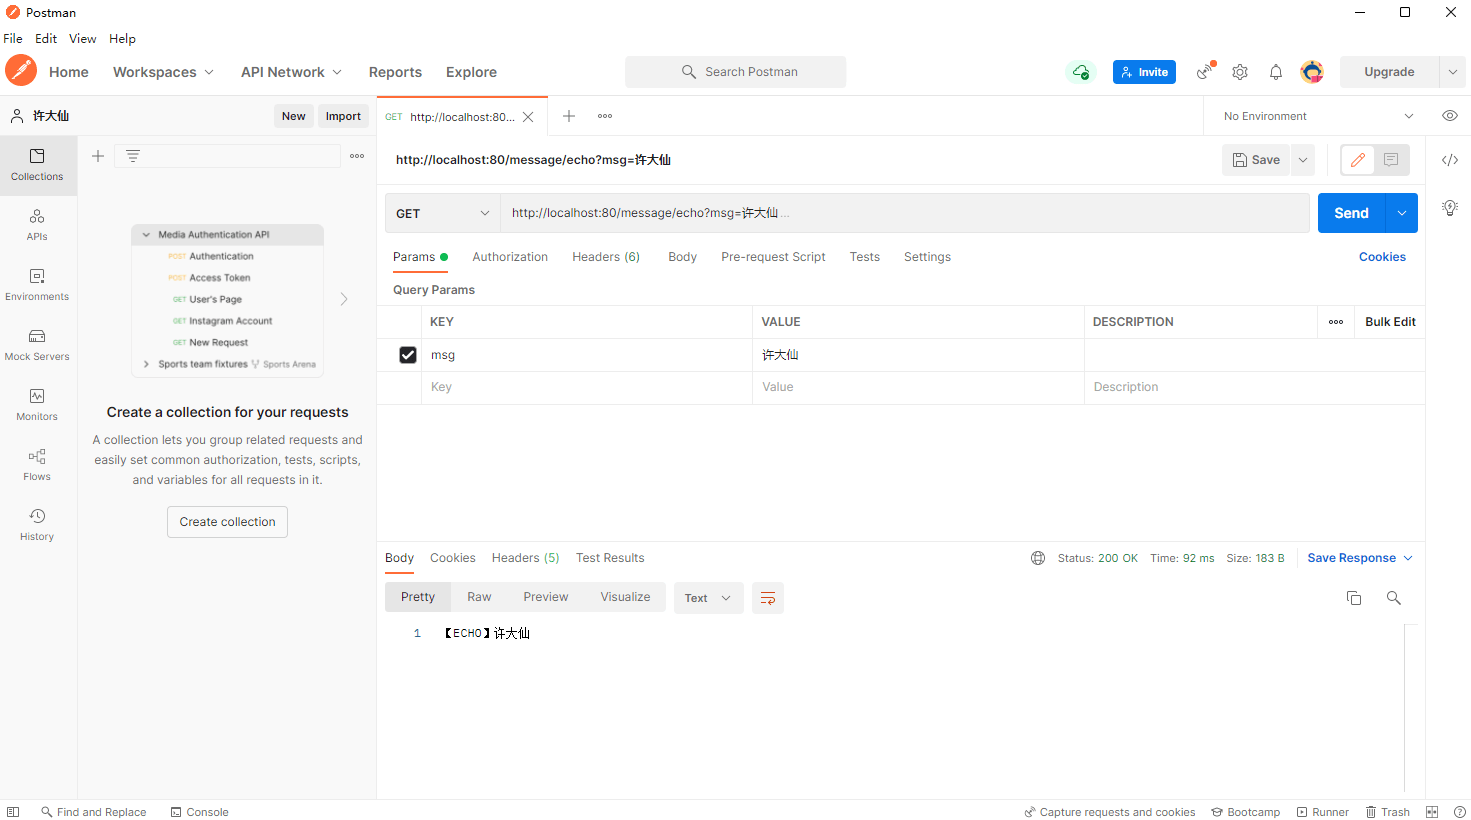
- 控制台输出信息:
3 Actuator 可视化监控
3.1 Actuator 可视化监控简介
3.1.1 概述
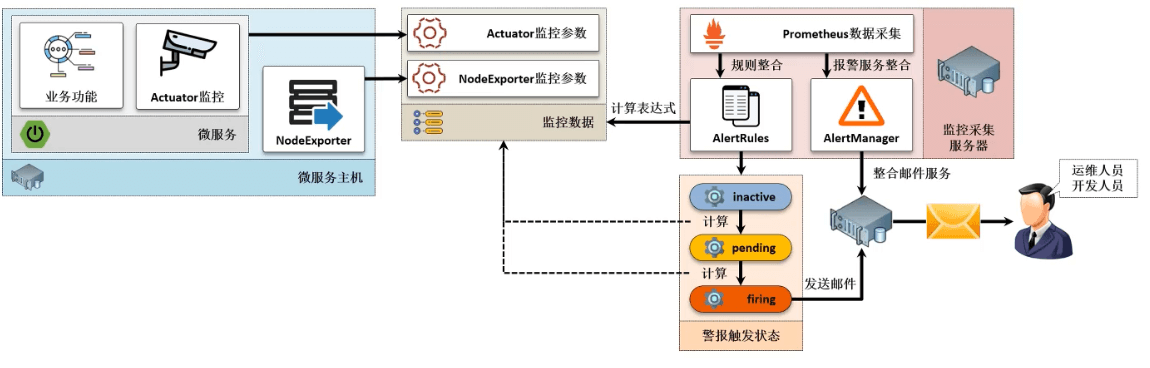
- Actuator 虽然可以为管理者提供完整的 SpringBoot 环境监控数据,但是用户所能够获取的数据内容,仅仅是当前的服务状态,却无法提供系统性的可视化监控。所以当某一个微服务执行性能下降时是很难通过当前的状态直观的发现微服务存在问题,最佳的做法是对这些监控数据进行持续的记录,并以监控图示的方式展示给用户。
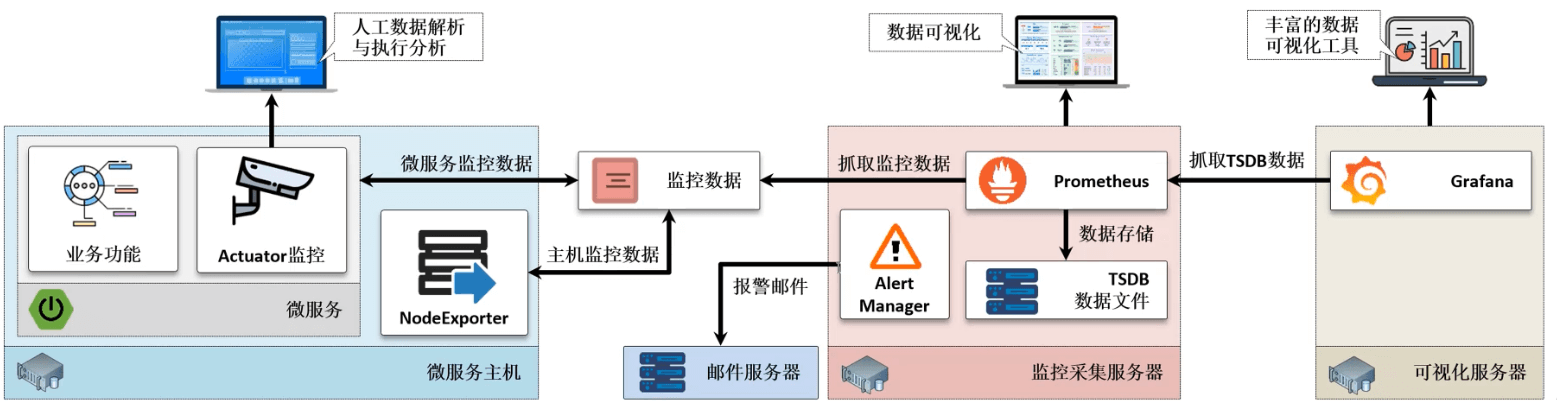
- 正常来讲所有的 SpringBoot 程序一般都需要部署在一台专属的微服务主机之中,但是这台主机需要对外暴露监控数据(Actuator 所实现的),除了这些基本的微服务的监控数据之外,还需要提供一些当前主机的监控数据(内存占用、CPU 使用率等等),那么常规的做法就是结合 NodeExporter 组件来获取这些信息内容。
- 要想实现这样的监控环境就需要准备三台服务器,配置如下: | 主机名称 | IP 地址 | 运行服务 | 操作系统 | 配置 | | —- | —- | —- | —- | —- | | microboot-producer | 192.168.65.100 | PrometheusActuator、NodeExporter | CentOS 7.9 | 2核6G | | microboot-prometheus | 192.168.65.101 | Prometheus、AlterManager | CentOS 7.9 | 2核6G | | microboot-grafana | 192.168.65.102 | Grafana | CentOS 7.9 | 2核6G |
3.1.2 设置主机名
- 命令:
hostnamectl set-hostname <hostname>
- 示例:设置 192.168.65.100 的主机名
hostnamectl set-hostname microboot-producer
- 示例:设置 192.168.65.101 的主机名
hostnamectl set-hostname microboot-prometheus
- 示例:设置 192.168.65.102 的主机名
hostnamectl set-hostname microboot-grafana
3.1.3 关闭防火墙
- 命令:三台机器都需要执行
systemctl stop firewalld
systemctl disable firewalld
3.1.4 重启
- 命令:三台机器都需要执行
reboot
3.2 NodeExporter
3.2.1 概述
- 在整个微服务监控的过程之中,除了需要针对于 SpringBoot 服务本身进行监控之外,最重要的一点就是需要及时清楚当前主机(节点)所对应的性能状态,这样就可以清楚的知道主机的资源是否可用。
- NodeExporter 是一个由 Prometheus 所提供的开发组件,这个组件是一个独立的应用程序包,在需要的地方进行组件的导入即可(本质上可以理解为一个独立的进程)。
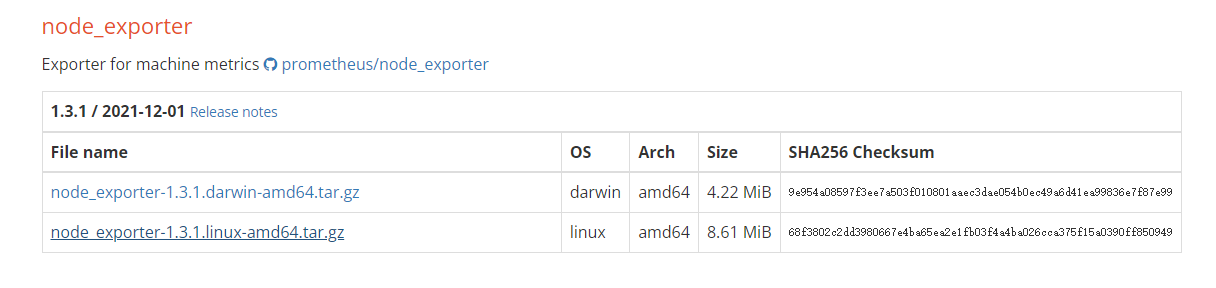
- 如果要进行下载,就需要登录 Prometheus 的官网。

- 点击 DOWNLOAD 按钮,就可以进行 NodeExporter 的下载。
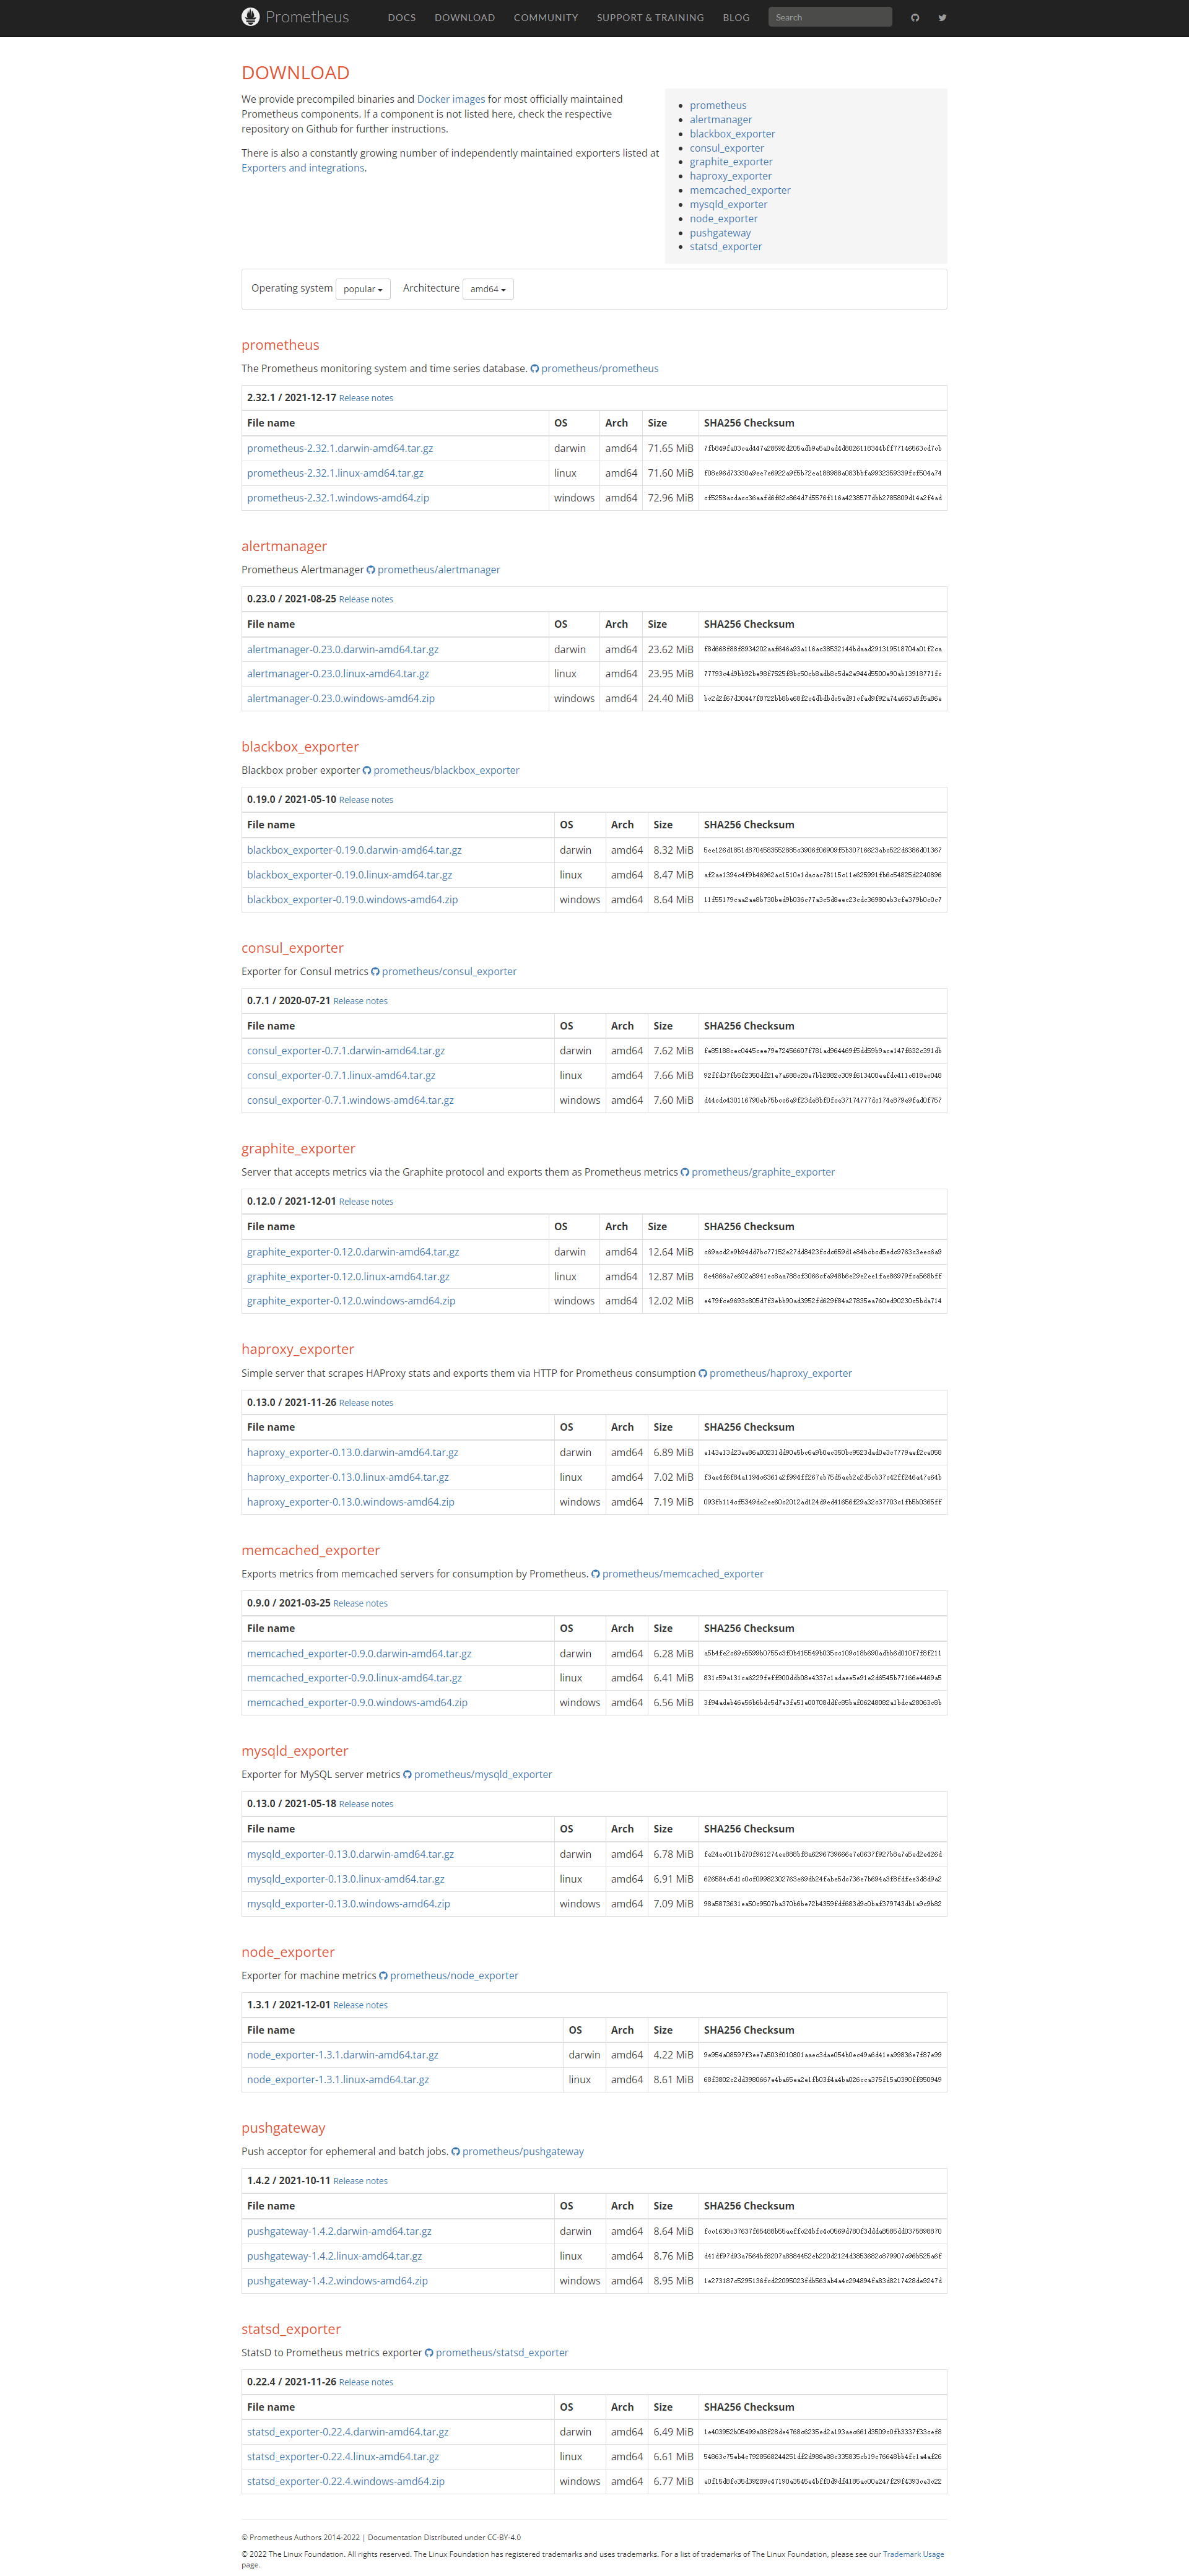
- 当前可以获取的版本为
node_exporter-1.3.1.linux-amd64.tar.gz。
3.2.2 安装 NodeExporter
注意:操作主机的 IP 为 192.168.65.100 。
- 下载 NodeExporter:
wget https://github.com/prometheus/node_exporter/releases/download/v1.3.1/node_exporter-1.3.1.linux-amd64.tar.gz -P /opt

- 解压文件:
cd /opt
tar -zxvf node_exporter-1.3.1.linux-amd64.tar.gz -C /usr/local/

- 将目录的名称进行重命名处理:
cd /usr/local
mv node_exporter-1.3.1.linux-amd64/ node_exporter

- 既然需要对服务器端进行监控,最佳的做法就是将 NodeExporter 配置为系统服务,这样可以在系统启动的时候自动进行启用。
vim /lib/systemd/system/node_exporter.service
[Unit]Description=Node_Exporter Service[Service]User=rootExecStart=/usr/local/node_exporter/node_exporterTimeoutStopSec=10Restart=on-failureRestartSec=5[Install]WantedBy=multi-user.target
systemctl daemon-reload

3.2.3 NodeExporter 服务的管理
- 启动 node_exporter :
systemctl start node_exporter.service

- 停止 node_exporter :
systemctl stop node_exporter.service

- 禁止 node_exporter 开机自动启动:
systemctl disable node_exporter.service
- 设置 node_exporter 开机自动启动:
systemctl enable node_exporter.service

3.2.4 查看端口占用情况
- 由于 NodeExporter 需要持续的对外提供监控服务,所以需要存在有一个相关的服务端口,我们可以查看端口占用情况:
netstat -nptl
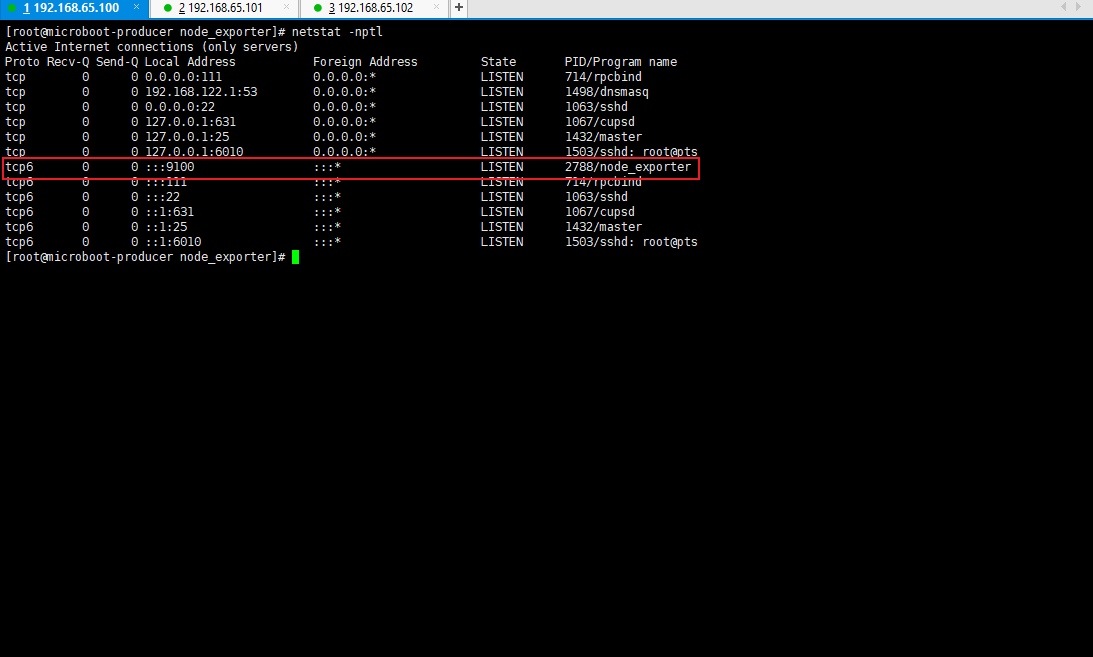
- 此时这台主机上的相关的进程已经可以全部进行获取了,随后将其整合到 Prometheus 中,就可以对当前应用的节点的资源使用情况进行监控。
3.3 获取 Prometheus 监控数据
3.3.1 概述
- 对于当前给出的 Prometheus 数据内容实际上由两个部分组成:NodeExporter、Actuator 。对于 SpringBoot 来讲最大的特点是直接提供了 Actuator ,可以获取当前的 JVM 的完整数据信息以及整个项目之中的所有配置信息,但是如果要想进行有效的监控处理,最佳的做法就是要获取到相应的数据供给,现在为了 Prometheus 进行数据供给,本次考虑对当前的项目进行改进,提供更多的和 Prometheus 有关的数据。
3.3.2 microboot 项目
- 修改 build.gradle 配置文件,为 microboot-web 子模块添加新的依赖:
project(':microboot-web') { // 设置子项目的配置,独享配置dependencies { // 配置子模块依赖implementation(project(':microboot-common')) // 引入其他子模块// 引入 SpringBoot 的 web 依赖implementation 'org.springframework.boot:spring-boot-starter-web'// 引入 SpringBoot 的 actuator 依赖implementation group: 'org.springframework.boot', name: 'spring-boot-starter-actuator'// 引入 prometheus 的依赖implementation group: 'io.micrometer', name: 'micrometer-registry-prometheus'}gradle.taskGraph.whenReady { // 在所有的操作准备好之后触发tasks.each { task ->if (task.name.contains('javadoc')) { // 如果发现有 javadoc 任务,就跳过task.enabled = false // 当前任务不执行}}}}
3.3.3 microboot-web 子模块
- 此时引用了 Prometheus 的依赖,不需要开发者对程序进行繁琐的配置,查看 application.yml 配置文件:
# actuatormanagement:server:port: 9090 # 指定 Actuator 的端口endpoints:web:exposure:include: '*' # 开放全部的微服务监控端点 ,包括 prometheus 的端点base-path: /actuator # 监控服务的父路径,默认就是 /actuatormetrics:export:prometheus:enabled: true # 默认就是 truejmx:enabled: true # 默认就是 true
- 对当前模块进行打包操作,执行如下的命令:
gradle bootJar
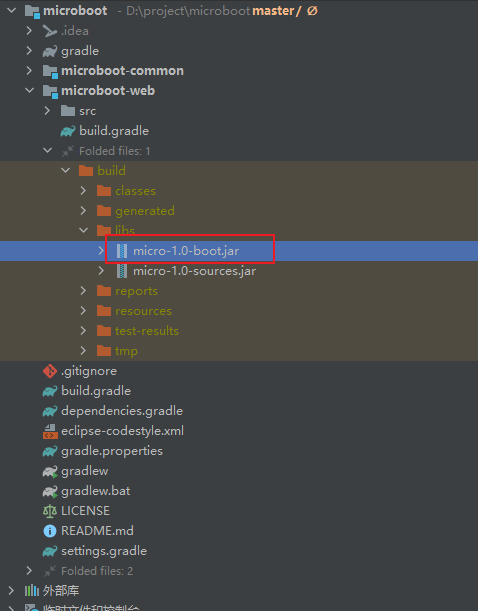
- 将生成的 jar 文件上传到 192.168.65.100 主机,执行如下的命令:
nohup java -jar micro-1.0-boot.jar > micro.log 2>&1 &

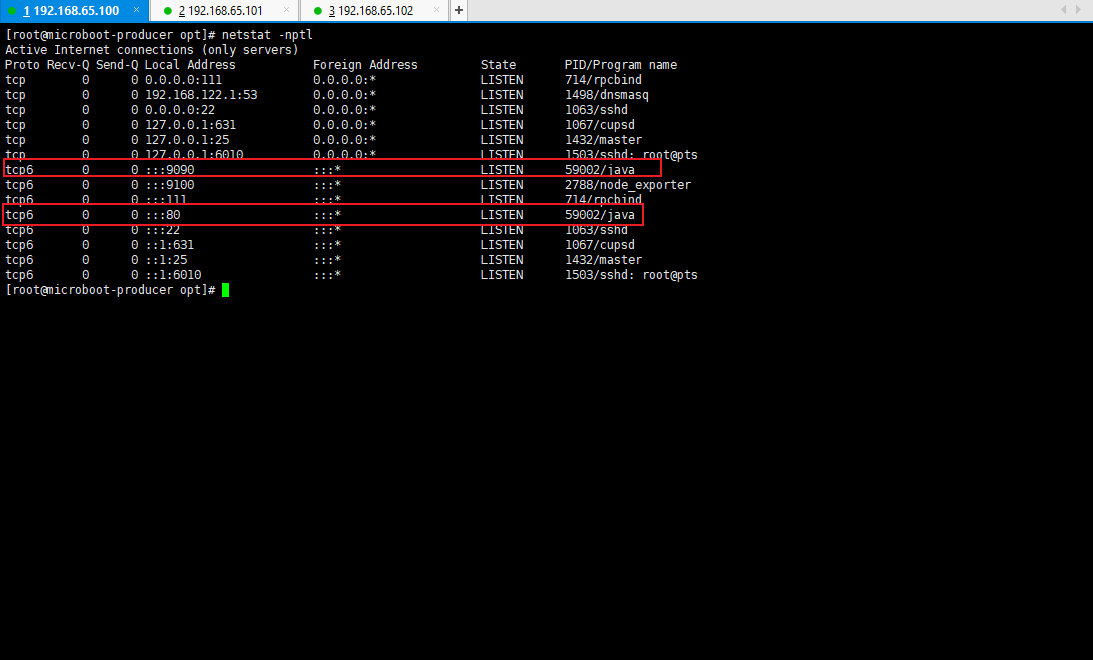
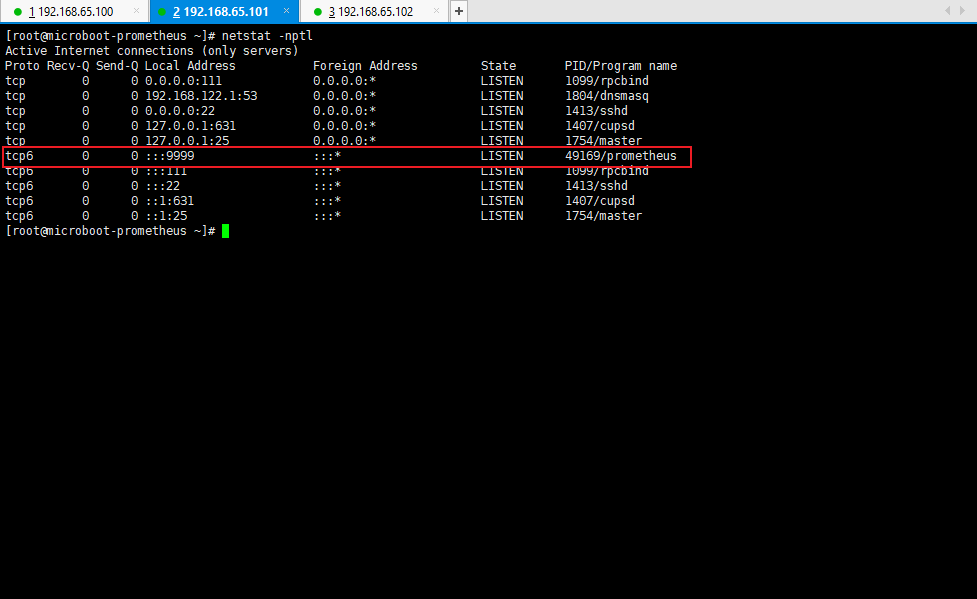
- 查看当前服务启动的端口占用情况:
netstat -nptl
3.3.4 浏览器
- 可以通过浏览器来查看 Actuator 的端点信息:
- 在当前的应用环境之中,该节点已经可以正确的为 Prometheus 提供个监控服务了。
3.4 配置 Prometheus 服务
3.4.1 概述
- Prometheus 的服务端配置并不复杂,如果要想让这个服务端正常的运行起来,则必须要有数据节点的提供,在之前已经在 192.168.65.100 的服务器上配置了主机数据导出,以及基于 Actuator 实现了 SpringBoot 应用的数据导出。
3.4.2 安装 Prometheus
注意:操作主机的 IP 为 192.168.65.102 。
- 下载 Prometheus :
wget https://github.com/prometheus/prometheus/releases/download/v2.32.1/prometheus-2.32.1.linux-amd64.tar.gz -P /opt

- 解压文件:
cd /opt
tar -zxvf prometheus-2.32.1.linux-amd64.tar.gz -C /usr/local

- 将目录的名称进行重命名处理:
cd /usr/local
mv prometheus-2.32.1.linux-amd64/ prometheus

- 修改 Prometheus 的 yaml 配置文件:
cd prometheus
vim prometheus.yml
# 全局配置global:scrape_interval: 15s # 数据抓取时间间隔为 15 s. 默认为 1 分钟.evaluation_interval: 15s # 数据评估间隔为 15 s. 默认为 1 分钟.# scrape_timeout is set to the global default (10s).# 警告配置alerting:alertmanagers:- static_configs:- targets:# - alertmanager:9093# Load rules once and periodically evaluate them according to the global 'evaluation_interval'.rule_files:# - "first_rules.yml"# - "second_rules.yml"# 监控数据的抓取配置scrape_configs:- job_name: "prometheus" # 任务的名称# metrics_path defaults to '/metrics'# scheme defaults to 'http'.static_configs: # 任务的配置- targets: ["localhost:9999"] # 监控主机的地址- job_name: "node" # 任务的名称# metrics_path defaults to '/metrics'# scheme defaults to 'http'.static_configs: # 任务的配置,设置成 NodeExporter 服务器的具体地址- targets: ["192.168.65.100:9100"]- job_name: "microboot" # 任务的名称scrape_interval: 10s # 局部的抓取时间scrape_timeout: 5s # 抓取时间的超时时间metrics_path: '/actuator/prometheus' # 获取度量数据路径,默认为 '/metrics'# scheme defaults to 'http'.static_configs: # 任务的配置,设置成 Springboot 应用所在服务器的具体地址- targets: ["192.168.65.100:9090"]

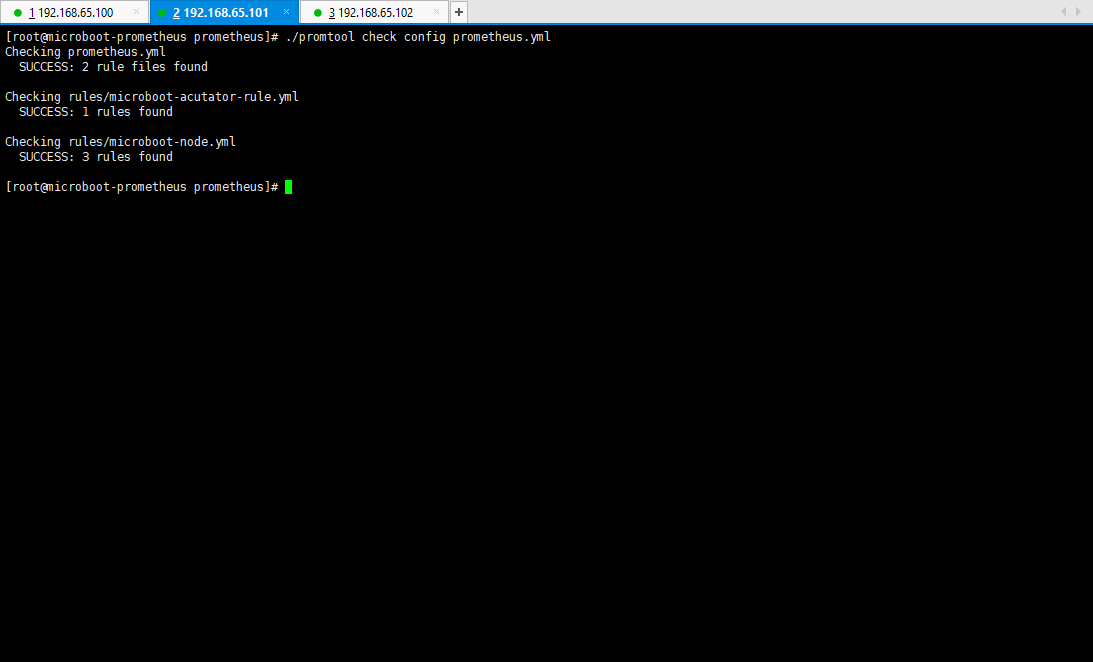
- 配置完成之后,可以检查一下当前的配置文件是否定义正确:
./promtool check config prometheus.yml
- 为了便于后续的维护,建议做一个启动配置文件,实现 Prometheus 服务的自动启动:
vim /lib/systemd/system/prometheus.service
[Unit]Description=Prometheus Service[Service]User=rootExecStart=/usr/local/prometheus/prometheus \--config.file=/usr/local/prometheus/prometheus.yml \--storage.tsdb.path=/usr/local/prometheus/data \--web.listen-address=0.0.0.0:9999 --web.enable-lifecycleTimeoutStopSec=10Restart=on-failureRestartSec=5[Install]WantedBy=multi-user.target
systemctl daemon-reload

3.4.3 设置 Prometheus 服务的自动启动
- 启动 Prometheus 服务:
systemctl start prometheus
- 设置 Prometheus 开机自动启动:
systemctl enable prometheus

3.4.4 查看端口占用情况
- 命令:
netstat -nptl
3.4.5 浏览器
- 此时已经配置好了 Prometheus ,就可以通过浏览器访问 WEB 监控界面:
3.5 Grafana 可视化
3.5.1 概述
- 使用 Prometheus 可以得到监控的可视化数据,但是在默认情况下 Prometheus 所提供的数据的展现形式是非常有限的。
- 最终负责监控数据观测的可能并不是程序员,而是运维人员,他们并没有这么多的图形的阅读经历,而且 Prometheus 是一个数据库,最佳的做法就是让监控数据显示能够更加丰富一些,所以 Grafana 应运而生。
- Grafana 是一个免费的开源组件,只需要登录官方站点,就可以进行组件的下载,下载地址。
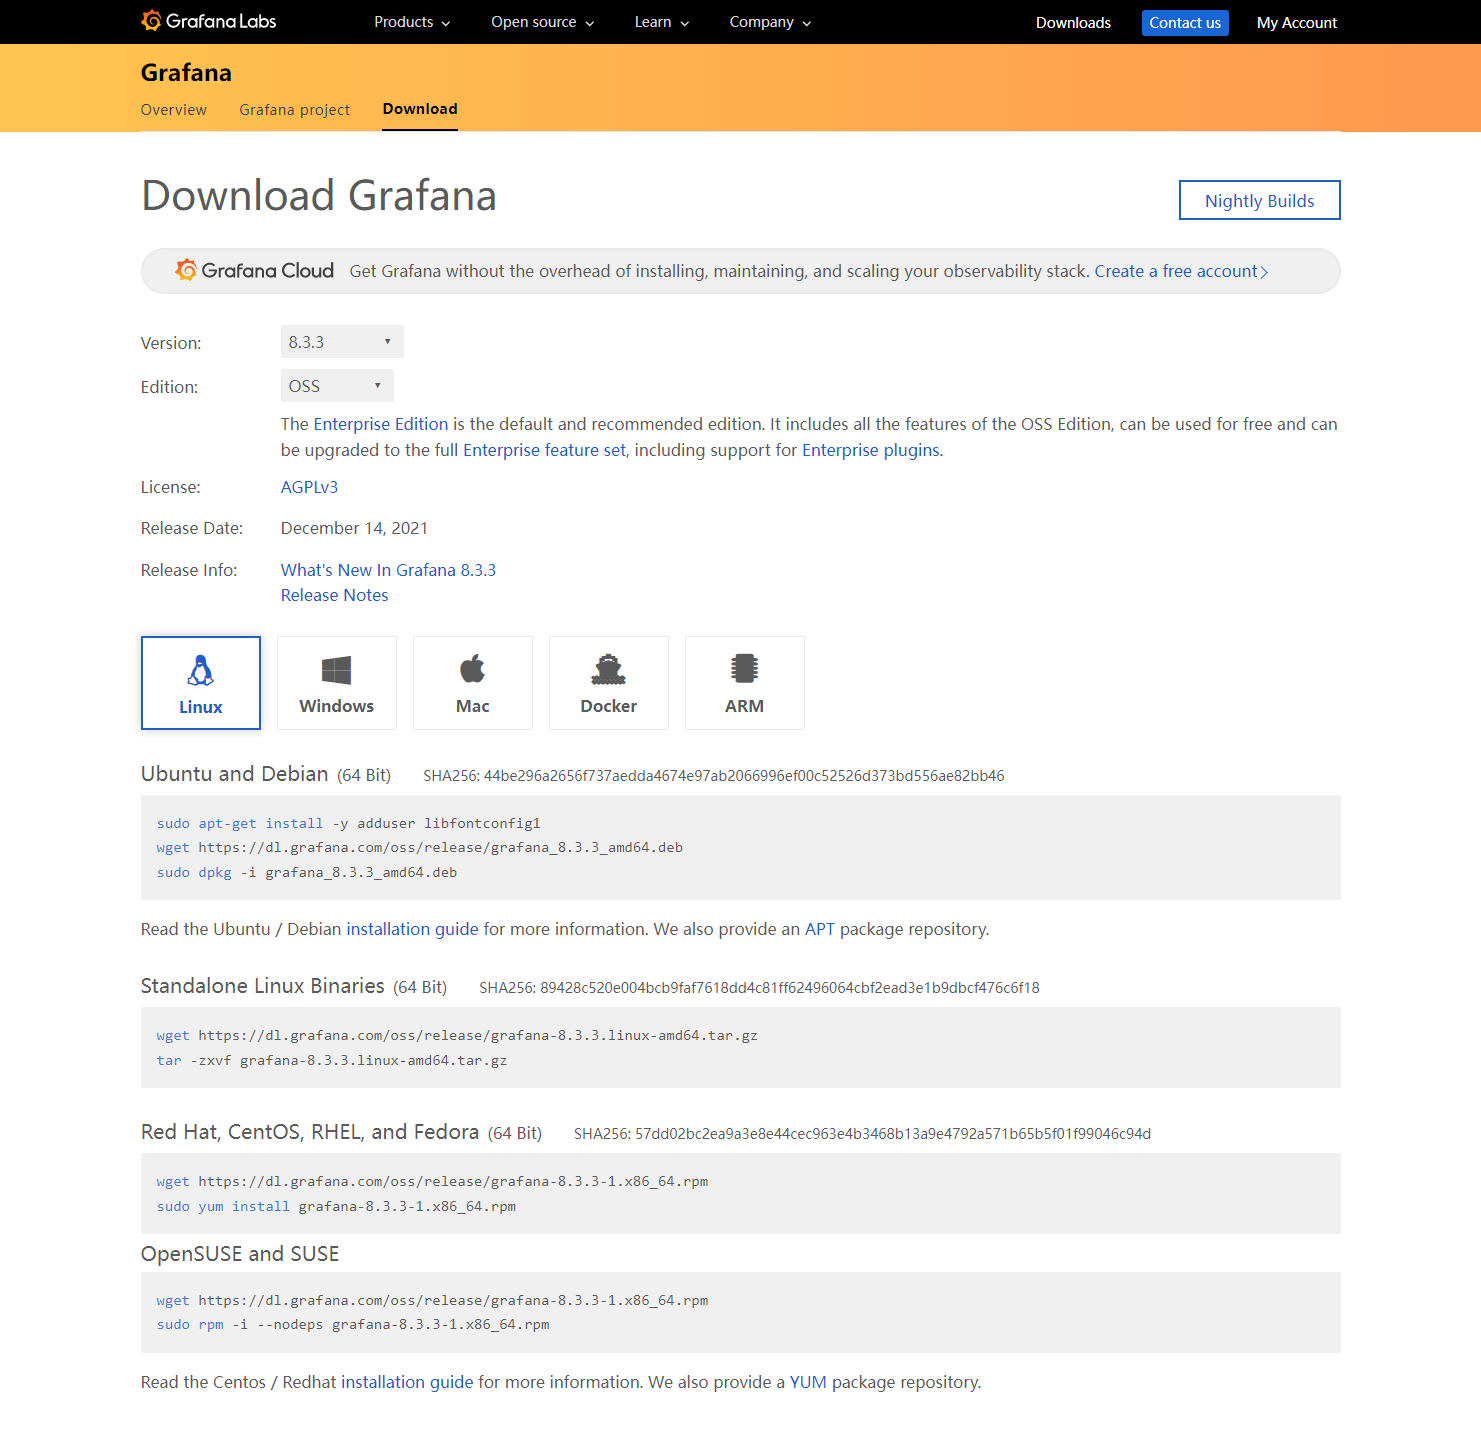
- Grafana 提供了不同版本的组件包,包括:rpm 包、tar.gz 包,本次选择 tar.gz 包的形式。
3.5.2 安装 Grafana
注意:操作主机的 IP 为 192.168.65.102 。
- 下载 Grafana :
wget https://dl.grafana.com/oss/release/grafana-8.3.3.linux-amd64.tar.gz -P /opt

- 解压文件:
cd /opt
tar -zxvf prometheus-2.32.1.linux-amd64.tar.gz -C /usr/local

- 将目录的名称进行重命名处理:
cd /usr/local
mv grafana-8.3.3/ grafana

- 为了便于后续的维护,建议做一个启动配置文件,实现 Grafana 服务的自动启动:
vim /lib/systemd/system/grafana.service
[Unit]Description=Grafana Service[Service]User=rootExecStart=/usr/local/grafana/bin/grafana-server \-config /usr/local/grafana/conf/defaults.ini -homepath /usr/local/grafanaTimeoutStopSec=10Restart=on-failureRestartSec=5[Install]WantedBy=multi-user.target
systemctl daemon-reload

3.5.3 设置 Grafana 服务的自动启动
- 启动 Grafana 服务:
systemctl start grafana

- 设置 Grafana 开机自动启动:
systemctl enable grafana
3.5.4 查看端口占用情况
- 命令:
netstat -nptl

3.5.5 浏览器
- Grafana 的默认用户名和密码是 admin/admin ,第一次登录系统会要求修改密码。
3.5.6 Grafana 控制台
- 此时配置完成的 Grafana 好像和之前的 Prometheus 没有太多的关联,实际上这个关联是存在的,只是需要开发者自行配置,因为 Grafana 的功能实在是太强大了,可以监控各种各样的数据,并且形成报表,所以现在就需要在控制台之中进行 Prometheus 数据源的配置。


- Prometheus 的 IP 地址是 http://192.168.65.101:9999/,所以需要将其配置到 Grafana 中。
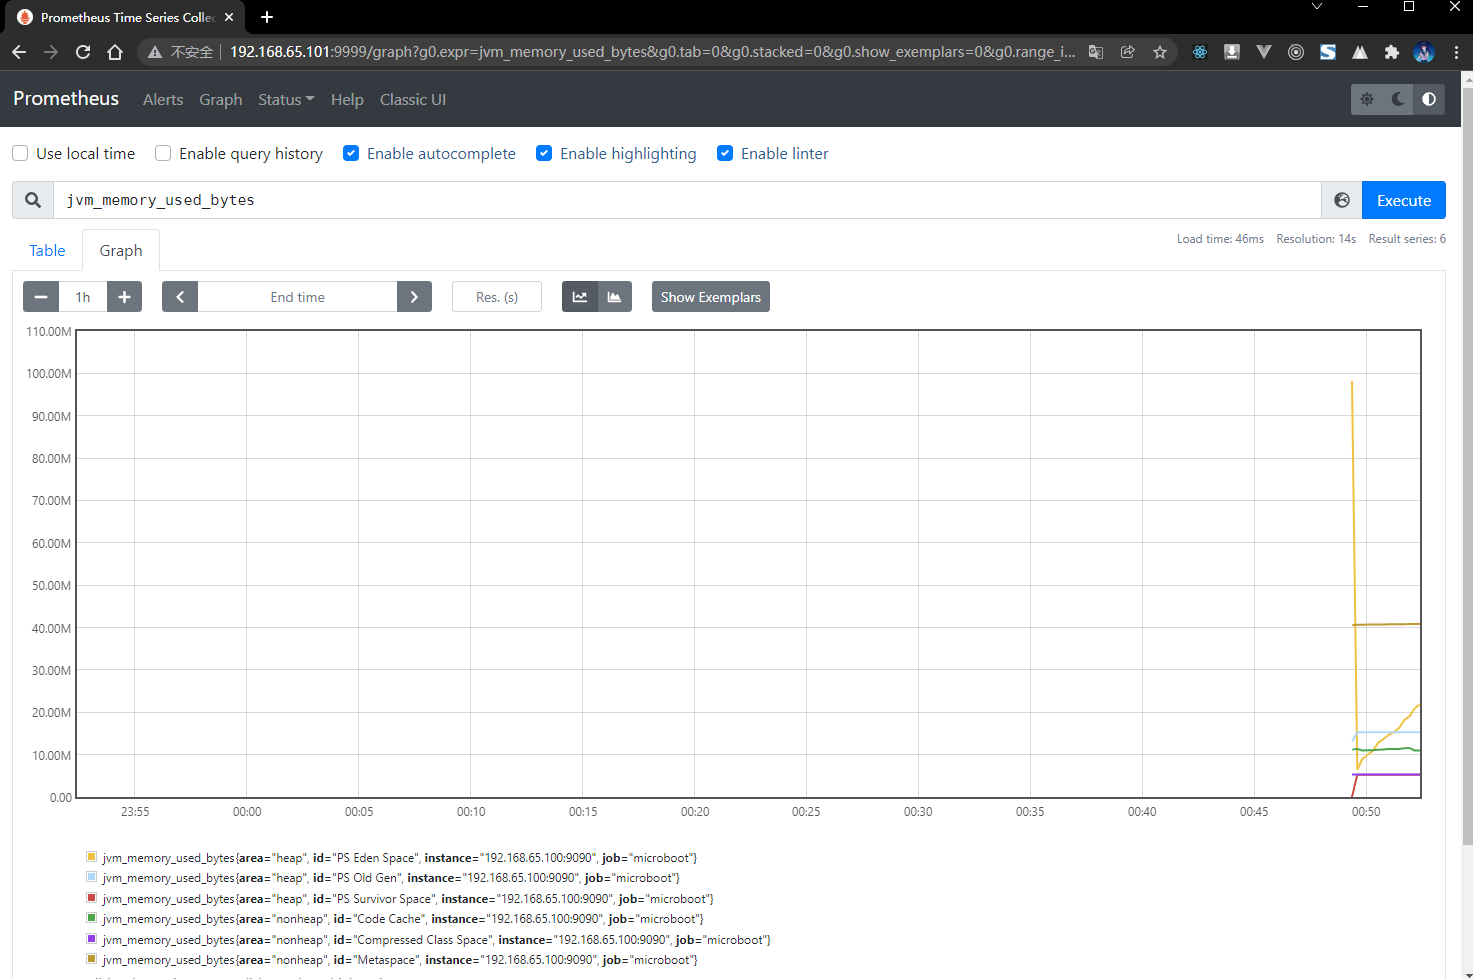
3.5.7 Grafana 控制台
- 进行面板的配置,添加新的监控面板。

3.6 监控报警配置
3.6.1 概述
- 对于当前给定的程序来说:Actuator 提供了微服务的监控数据,Prometheus 提供了微服务监控数据的存储,Grafana 提供了微服务监控数据的可视化。
- Prometheus 除了可以实现监控数据的存储之外,还可以直接提供警报服务,例如:CPU 占用率过高、某些微服务被杀死,利用获取到的监控参数进行相应的计算和判断,就可以在服务发生问题的时候或者准备发生问题的时候获取相应的预警信息,这样就可以将问题及时的反馈到运维人员或者项目人员以便及时进行修复。
3.6.2 安装 Prometheus Alertmanager
注意:操作主机的 IP 为 192.168.65.101 。
- 下载 Prometheus Alertmanager:
wget https://github.com/prometheus/alertmanager/releases/download/v0.23.0/alertmanager-0.23.0.linux-amd64.tar.gz -P /opt

- 解压文件:
cd /opt
tar -zxvf alertmanager-0.23.0.linux-amd64.tar.gz -C /usr/local

- 将目录的名称进行重命名处理:
cd /usr/local
mv alertmanager-0.23.0.linux-amd64/ alertmanager
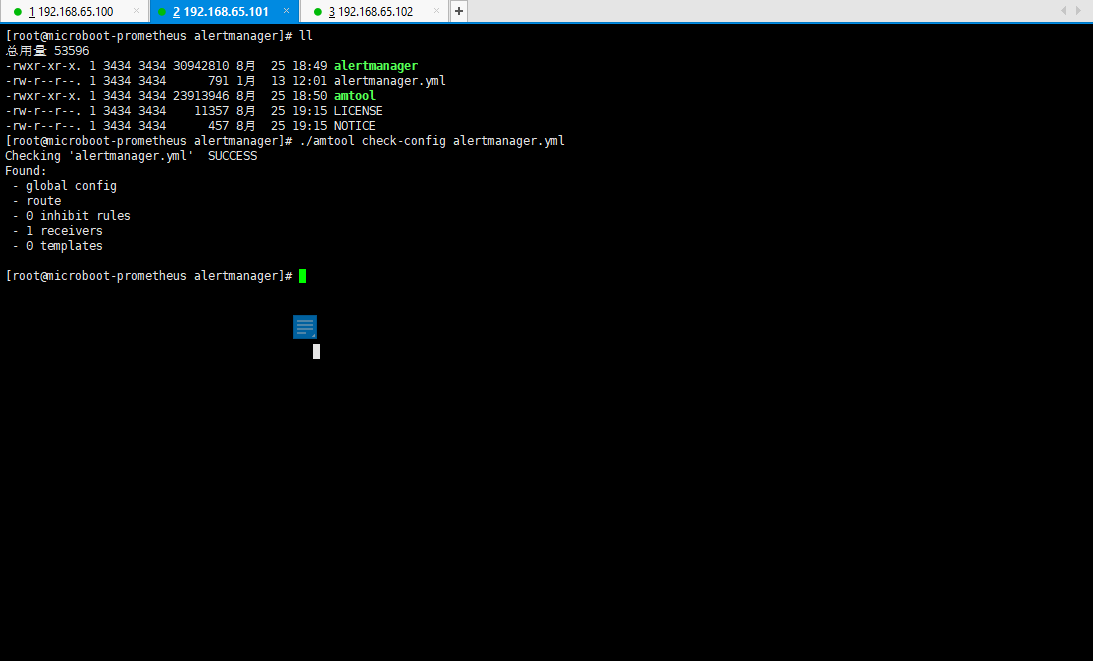
- 进行警报配置:
cd alertmanager
vim alertmanager.yml
global: # 全局配置resolve_timeout: 5m # 解析超时配置smtp_smarthost: 'smtp.qq.com:25' # SMTP 服务器配置smtp_from: 'xxx@qq.com' # 邮件来源smtp_auth_username: 'xxxx@qq.com' # SMTP 登录用户名smtp_auth_password: 'xxx' # SMTP 登录密码,申请的授权码smtp_require_tls: false # 不使用 TLS 加密route: # 数据路由配置group_by: ['alertname'] # 数据分组group_wait: 10s # 等待时间group_interval: 10s # 分组间隔repeat_interval: 3m # 邮件重复发送间隔receiver: 'mail' # 警报发送媒体类型为邮件receivers: # 警报接收者配置- name: 'mail' # 接收者类型,和媒体类型配置相同email_configs: # 邮件接收列表- to: 'xxx@qq.com' # 接收邮箱
- 配置完成之后,可以检查一下当前的配置文件是否定义正确:
./amtool check-config alertmanager.yml
- 为了便于后续的维护,建议做一个启动配置文件,实现 Prometheus Alertmanager 服务的自动启动:
vim /lib/systemd/system/alertmanager.service
[Unit]Description=Alertmanager Service[Service]User=rootExecStart=/usr/local/alertmanager/alertmanager \--config.file=/usr/local/alertmanager/alertmanager.ymlTimeoutStopSec=10Restart=on-failureRestartSec=5[Install]WantedBy=multi-user.target
systemctl daemon-reload
3.6.3 Prometheus Alertmanager 进行服务的自动启动
- 启动 Prometheus Alertmanager 服务:
systemctl start alertmanager
- 设置 Prometheus Alertmanager 开机启动:
systemctl enable alertmanager

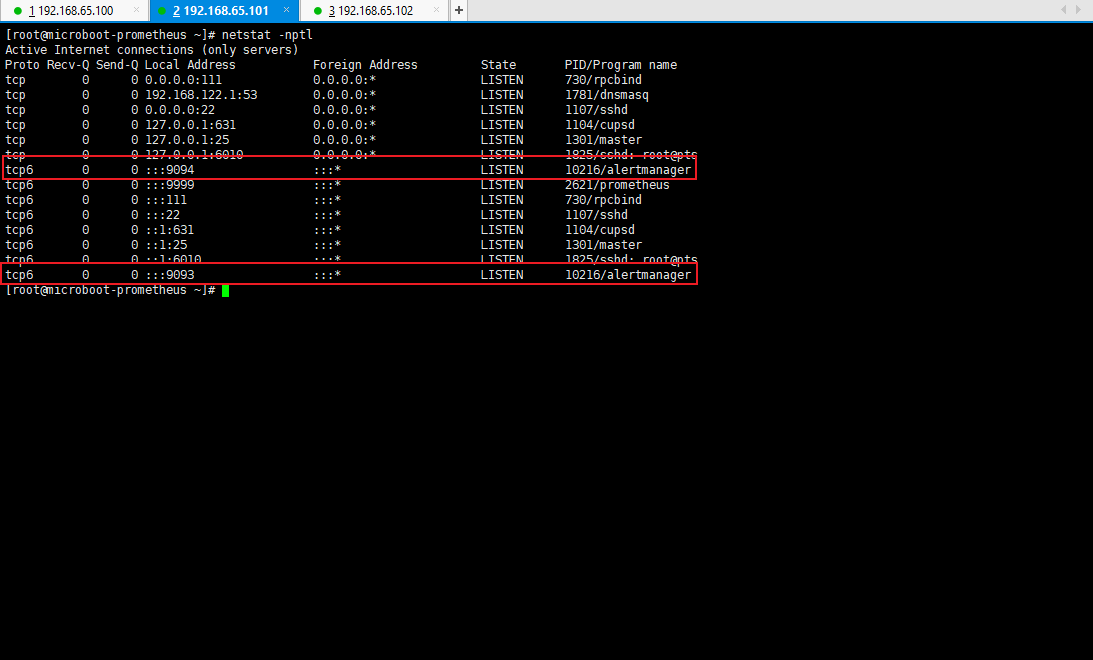
3.6.4 查看端口占用情况
- 命令:
netstat -nptl
3.6.5 整合 Prometheus
- 虽然现在已经配置好了 Alertmanager 警报服务,但是这些警报服务还需要和 Prometheus 进行整合,因为最终的数据的采集是由 Prometheus 进行负责的,但是 Alertmanager 会将所有可能存在的警报数据发送给警报进程。
- 修改 prometheus.yml 配置文件:
cd /usr/local/prometheus/
vim prometheus.yml
# my global configglobal:scrape_interval: 15s # Set the scrape interval to every 15 seconds. Default is every 1 minute.evaluation_interval: 15s # Evaluate rules every 15 seconds. The default is every 1 minute.# scrape_timeout is set to the global default (10s).# Alertmanager configurationalerting:alertmanagers:- static_configs:- targets:- localhost:9093 # *** 因为 Alertmanager 和 Prometheus 部署在同一台机器上,所以我们配置为 localhost 。# Load rules once and periodically evaluate them according to the global 'evaluation_interval'.rule_files:# - "first_rules.yml"# - "second_rules.yml"# 监控数据的抓取配置scrape_configs:- job_name: "prometheus" # 任务的名称# metrics_path defaults to '/metrics'# scheme defaults to 'http'.static_configs: # 任务的配置- targets: ["localhost:9999"] # 监控主机的地址- job_name: "node" # 任务的名称# metrics_path defaults to '/metrics'# scheme defaults to 'http'.static_configs: # 任务的配置,设置成 NodeExporter 服务器的具体地址- targets: ["192.168.65.100:9100"]- job_name: "microboot" # 任务的名称scrape_interval: 10s # 局部的抓取时间scrape_timeout: 5s # 抓取时间的超时时间metrics_path: '/actuator/prometheus' # 获取度量数据路径,默认为 '/metrics'# scheme defaults to 'http'.static_configs: # 任务的配置,设置成 Springboot 应用所在服务器的具体地址- targets: ["192.168.65.100:9090"]

- 此时已经实现所有服务的整合处理了,但是如果要想让这些服务正常的运转,那么就必须进行相关的规则配置,为了便于规则的存储,可以直接创建一个规则目录。
mkdir -pv rules
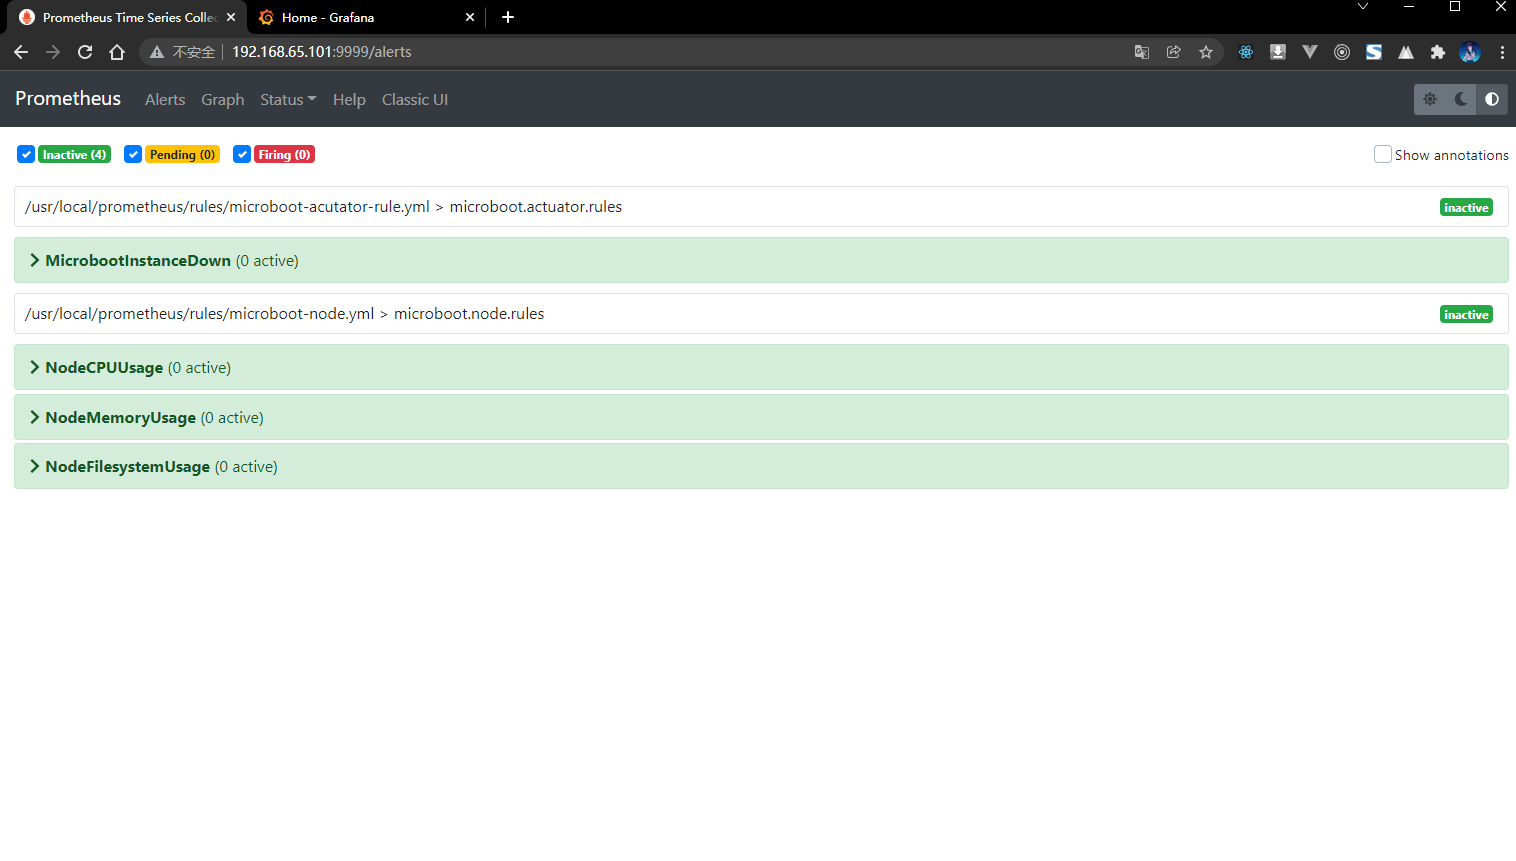
- 此时准备两个规则:一个是针对于微服务的规则,另一个是针对于节点状态的规则:
# 微服务的规则vim rules/microboot-acutator-rule.yml
groups: # 警告分组配置化- name: microboot.actuator.rules # 分组名称rules: # 报警规则- alert: MicrobootInstanceDown # 规则名称expr: up{job="microboot"} == 0 # 表达式for: 1m # 警告时间为 1 分钟labels: # 标签severity: warning # 警告等级annotations: # 警告注解description: "微服务 {{ $labels.instance }} 关闭" # 警告描述summary: "运行在 {{ $labels.instance }} 主机中的 {{ $labels.job }} 微服务已经关闭了!" # 警告摘要
# 节点状态的规则vim rules/microboot-node.yml
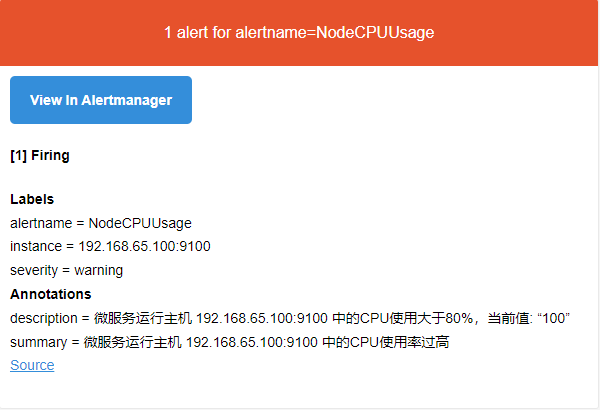
groups:- name: microboot.node.rulesrules:- alert: NodeCPUUsageexpr: 100 - (avg(irate(node_cpu_seconds_total{mode="idle"}[5m])) by (instance) * 100) > 80for: 2mlabels:severity: warningannotations:summary: "微服务运行主机 {{ $labels.instance }} 中的CPU使用率过高"description: "微服务运行主机 {{ $labels.instance }} 中的CPU使用大于80%,当前值: “{{ $value }}”"- alert: NodeMemoryUsageexpr: 100 - (node_memory_MemFree_bytes+node_memory_Cached_bytes+node_memory_Buffers_bytes) / node_memory_MemTotal_bytes * 100 > 80for: 2mlabels:severity: warningannotations:summary: "微服务运行主机 {{ $labels.instance }} 中的内存使用率过高"description: "微服务运行主机 {{ $labels.instance }} 内存使用大于 80%,当前值: {{ $value }}"- alert: NodeFilesystemUsageexpr: 100 - (node_filesystem_free_bytes{fstype=~"ext4|xfs"} / node_filesystem_size_bytes{fstype=~"ext4|xfs"} * 100) > 90for: 2mlabels:severity: warningannotations:summary: "微服务运行主机 {{ $labels.instance }}中的“{{ $labels.mountpoint }}” 分区使用过高"description: "微服务运行主机 {{ $labels.instance }} 中 {{ $labels.mountpoint }} 分区使用大于80%,当前值: {{ $value }}"

- 将规则配置到 Prometheus 的配置文件中:
vim prometheus.yml
# my global configglobal:scrape_interval: 15s # Set the scrape interval to every 15 seconds. Default is every 1 minute.evaluation_interval: 15s # Evaluate rules every 15 seconds. The default is every 1 minute.# scrape_timeout is set to the global default (10s).# Alertmanager configurationalerting:alertmanagers:- static_configs:- targets:- localhost:9093 # *** 因为 Alertmanager 和 Prometheus 部署在同一台机器上,所以我们配置为 localhost 。# 规则文件的配置rule_files:- "rules/*.yml"# - "second_rules.yml"# 监控数据的抓取配置scrape_configs:- job_name: "prometheus" # 任务的名称# metrics_path defaults to '/metrics'# scheme defaults to 'http'.static_configs: # 任务的配置- targets: ["localhost:9999"] # 监控主机的地址- job_name: "node" # 任务的名称# metrics_path defaults to '/metrics'# scheme defaults to 'http'.static_configs: # 任务的配置,设置成 NodeExporter 服务器的具体地址- targets: ["192.168.65.100:9100"]- job_name: "microboot" # 任务的名称scrape_interval: 10s # 局部的抓取时间scrape_timeout: 5s # 抓取时间的超时时间metrics_path: '/actuator/prometheus' # 获取度量数据路径,默认为 '/metrics'# scheme defaults to 'http'.static_configs: # 任务的配置,设置成 Springboot 应用所在服务器的具体地址- targets: ["192.168.65.100:9090"]

- 配置完成之后,可以检查一下当前的配置文件是否定义正确:
./promtool check config prometheus.yml
3.6.6 重启 Prometheus 的系统服务
- 命令:
systemctl restart prometheus
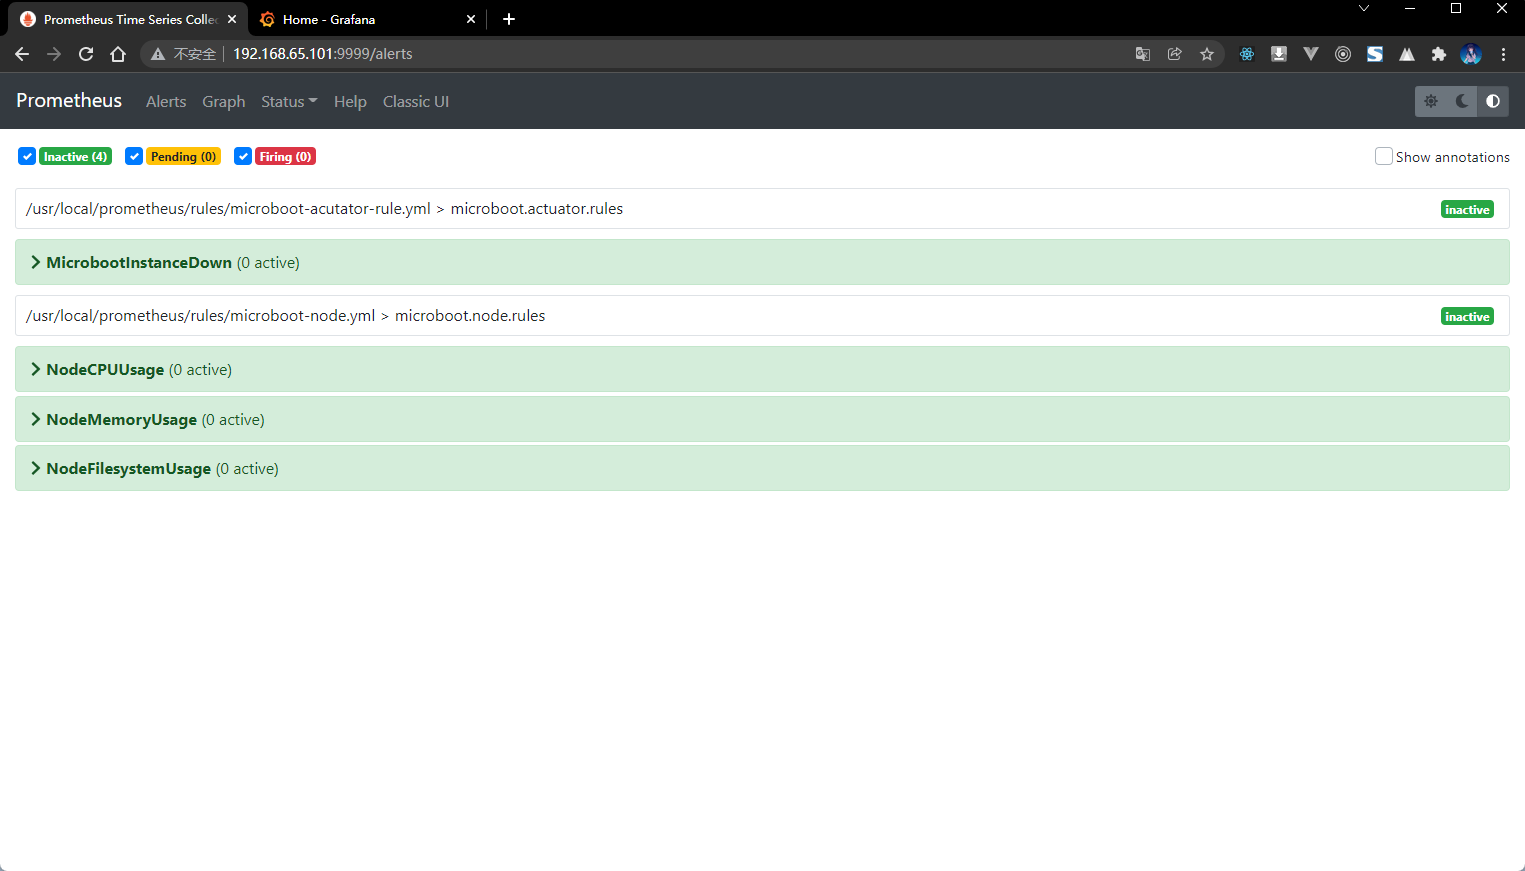
3.6.7 浏览器
- 通过浏览器查看 Prometheus 的服务:
3.7 警告触发测试
3.7.1 概述
- 所有的服务已经配置完成,随后就需要进行警报的触发操作,毕竟对于当前的服务节点来说都属于模拟节点,那么警报也是需要一些人为的干预来完成的。
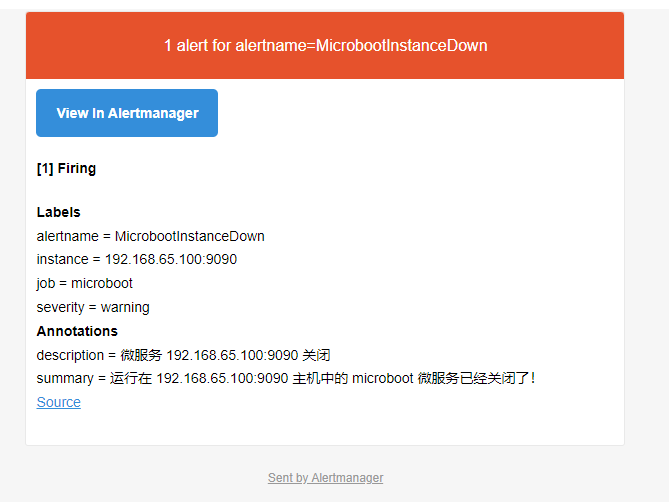
3.7.2 将微服务所在主机断电
- 将 192.168.65.100 的主机断电:
- 通过查看 Prometheus :
- 收到的邮件:
3.7.3 对微服务所在主机进行压测
- 微服务警报信息触发完成之后,随后就可以直接进行微服务主机以及对应的服务的重新启动了。
cd /opt
nohup java -jar micro-1.0-boot.jar > micro.log 2>&1 &
- 当微服务重新启动之后,Prometheus 就会自动监控到当前微服务的状态,自动的恢复到与之匹配的样式。
- 此时除了微服务的状态可以比较直观的测试之外,最麻烦的在于当前节点上的资源的测试,因为没有这么大的并发访问量,本次可以考虑使用 stress 工具来进行模拟。
- 下载 stress 工具:
wget https://download-ib01.fedoraproject.org/pub/epel/7/x86_64/Packages/s/stress-1.0.4-16.el7.x86_64.rpm -P /opt

- 安装 stress 工具:
cd /opt
rpm -ivh stress-1.0.4-16.el7.x86_64.rpm
- 测试 CPU 的占用率:
# 24 个进程,每个执行 600 秒退出stress -c 24 --timeout 600
- 测试内存的占用率:
# 启动 200 个消耗内存的进程,每个进程消耗 2000M 内存stress -m 200 --vm-bytes 2000M
- 测试磁盘的占用率:
# 启动 200 个消耗内存的进程,每个进程写入 2G 的文件stress -d 200 --hdd-bytes 2g

若有收获,就点个赞吧
0 人点赞
