- https://matplotlib.org/gallery/mplot3d/voxels.html#sphx-glr-gallery-mplot3d-voxels-py
- https://matplotlib.org/mpl_toolkits/mplot3d/tutorial.html
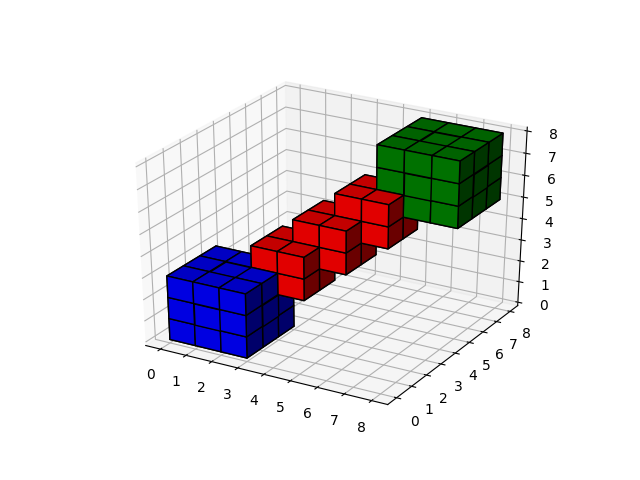
import matplotlib.pyplot as pltimport numpy as npfrom mpl_toolkits.mplot3d import Axes3D# prepare some coordinatesx, y, z = np.indices((16, 16, 16))# draw cuboids in the top left and bottom right corners, and a link between them#cube1 = (x < 230)& (x > 0) & (y < 200) & (y > 0) & (z < 170) & (z > 0)cube1 = (x > 3) & (x < 12) & (y > 4) & (y < 13) & (z > 5) & (z < 14)#cube2 = (x >= 5) & (y >= 5) & (z >= 5)#link = abs(x - y) + abs(y - z) + abs(z - x) <= 2# combine the objects into a single boolean arrayvoxels = cube1 # | cube2 | link# set the colors of each objectcolors = np.empty(voxels.shape, dtype=object)#colors[link] = 'red'colors[cube1] = 1#"gray"#'blue'#colors[cube2] = 'green'colors = np.random.random((16, 16, 16, 3))# and plot everythingfig = plt.figure(dpi=800)ax = Axes3D(fig) # 一个轴对象ax.grid()ax.text(-1, -1, -1, "(0, 0, 0)")ax.text(15, 15, 15, "(256, 256, 256)")ax.text(17, -1, -1, "(256, 0, 0)")ax.set_xlabel('X axis')ax.set_ylabel('Y axis')ax.set_zlabel('Z axis')ax.set_xticks([])ax.set_yticks([])ax.set_zticks([]) # 轴对象的设置标签方法ax.voxels(voxels, facecolors=colors, edgecolor='k')plt.savefig("3d.jpg")plt.show()

若有收获,就点个赞吧
0 人点赞
