- d3.axisTop(scale) 创建一个Axis对象
- d3.axisLeft(scale) 创建一个Axis对象
- d3.axisRight(scale) 创建一个Axis对象
- d3.axisBottom(scale) 创建一个Axis对象
- axis.scale([scale]) 为Axis对象设置scale
- axis.ticks(arguments…)
- axis.ticks([count[, specifier]])
- axis.ticks([interval[, specifier]])
- axis.tickArguments([arguments])
- axis.tickValues([values]) 设置刻度的值
- axis.tickFormat([format]) 格式化x轴刻度内容输出
- _
- axis.tickPadding([padding: number]); 设置刻度与线的距离
- axis.tickSize([size]) 设置内侧和外侧刻度的长度
- axis.tickSizeInner([size]) 设置内侧刻度的长度
- axis.tickSizeOuter([size]) 设置外侧刻度的长度
- <源码>">axis(context) <源码>
- 例子
d3.axisTop(scale) 创建一个Axis对象
d3.axisLeft(scale) 创建一个Axis对象
d3.axisRight(scale) 创建一个Axis对象
d3.axisBottom(scale) 创建一个Axis对象
axis.scale([scale]) 为Axis对象设置scale
axis.ticks(arguments…)
axis.ticks([count[, specifier]])
axis.ticks([interval[, specifier]])
axis.ticks(10);// 等价与axis.tickArguments([10]);axis.ticks(20, "s");// 等价与axis.tickArguments([20, "s"]);// 每隔 15 分钟生成一个刻度的时间比例尺:// 等价 axis.tickArguments([d3.timeMinute.every(15)]);axis.ticks(d3.timeMinute.every(15));
axis.tickArguments([arguments])
axis.tickValues([values]) 设置刻度的值
var xAxis = d3.axisBottom(x).tickValues([1, 2, 3, 5, 8, 13, 21]);
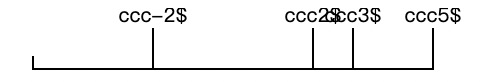
axis.tickFormat([format]) 格式化x轴刻度内容输出
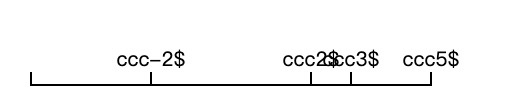
axis.tickFormat(d3.format(",.0f"));// 等价axis.ticks(10, ",f");axis.tickFormat(function (v) {return 'ccc' + v + '$'});
_
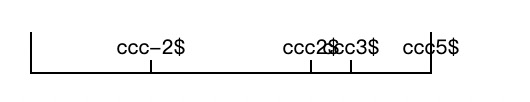
axis.tickPadding([padding: number]); 设置刻度与线的距离
 -20的效果
axis.tickPadding(-20);
axis.tickSize([size]) 设置内侧和外侧刻度的长度
axis.tickSize(20)
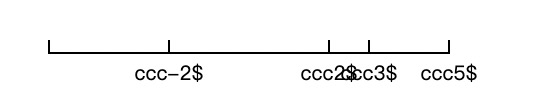
axis.tickSizeInner([size]) 设置内侧刻度的长度
 axis.tickSizeInner(20)
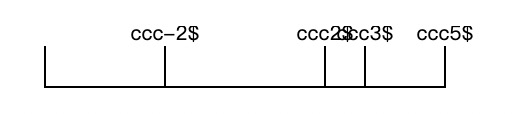
axis.tickSizeOuter([size]) 设置外侧刻度的长度
 axis.tickSizeOuter(20)
axis(context) <源码>
将坐标轴渲染到指定的 context, context 可能是一个包含SVG元素的 selection(SVG 或者 G 元素) 也可能是一个 transition.
例子
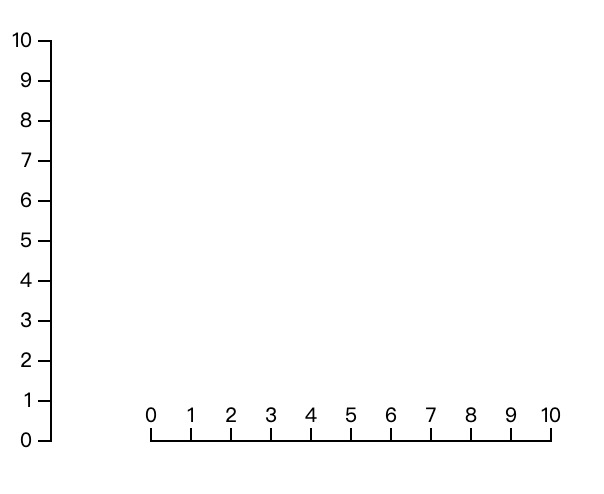
<!DOCTYPE html><html><head><title>d3 5.15.1</title><style>* {margin: 0;padding: 0;}.text {text-indent: 2em;}.pre {white-space: pre-wrap;background-color: #eee;border: 1px solid #ccc;}</style><script src="../lib/d3.js" type="text/javascript"></script></head><body><a href="../index.html">首页</a><br /><script>var h = 200;var w = 50;var offsetX = 50;var offsetY = 30;scale = d3.scaleLinear().domain([10, 0]).range([0, h]);axis = d3.axisLeft().scale(scale);d3.select("body").append("svg").attr("width", w).attr("height", h + offsetX).append("g").attr("transform", `translate(${offsetX / 2}, ${offsetY})`).call(axis);w = 200;h = 50var scale = d3.scaleLinear().domain([0, 10]).range([0, w]);var axis = d3.axisTop(scale);d3.select("body").append("svg").attr("width", w + offsetX).attr("height", h).append("g").attr("transform", `translate(${offsetX / 2}, ${offsetY})`).call(axis);</script></body></html>

若有收获,就点个赞吧
0 人点赞
