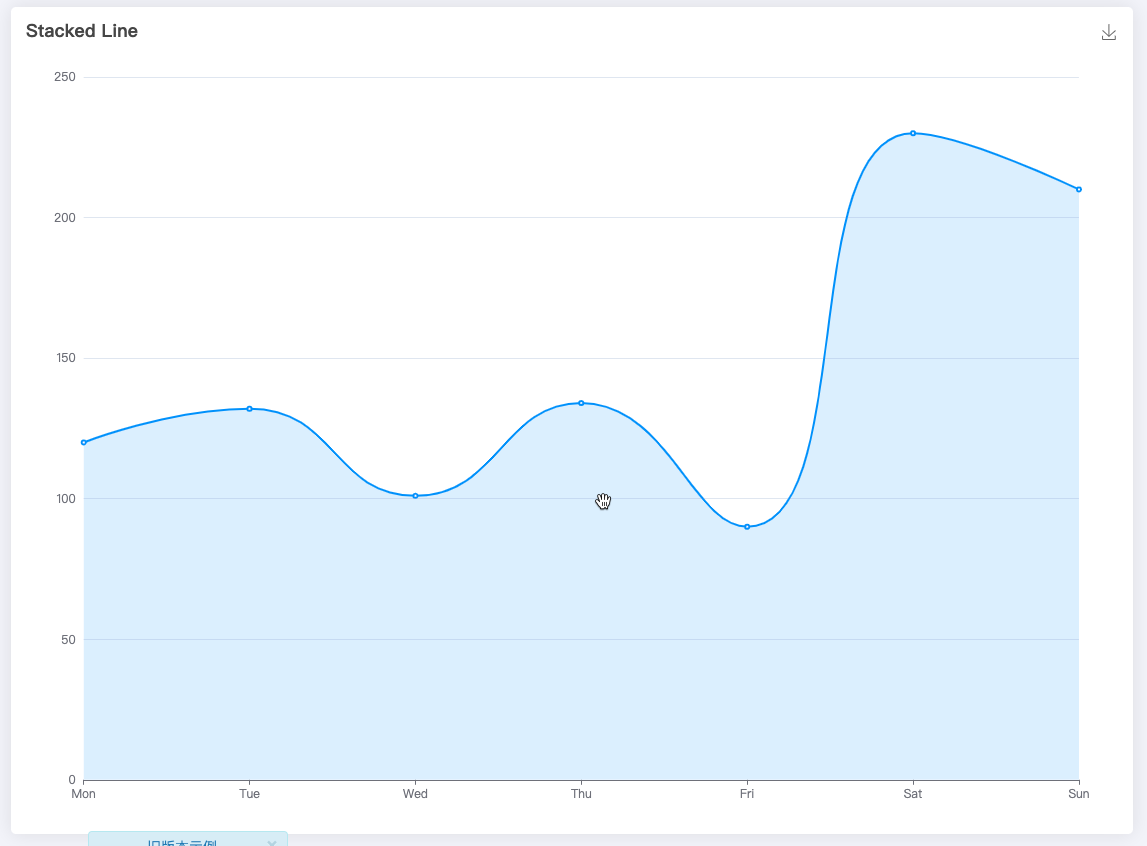
折线区域图
option = {title: {text: 'Stacked Line'},tooltip: {trigger: 'axis'},grid: {left: '3%',right: '4%',bottom: '3%',containLabel: true},toolbox: {feature: {saveAsImage: {}}},xAxis: {type: 'category',boundaryGap: false,data: ['Mon', 'Tue', 'Wed', 'Thu', 'Fri', 'Sat', 'Sun'],// 刻度尺对应文案设置axisLabel: {// @ts-ignoremargin: 15,},// 刻度尺长度设置axisTick: {length: 10,lineStyle: {type: 'soild',},}},yAxis: {type: 'value',splitLine: { // 刻度虚线show: true,lineStyle: {color: "#085387" // "rgba(0,0,0, 0.1)"}},},series: [{type: 'line',stack: 'Total',areaStyle: {normal: {color: 'rgba(52, 144, 255, 0.2)' // 区域的颜色}},lineStyle: { // 线条的宽度width: 1},showSymbol: true, // 折线上的点位显示itemStyle:{normal: {color: '#3490ff', // 改变点的颜色lineStyle: {color: "#3490ff" // 改变线条的颜色}}},smooth: true,data: [120, 132, 101, 134, 90, 230, 210]}]};
import React from 'react';import * as echarts from 'echarts';interface IProps {height?: number;xAxisData: string[];seriesData: number[];}(function() {const throttle = function(type, name, obj) {obj = obj || window;var running = false;var func = function() {if (running) { return; }running = true;requestAnimationFrame(function() {obj.dispatchEvent(new CustomEvent(name));running = false;});};obj.addEventListener(type, func);};/* init - you can init any event */throttle("resize", "optimizedResize");})();export class EchartsLine extends React.Component<IProps> {echartsRef: HTMLDivElement | null = null;componentDidMount() {const myChart = echarts.init((this.echartsRef as HTMLDivElement));const option = {tooltip: {trigger: 'axis'},grid: {left: '3%',right: '4%',bottom: '3%',containLabel: true},toolbox: {feature: {saveAsImage: {}}},xAxis: {type: 'category',boundaryGap: false,data: this.props.xAxisData || ['Mon', 'Tue', 'Wed', 'Thu', 'Fri', 'Sat', 'Sun']},yAxis: {type: 'value'},series: [{type: 'line',stack: 'Total',areaStyle: {normal: {color: 'rgba(52, 144, 255, 0.2)'}},itemStyle: {normal: {color: '#3490ff',lineStyle: {color: '#3490ff'}}},smooth: true,data: this.props.seriesData || [120, 132, 101, 134, 90, 230, 210]}]};myChart.setOption(option);window.addEventListener("optimizedResize", () => {this.echartsPie.resize();});}render() {return <div style={{ height: this.props.height || 300 }} ref={(ref) => {this.echartsRef = ref;}} className='echarts-line' />}}

若有收获,就点个赞吧
0 人点赞
