《深度学习之Pytorch实战计算机视觉》阅读笔记 第五章:Python基础
1. Python基础
https://github.com/Davelmk/Python-Code
2. Numpy
创建多维数组
import numpy as npnp.array([1,2,3],[4,5,6])np.ones([2,3])np.zeros([2,3])np.empty([2,3])
常用属性
1)ndim:返回统计的数组维数,即维度的常量
2)shape:返回数组的维度值
3)size:返回要统计数组中元素的总数量
4)dtype:返回数组元素的数据类型
5)itemsize:返回数组中每个元素的字节大小
- 基本操作
+,-,*,/- 自身运算:min(数组中最小元素);max(数组中最大元素);sum(对数组中所有的元素进行求和);exp(对数组中所有元素进行指数运算);sqrt(对数组中所有的元素进行平方根运算);square(对数组中所有元素进行平方运算)
axis可对参数进行不同的设置,axis=0针对数组的列,axis=1针对数组的行
随机数组
- seed:随机因子
- rand:生成一个在[0,1]范围内满足均匀分布的随机样本数
- randn:生成一个满足平均值为0且方差为1的正太分布随机样本数
- randint:在给定的范围内生成类型为整数的随机样本数
- binominal:生成一个维度指定且满足二项分布的随机样本数
- beta:生成一个指定维度且满足beta分布的随机样本数
- normal:生成一个指定维度且满足高斯正态分布的随机样本数
import numpy as npnp.random.seed(42)print(np.random.rand(2,3))print(np.random.randn(2,3))print(np.random.randint(l,10))print(np.random.binomial(6,1))print(np.random.beta(2,3))print(np.random.norma1(2,3))
索引、切片、迭代
import numpy as npa= np.array([[1 , 2 , 3], [4 , 5, 6], [7 , 8 , 9]])print (a) #输出整个数组print ("-" * 10)print(a[1]) #输出指定维度的数据print ("-"*10)print(a[0:2 , 1:3]) #输出指定维度的数据
3. Matplotlib
- 创建图 ```python import matplotlib.pyplot as plt import numpy as np
np.random.seed(42) x=np.random.randn(30) plt.plot(x,’r—o’)
- 图的属性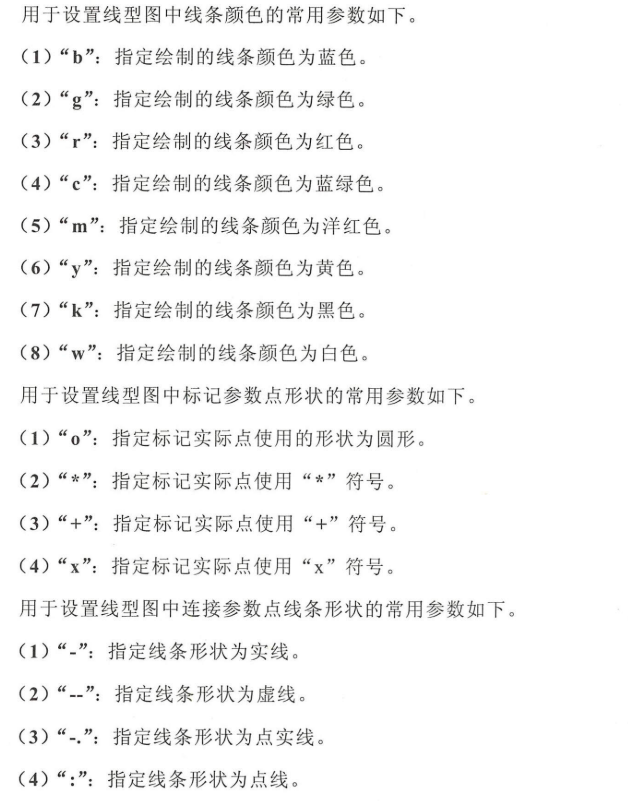- 标签和图例```pythonimport matplotlib.pyplot as pltimport numpy as npnp.random.seed(42)x=np.random.randn(30)y=np.random.randn(30)plt.title('Example')plt.xlabel('X')plt.ylabel('Y')
- 子图 ```python import matplotlib.pyplot as plt import numpy as np
a=np.random.randn(30) b=np.random.randn(30) c=np.random.randn(30) d=np.random.randn(30)
fig=plt.figure() ax1=fig.add_subplot(2,2,1) ax2=fig.add_subplot(2,2,2) ax3=fig.add_subplot(2,2,3) ax4=fig.add_subplot(2,2,4)
A,=ax1.plot(a,’r—o’) ax1.legend([A],[“A”]) B,=ax1.plot(b,’b-*’) ax2.legend([B],[“B”]) C,=ax3.plot(c,’g-.+’) ax3.legend([C],[“C”]) D,=ax4.plot(d,’m:x’) ax4.legend([D],[“D”]) ```

若有收获,就点个赞吧
0 人点赞
