一.k-近邻算法概述
简单地说,k-近邻算法采用测量不同特征值之间的距离方法进行分类。 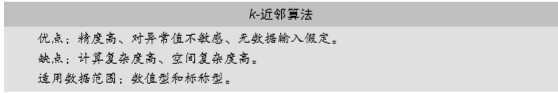
1.准备:使用Python导入数据
from numpy import *import operatordef createDataSet():group = array([[1.0,1.1],[1.0,1.0],[0,0],[0,0.1]])labels = ['A','A','B','B']return group,labels
Microsoft Windows [版本 10.0.18362.476](c) 2019 Microsoft Corporation。保留所有权利。C:\Users\Joish>C:\Users\Joish\AppData\Local\Programs\Python\Python37-32\python.exePython 3.7.4 (tags/v3.7.4:e09359112e, Jul 8 2019, 19:29:22) [MSC v.1916 32 bit (Intel)] on win32Type "help", "copyright", "credits" or "license" for more information.>>> import kNN>>> group,labels = kNN.createDataSet()>>> grouparray([[1. , 1.1],[1. , 1. ],[0. , 0. ],[0. , 0.1]])>>> labels['A', 'A', 'B', 'B']>>>
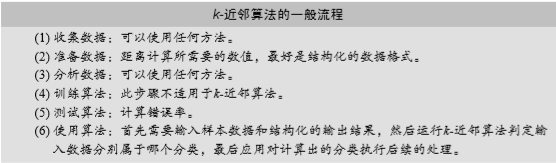
2.实施kNN算法
对未知类别属性的数据集中的每个点依次执行以下操作:
(1) 计算已知类别数据集中的点与当前点之间的距离;
(2) 按照距离递增次序排序;
(3) 选取与当前点距离最小的k个点;
(4) 确定前k个点所在类别的出现频率;
(5) 返回前k个点出现频率最高的类别作为当前点的预测分类。
from numpy import *import operatordef createDataSet():group = array([[1.0,1.1],[1.0,1.0],[0,0],[0,0.1]])labels = ['A','A','B','B']return group,labelsdef classify0(inX, dataSet, labels, k):dataSetSize = dataSet.shape[0]diffMat = tile(inX, (dataSetSize,1)) - dataSetsqDiffMat = diffMat**2sqDistances = sqDiffMat.sum(axis=1)distances = sqDistances**0.5sortedDisIndicies = distances.argsort()classCount={}for i in range(k):voteIlabel = labels[sortedDistIndicies[i]]classCount[voteIlabel] = classCount.get(voteIlabel,0) + 1sortedClassCount = sorted(classCount.items(),key=operator.itemgetter(1), reverse=True)return sortedClassCount[0][0]
tile()函数:
https://blog.csdn.net/qq_38669138/article/details/79085700
二.示例:使用k-近邻算法改进约会网站的配对效果
def file2matrix(filename):fr = open(filename)arrayOLines = fr.readlines()numberOfLines = len(arrayOLines)returnMat = zeros((numberOfLines, 3))classLabelVector = []index = 0for line in arrayOLines:line = line.strip()listFromLine = line.split('\t')returnMat[index, :] = listFromLine[0:3]classLabelVector.append(basestring(listFromLine[-1]))index += 1return returnMat, classLabelVector
>>> reload kNN>>> datingDataMat, datingLabels = kNN.file2matrix('datingTestSet2.txt')>>> import matplotlib>>> import matplotlib.pyplot as plt>>> fig = plt.figure()>>> ax = fig.add_subplot(111)>>> from numpy import *>>> ax.scatter(datingDataMat[:,1], datingDataMat[:,2], 15.0*array(datingLabels), 15.0*array(datingLabels))>>> plt.show()
def autoNorm(dataSet):minVals = dataSet.min(0)maxVals = dataSet.max(0)ranges = maxVals - minValsnormDataSet = np.zeros(np.shape(dataSet))m = dataSet.shape[0]normDataSet = dataSet - np.tile(minVals, (m, 1))normDataSet = normDataSet/np.tile(ranges, (m, 1))return normDataSet, ranges, minVals
def datingClassTest():hoRatio = 0.50datingDataMat, datingLabels = file2matrix(datingTestSet.txt')normMat, ranges, minVals = autoNorm(datingDataMat)m = normMat.shape[0]numTestVecs = int(m * hoRatio)errorCount = 0.0for i in range(numTestVecs):classifierResult = classify0(normMat[i, :], normMat[numTestVecs:m, :],datingLabels[numTestVecs:m], 3)print("the classifier came back with: %d, the real answer is: %d" % (classifierResult, datingLabels[i]))if classifierResult != datingLabels[i]:errorCount += 1.0print("the total error rate is: %f" % (errorCount / float(numTestVecs)))print(errorCount)
def classifyPerson():resultList = ['not at all', 'in small doses', 'in large doses']percentTats = float(input("percentage of time spent playing video games ?"))ffMiles = float(input("frequent filer miles earned per year?"))iceCream = float(input("liters of ice cream consumed per year?"))datingDataMat, datingLables = file2matrix('G:/python/machinelearninginaction/Ch02/datingTestSet2.txt')normMat ,ranges, minVals = autoNorm(datingDataMat)inArr = np.array([ffMiles, percentTats, iceCream])classifierResult = classify0((inArr-minVals)/ranges, normMat, datingLables, 3)print ("You will probably like this person: ", resultList[classifierResult - 1])
注:遇到的坑实在太多,运行起来出了很多问题,至今无法一一解决,还需要再思考一下。

若有收获,就点个赞吧
0 人点赞
