数据预处理
data_reader
from csv import readerdef read_csv(name_of_file_to_be_read):dataset = list()with open(name_of_file_to_be_read, 'r') as file:every_line_of_file = reader(file)for line in every_line_of_file:if not line:continuedataset.append(line)return datasetdef convert_string_to_float(dataset, column):dataset = dataset[1:]for row in dataset:row[column] = float(row[column].strip())
rescaling
import data_readerdataset = data_reader.read_csv('diabetes.csv')for i in range(len(dataset[0])):data_reader.convert_string_to_float(dataset, i)dataset = dataset[1:]def find_max_and_min_in_dataset(dataset):max_and_min = list()for i in range(len(dataset[0])):col_values = [row[i] for row in dataset]value_max = max(col_values)value_min = min(col_values)max_and_min.append([value_max, value_min])return max_and_mindef max_min_normalization(dataset, max_and_min):for row in dataset:for i in range(len(row)):row[i] = (row[i] - max_and_min[i][1])/(max_and_min[i][0] - max_and_min[i][1])def find_mean_of_dataset(dataset):means = list()for i in range(len(dataset[0])):col_values = [row[i] for row in dataset]mean = sum(col_values)/float((len(dataset)))means.append(mean)return meansdef calculate_standard_deviation_of_dataset(dataset, means):standard_deviations = list()for i in range(len(dataset[0])):variance = [pow(row[i] - means[i], 2) for row in dataset]standard_deviation = pow(sum(variance)/float((len(variance)-1)), 0.5)standard_deviations.append(standard_deviation)return standard_deviationsdef standardization(dataset, means, standard_deviations):for row in dataset:for i in range(len(row)):row[i] = (row[i] - means[i])/standard_deviations[i]mean_list = find_mean_of_dataset(dataset)standard_deviation_list = calculate_standard_deviation_of_dataset(dataset, mean_list)standardization(dataset, mean_list, standard_deviation_list)print(dataset)
train_test_split
from random import seedfrom random import randrangedef train_test_split(dataset, train_proportion = 0.6):train_set = list()train_size = train_proportion * len(dataset)dataset_copy = list(dataset)while len(train_set) < train_size:random_choose = randrange(len(dataset_copy))train_set.append(dataset_copy.pop(random_choose))return train_set, dataset_copy
模型评估
k_fold_cross_validation
from random import seedfrom random import randrangedef k_fold(dataset, k = 10):basket_for_splitted_data = list()fold_size = int(len(dataset)/k)dataset_copy = list(dataset)for i in range(k):choosen_fold = list()while len(choosen_fold) < fold_size:random_choose = randrange(len(dataset_copy))choosen_fold.append(dataset_copy.pop(random_choose))basket_for_splitted_data.append(choosen_fold)return basket_for_splitted_dataseed(888)dataset = [[1], [2], [3], [4], [5], [6], [7], [8], [9], [10]]k_fold_split = k_fold(dataset, 5)print(k_fold_split)
calculate_accuracy
def calculate_accuracy_of_prediction(actual_data, predicted_data):correct_num = 0for i in range(len(actual_data)):if actual_data[i] == predicted_data[i]:correct_num += 1return correct_num/len(actual_data)actual_data = [0,0,0,0,0,1,1,1,1,1]predicted_data = [1,1,1,1,1,0,0,0,0,1]print(calculate_accuracy_of_prediction(actual_data, predicted_data))
confusion_matrix
def confusion_matrix(actual_data, predicated_data):unique_calss_in_data = set(actual_data)matrix = [list() for x in range(len(unique_calss_in_data))]for i in range(len(unique_calss_in_data)):matrix[i] = [0 for x in range(len(unique_calss_in_data))]indexing_class = dict()for i, class_value in enumerate(unique_calss_in_data):indexing_class[class_value] = ifor i in range(len(actual_data)):col = indexing_class[actual_data[i]]row = indexing_class[predicted_data[i]]matrix[row][col] += 1return unique_calss_in_data, matrixdef pretty_matrix(unique_calss_in_data, matrix):print('Actual ' + ' '.join(str(x) for x in unique_calss_in_data))print('Predicted—-—-—-—-—-—-—-—-—-—-—-—-—-—-—-—-—-—-—-—-')for i, x in enumerate(unique_calss_in_data):print(' {} | {}'.format(x, ' '.join(str(y) for y in matrix[i])))actual_data = [0, 2, 0, 0, 0, 1, 1, 5, 2, 1]predicted_data = [2, 0, 2, 0, 1, 0, 0, 0, 0, 1]unique_calss_in_data, matrix = confusion_matrix(actual_data, predicted_data)pretty_matrix(unique_calss_in_data, matrix)
MAE法与RMSE法
对于回归问题,最简单的检测误差方法:
平均绝对误差
def calculate_MAE(predicted_data, actual_data):sum_of_error = 0for i in range(len(predicted_data)):sum_of_error += abs(predicted_data[i] - actual_data[i])return sum_of_error/len(predicted_data)actual_data = range(1, 11)predicted_data = [2, 4, 3, 5, 4, 6, 5, 7, 6, 8]calculate_MAE(predicted_data, actual_data)
均方根误差
def calculate_RMSE(predicted_data, actual_data):sum_of_error = 0for i in range(len(predicted_data)):sum_of_error += pow(predicted_data[i] - actual_data[i], 2)return pow(sum_of_error/len(predicted_data), 0.5)actual_data = range(1, 11)predicted_data = [2, 4, 3, 5, 4, 6, 5, 7, 6, 8]calculate_RMSE(predicted_data, actual_data)
随机预测算法建立基准模型
Random Prediction Algorithm
def Random_Prediction_Algorithm(training_data, testing_data):values = [row[-1] for row in training_data] # list is unhashableunique_values = list(set(values))randomly_predicted_data = list()for row in testing_data:index = randrange(len(unique_values))randomly_predicted_data.append(unique_values[index])return randomly_predicted_dataseed(888)training_data = [[0], [1], [2], [3], [2], [1], [0], [0], [1], [2]]testing_data = [[None], [None], [None], [None], [None]]predictions = Random_Prediction_Algorithm(training_data, testing_data)print(predictions)
返回:
[0, 3, 3, 3, 3]
ZeroR Algorithm Classification
def ZeroR_Algorithm_Classification(training_data, testing_data):values = [row[-1] for row in training_data]highest_counts = max(set(values), key = values.count)ZeroR_Prediction = [highest_counts for i in range(len(testing_data))] # 重复最大值return ZeroR_Predictionseed(888)training_data = [[0], [1], [2], [3], [2], [1], [0], [0], [1], [2]]testing_data = [[None], [None], [None], [None], [None]]predictions = ZeroR_Algorithm_Classification(training_data, testing_data)print(predictions)
返回:
[0, 0, 0, 0, 0]
ZeroR Algorithm Regression
def ZeroR_Algorithm_Regression(training_data, testing_data):values = [row[-1] for row in training_data]prediction = sum(values)/len(values)ZeroR_prediction = [prediction for i in range(len(testing_data))]return ZeroR_predictionseed(888)training_data = [[1], [2],[3], [4], [5], [6], [7], [8], [9], [10]]testing_data = [[None], [None], [None], [None], [None], [None], [None], [None], [None], [None]]predictions = ZeroR_Algorithm_Regression(training_data, testing_data)print(predictions)
返回:
[5.5, 5.5, 5.5, 5.5, 5.5, 5.5, 5.5, 5.5, 5.5, 5.5]
Python与统计学
描述性统计与推断性统计
Descriptive stastics
- 平均数
- 中位数
Statistical inference
收集全量数据成本过高,所以需要以样本推断整体
sample —- sampliing —- statistic —- estimate —- hypothesis test —- > all(parameter)
Estimate:
- Point estimation (sample size:n=100
) - Confidence interval (confidence level:95%
)和- “95%” 和 “1.96”
Hypothesis test:
- 提出假设$H{0},H{a}$
is the Hypothesis you want to rejectis the Hypothesis you want to accept- Example:
- one tail:
 - two tails:

- one tail:
- Calculation
 - Draw distribution
- What is your confidence?
N-1与贝塞尔校正
Population Y:

Sample X:


随机生成10万个总体数据
%matplotlib inlineimport matplotlib.pyplot as pltfrom IPython.core.pylabtools import figsizeimport pandas as pdimport numpy as np
np.random.seed(42)Population = 100000Population = pd.Series(np.random.randint(1, 11, Population))
Population.head()
0 71 42 83 54 7dtype: int32
随机抽取500次样本
samples = {}sample_size = 30num_of_samples = 500for i in range(num_of_samples):samples[i] = Population.sample(sample_size).reset_index(drop = True)
samples = pd.DataFrame(samples)
samples
| 0 | 1 | 2 | 3 | 4 | 5 | 6 | 7 | 8 | 9 | … | 490 | 491 | 492 | 493 | 494 | 495 | 496 | 497 | 498 | 499 | |
|---|---|---|---|---|---|---|---|---|---|---|---|---|---|---|---|---|---|---|---|---|---|
| 0 | 3 | 4 | 1 | 3 | 3 | 7 | 6 | 8 | 6 | 9 | … | 4 | 6 | 5 | 3 | 4 | 8 | 3 | 9 | 10 | 9 |
| 1 | 2 | 7 | 6 | 9 | 9 | 2 | 10 | 5 | 10 | 10 | … | 5 | 7 | 9 | 6 | 3 | 9 | 9 | 9 | 2 | 2 |
| 2 | 2 | 1 | 5 | 3 | 7 | 3 | 4 | 4 | 7 | 7 | … | 8 | 1 | 5 | 8 | 4 | 10 | 8 | 4 | 9 | 10 |
| 3 | 3 | 10 | 2 | 6 | 9 | 7 | 10 | 3 | 4 | 2 | … | 4 | 3 | 2 | 4 | 5 | 2 | 5 | 7 | 8 | 6 |
| 4 | 1 | 3 | 5 | 10 | 10 | 5 | 9 | 2 | 3 | 3 | … | 2 | 4 | 10 | 9 | 1 | 9 | 3 | 9 | 5 | 4 |
| 5 | 5 | 5 | 6 | 2 | 1 | 6 | 9 | 9 | 3 | 6 | … | 9 | 1 | 9 | 9 | 7 | 10 | 2 | 4 | 5 | 7 |
| 6 | 6 | 2 | 1 | 3 | 1 | 9 | 4 | 2 | 1 | 4 | … | 10 | 7 | 1 | 10 | 9 | 5 | 9 | 10 | 8 | 2 |
| 7 | 2 | 10 | 5 | 4 | 2 | 7 | 2 | 1 | 7 | 1 | … | 4 | 2 | 4 | 3 | 4 | 9 | 3 | 2 | 1 | 1 |
| 8 | 1 | 3 | 5 | 9 | 10 | 1 | 1 | 3 | 6 | 6 | … | 8 | 6 | 9 | 10 | 7 | 7 | 6 | 10 | 8 | 6 |
| 9 | 10 | 3 | 5 | 2 | 1 | 3 | 1 | 2 | 1 | 9 | … | 5 | 1 | 1 | 7 | 4 | 3 | 8 | 5 | 1 | 1 |
| 10 | 10 | 1 | 8 | 8 | 1 | 3 | 5 | 2 | 7 | 5 | … | 6 | 7 | 3 | 9 | 5 | 7 | 10 | 9 | 1 | 5 |
| 11 | 5 | 2 | 5 | 6 | 3 | 5 | 6 | 5 | 5 | 3 | … | 9 | 1 | 7 | 9 | 6 | 9 | 1 | 8 | 6 | 2 |
| 12 | 5 | 9 | 7 | 10 | 7 | 9 | 1 | 6 | 8 | 8 | … | 8 | 7 | 1 | 2 | 9 | 6 | 7 | 10 | 5 | 7 |
| 13 | 9 | 1 | 6 | 5 | 1 | 1 | 3 | 1 | 9 | 2 | … | 9 | 1 | 9 | 10 | 7 | 10 | 6 | 6 | 6 | 7 |
| 14 | 4 | 3 | 2 | 2 | 6 | 5 | 9 | 7 | 1 | 8 | … | 9 | 7 | 6 | 9 | 4 | 4 | 9 | 1 | 3 | 3 |
| 15 | 8 | 8 | 7 | 2 | 5 | 3 | 9 | 4 | 2 | 6 | … | 5 | 8 | 3 | 5 | 2 | 2 | 2 | 6 | 2 | 2 |
| 16 | 4 | 7 | 2 | 6 | 3 | 10 | 3 | 6 | 6 | 3 | … | 4 | 9 | 8 | 1 | 8 | 10 | 4 | 8 | 9 | 7 |
| 17 | 7 | 5 | 1 | 1 | 10 | 8 | 8 | 9 | 4 | 3 | … | 9 | 6 | 4 | 5 | 6 | 1 | 7 | 10 | 2 | 10 |
| 18 | 6 | 4 | 4 | 7 | 1 | 7 | 1 | 1 | 7 | 2 | … | 2 | 1 | 7 | 1 | 8 | 9 | 5 | 6 | 6 | 5 |
| 19 | 5 | 8 | 7 | 10 | 7 | 10 | 1 | 4 | 9 | 5 | … | 2 | 3 | 10 | 2 | 8 | 10 | 4 | 7 | 4 | 6 |
| 20 | 10 | 6 | 6 | 5 | 5 | 3 | 4 | 2 | 1 | 7 | … | 6 | 2 | 7 | 6 | 8 | 4 | 10 | 1 | 9 | 3 |
| 21 | 8 | 3 | 9 | 2 | 3 | 2 | 6 | 5 | 5 | 4 | … | 6 | 7 | 5 | 9 | 7 | 5 | 9 | 5 | 2 | 10 |
| 22 | 10 | 6 | 2 | 9 | 8 | 6 | 6 | 7 | 2 | 6 | … | 8 | 1 | 1 | 5 | 8 | 8 | 3 | 4 | 10 | 1 |
| 23 | 9 | 5 | 4 | 9 | 9 | 10 | 7 | 1 | 6 | 2 | … | 7 | 1 | 4 | 9 | 3 | 4 | 3 | 10 | 2 | 4 |
| 24 | 7 | 2 | 4 | 10 | 3 | 9 | 9 | 1 | 6 | 2 | … | 6 | 3 | 4 | 4 | 8 | 7 | 8 | 1 | 3 | 7 |
| 25 | 5 | 7 | 2 | 7 | 5 | 2 | 1 | 10 | 1 | 6 | … | 9 | 2 | 3 | 9 | 2 | 6 | 10 | 2 | 6 | 9 |
| 26 | 7 | 1 | 4 | 3 | 6 | 5 | 8 | 5 | 3 | 2 | … | 6 | 6 | 7 | 4 | 6 | 1 | 1 | 9 | 8 | 6 |
| 27 | 8 | 2 | 5 | 10 | 3 | 3 | 4 | 6 | 2 | 5 | … | 8 | 5 | 2 | 6 | 1 | 8 | 6 | 6 | 1 | 6 |
| 28 | 9 | 1 | 2 | 6 | 2 | 4 | 7 | 3 | 9 | 10 | … | 2 | 5 | 10 | 10 | 10 | 7 | 8 | 2 | 10 | 5 |
| 29 | 8 | 7 | 3 | 2 | 3 | 10 | 10 | 3 | 7 | 7 | … | 7 | 9 | 4 | 5 | 6 | 3 | 10 | 7 | 2 | 8 |
30 rows × 500 columns
# Delta degree of freedom# ddof = 0, divided by n; ddof = 1, divided by n-1biased_samples = samples.var(ddof = 0).to_frame()biased_samples.head()
| 0 | |
|---|---|
| 0 | 7.965556 |
| 1 | 7.782222 |
| 2 | 4.632222 |
| 3 | 9.410000 |
| 4 | 9.560000 |
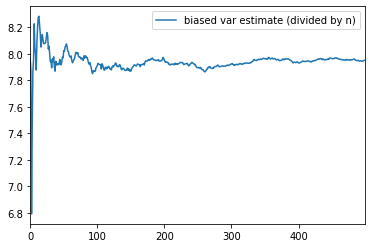
biased_samples = biased_samples.expanding().mean()biased_samples.head()
| 0 | |
|---|---|
| 0 | 7.965556 |
| 1 | 7.873889 |
| 2 | 6.793333 |
| 3 | 7.447500 |
| 4 | 7.870000 |
biased_samples.columns = ['biased var estimate (divided by n)']biased_samples.plot()
<matplotlib.axes._subplots.AxesSubplot at 0x2660c0b7b70>
unbiased_samples = samples.var(ddof = 1).to_frame()unbiased_samples.head()
| 0 | |
|---|---|
| 0 | 8.240230 |
| 1 | 8.050575 |
| 2 | 4.791954 |
| 3 | 9.734483 |
| 4 | 9.889655 |
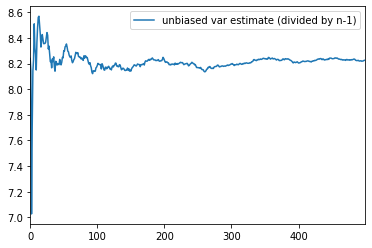
unbiased_samples = unbiased_samples.expanding().mean()unbiased_samples.head()
| 0 | |
|---|---|
| 0 | 8.240230 |
| 1 | 8.145402 |
| 2 | 7.027586 |
| 3 | 7.704310 |
| 4 | 8.141379 |
unbiased_samples.columns = ['unbiased var estimate (divided by n-1)']unbiased_samples.plot()
<matplotlib.axes._subplots.AxesSubplot at 0x2660c3e6588>
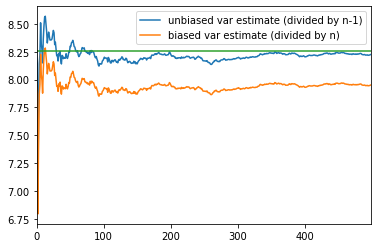
ax = unbiased_samples.plot()biased_samples.plot(ax =ax)real_population_variance = pd.Series(Population.var(ddof = 0), index = samples.columns)real_population_variance.plot()
<matplotlib.axes._subplots.AxesSubplot at 0x2660c487f98>
利用假设性检验,检验相关性
T-Test:相关性是否靠谱?
第一步_立无相关性靶子
two tails test


第二步_计算T统计量
自由度
当以样本的统计量来估计总体的参数时,样本中独立或能自由变化的数据的个数
第三步_画分布,查T分布表
第四步_做判断
局限性
1. 非线性相关2. 异常值3. 伪相关

若有收获,就点个赞吧
0 人点赞
