数据集简介
- 纽约出租车协会提供了两百万超出租车行车记录
- 根据载客情况,准确回归模型预测毎一单出车用时
- 预测纽约出租车用时,有助于在行程开始前对车费的预测(有意思的是,滴滴是在行车结束后计算车费的)
分析步骤
数据读取
- 读取训练集和测试集
- 读取行程数据
- 读取节假日数据
- 读取天气数据
数据可视化 KMeans Clustering + Matplotlib
特征工程
- 时间特征
- 距离特征
- 天气特征
- 区域拥挤特征
- One hot encode/get dummies
运行模型 XGBoost: eXtreme Gradient Boosting
- One-Hot-Enconde类别型数据
- 区分 训练集,验证集和测试集
- 设置参数,评估得分
- 写出结果,上传提交
数据读取
%matplotlib inlineimport numpy as npimport pandas as pdfrom datetime import datetime, datefrom sklearn .model_selection import train_test_splitimport xgboost as xgbfrom sklearn.linear_model import LinearRegression, Ridge, BayesianRidgefrom sklearn.cluster import MiniBatchKMeansfrom sklearn.metrics import mean_squared_errorfrom math import radians, cos, sin, asin, sqrtimport seaborn as snsimport matplotlib.pyplot as pltplt.rcParams['figure.figsize'] = [60, 30]from sklearn.cluster import KMeansfrom sklearn.model_selection import GridSearchCVfrom sklearn.model_selection import cross_val_score, KFold
xgboost没有被包含在Anaconda的环境中,另行下载安装
train = pd.read_csv('./kaggle纽约出租车原始文件/train.csv', parse_dates = ['pickup_datetime'])test = pd.read_csv('./kaggle纽约出租车原始文件/test.csv', parse_dates = ['pickup_datetime'])
train.head()
| id | vendor_id | pickup_datetime | dropoff_datetime | passenger_count | pickup_longitude | pickup_latitude | dropoff_longitude | dropoff_latitude | store_and_fwd_flag | trip_duration | |
|---|---|---|---|---|---|---|---|---|---|---|---|
| 0 | id2875421 | 2 | 2016-03-14 17:24:55 | 2016-03-14 17:32:30 | 1 | -73.982155 | 40.767937 | -73.964630 | 40.765602 | N | 455 |
| 1 | id2377394 | 1 | 2016-06-12 00:43:35 | 2016-06-12 00:54:38 | 1 | -73.980415 | 40.738564 | -73.999481 | 40.731152 | N | 663 |
| 2 | id3858529 | 2 | 2016-01-19 11:35:24 | 2016-01-19 12:10:48 | 1 | -73.979027 | 40.763939 | -74.005333 | 40.710087 | N | 2124 |
| 3 | id3504673 | 2 | 2016-04-06 19:32:31 | 2016-04-06 19:39:40 | 1 | -74.010040 | 40.719971 | -74.012268 | 40.706718 | N | 429 |
| 4 | id2181028 | 2 | 2016-03-26 13:30:55 | 2016-03-26 13:38:10 | 1 | -73.973053 | 40.793209 | -73.972923 | 40.782520 | N | 435 |
print('train shape:', train.shape)print('test shape:', test.shape)
train shape: (1458644, 11)test shape: (625134, 9)
测试集的特征比训练集少两个
print([i for i in train.columns if i not in test.columns])
['dropoff_datetime', 'trip_duration']
Holiday
holiday = pd.read_csv('./kaggle纽约出租车原始文件/NYC_2016Holidays.csv', sep = ';')holiday.head()
| Day | Date | Holiday | |
|---|---|---|---|
| 0 | Friday | January 01 | New Years Day |
| 1 | Monday | January 18 | Martin Luther King Jr. Day |
| 2 | Friday | February 12 | Lincoln’s Birthday |
| 3 | Monday | February 15 | Presidents’ Day |
| 4 | Sunday | May 08 | Mother’s Day |
holiday['Date'] = holiday['Date'].apply(lambda x : x + ' 2016')holiday.head()
| Day | Date | Holiday | |
|---|---|---|---|
| 0 | Friday | January 01 2016 | New Years Day |
| 1 | Monday | January 18 2016 | Martin Luther King Jr. Day |
| 2 | Friday | February 12 2016 | Lincoln’s Birthday |
| 3 | Monday | February 15 2016 | Presidents’ Day |
| 4 | Sunday | May 08 2016 | Mother’s Day |
.apply()、.map()和.applymap()的区别
- .apply()让函数作用于列或者行
- .applymap()让函数作用于DataFrame每一个元素
- .map()让函数作用于Series每一个元素
holidays = [datetime.strptime(holiday.loc[i, 'Date'], '%B %d %Y').date() for i in range(len(holiday))]holidays
[datetime.date(2016, 1, 1),datetime.date(2016, 1, 18),datetime.date(2016, 2, 12),datetime.date(2016, 2, 15),datetime.date(2016, 5, 8),datetime.date(2016, 5, 30),datetime.date(2016, 6, 19),datetime.date(2016, 7, 4),datetime.date(2016, 9, 5),datetime.date(2016, 10, 10),datetime.date(2016, 11, 11),datetime.date(2016, 11, 24),datetime.date(2016, 12, 26),datetime.date(2016, 7, 4),datetime.date(2016, 11, 8)]
- time.strptime(string[, format])根据指定的格式把一个时间字符串解析为时间元组,返回struct_time对象
- string — 时间字符串
- format — 格式化字符串
- .local[]索引
- struct_time.date()返回日期,去除时分秒信息
Routes from open source routing machine
训练集数据预处理
fastrout1 = pd.read_csv('./kaggle纽约出租车原始文件/fastest_routes_train_part_1.csv',usecols = ['id', 'total_distance', 'total_travel_time', 'number_of_steps', 'step_direction'])fastrout2 = pd.read_csv('./kaggle纽约出租车原始文件/fastest_routes_train_part_2.csv',usecols = ['id', 'total_distance', 'total_travel_time', 'number_of_steps', 'step_direction'])fastrout = pd.concat((fastrout1, fastrout2))fastrout.head()
| id | total_distance | total_travel_time | number_of_steps | step_direction | |
|---|---|---|---|---|---|
| 0 | id2875421 | 2009.1 | 164.9 | 5 | left|straight|right|straight|arrive |
| 1 | id2377394 | 2513.2 | 332.0 | 6 | none|right|left|right|left|arrive |
| 2 | id3504673 | 1779.4 | 235.8 | 4 | left|left|right|arrive |
| 3 | id2181028 | 1614.9 | 140.1 | 5 | right|left|right|left|arrive |
| 4 | id0801584 | 1393.5 | 189.4 | 5 | right|right|right|left|arrive |
转弯多,花的时间也多,因为可能还要等红灯。
美国大部分地方允许等红灯时右转,纽约除外。
left_turn = []right_turn = []left_turn += list(map(lambda x : x.count('left') - x.count('slight left'), fastrout.step_direction))right_turn += list(map(lambda x : x.count('right') - x.count('slight right'), fastrout.step_direction))osrm_data = fastrout[['id', 'total_distance', 'total_travel_time', 'number_of_steps']]osrm_data = osrm_data.assign(left_steps = left_turn)osrm_data = osrm_data.assign(right_steps = right_turn)osrm_data.head()
| id | total_distance | total_travel_time | number_of_steps | left_steps | right_steps | |
|---|---|---|---|---|---|---|
| 0 | id2875421 | 2009.1 | 164.9 | 5 | 1 | 1 |
| 1 | id2377394 | 2513.2 | 332.0 | 6 | 2 | 2 |
| 2 | id3504673 | 1779.4 | 235.8 | 4 | 2 | 1 |
| 3 | id2181028 | 1614.9 | 140.1 | 5 | 2 | 2 |
| 4 | id0801584 | 1393.5 | 189.4 | 5 | 1 | 3 |
测试集数据预处理
left_turn_test = []right_turn_test = []fastrout_test = pd.read_csv('./kaggle纽约出租车原始文件/fastest_routes_test.csv')left_turn_test += list(map(lambda x : x.count('left') - x.count('slight left'), fastrout_test.step_direction))right_turn_test += list(map(lambda x : x.count('right') - x.count('slight right'), fastrout_test.step_direction))osrm_test = fastrout_test[['id', 'total_distance', 'total_travel_time', 'number_of_steps']]osrm_test = osrm_test.assign(left_steps = left_turn_test)osrm_test = osrm_test.assign(right_steps = right_turn_test)osrm_test.head()
| id | total_distance | total_travel_time | number_of_steps | left_steps | right_steps | |
|---|---|---|---|---|---|---|
| 0 | id0771704 | 1497.1 | 200.2 | 7 | 3 | 2 |
| 1 | id3274209 | 1427.1 | 141.5 | 2 | 0 | 0 |
| 2 | id2756455 | 2312.3 | 324.6 | 9 | 4 | 4 |
| 3 | id3684027 | 931.8 | 84.2 | 4 | 1 | 2 |
| 4 | id3101285 | 2501.7 | 294.7 | 8 | 3 | 3 |
Weather
weather = pd.read_csv('./kaggle纽约出租车原始文件/KNYC_Metars.csv', parse_dates = ['Time'])weather.head()
| Time | Temp. | Windchill | Heat Index | Humidity | Pressure | Dew Point | Visibility | Wind Dir | Wind Speed | Gust Speed | Precip | Events | Conditions | |
|---|---|---|---|---|---|---|---|---|---|---|---|---|---|---|
| 0 | 2015-12-31 02:00:00 | 7.8 | 7.1 | NaN | 0.89 | 1017.0 | 6.1 | 8.0 | NNE | 5.6 | 0.0 | 0.8 | None | Overcast |
| 1 | 2015-12-31 03:00:00 | 7.2 | 5.9 | NaN | 0.90 | 1016.5 | 5.6 | 12.9 | Variable | 7.4 | 0.0 | 0.3 | None | Overcast |
| 2 | 2015-12-31 04:00:00 | 7.2 | NaN | NaN | 0.90 | 1016.7 | 5.6 | 12.9 | Calm | 0.0 | 0.0 | 0.0 | None | Overcast |
| 3 | 2015-12-31 05:00:00 | 7.2 | 5.9 | NaN | 0.86 | 1015.9 | 5.0 | 14.5 | NW | 7.4 | 0.0 | 0.0 | None | Overcast |
| 4 | 2015-12-31 06:00:00 | 7.2 | 6.4 | NaN | 0.90 | 1016.2 | 5.6 | 11.3 | West | 5.6 | 0.0 | 0.0 | None | Overcast |
可视化 Visualization
longitude = list(train.pickup_longitude) + list(train.dropoff_longitude)latitude = list(train.pickup_latitude) + list(train.dropoff_latitude)print(len(train.pickup_longitude), len(train.dropoff_longitude), len(longitude))print(len(train.pickup_latitude), len(train.dropoff_latitude), len(latitude))loc_df = pd.DataFrame()loc_df['longitude'] = longitudeloc_df['latitude'] = latitudeloc_df.head()
1458644 1458644 29172881458644 1458644 2917288
| longitude | latitude | |
|---|---|---|
| 0 | -73.982155 | 40.767937 |
| 1 | -73.980415 | 40.738564 |
| 2 | -73.979027 | 40.763939 |
| 3 | -74.010040 | 40.719971 |
| 4 | -73.973053 | 40.793209 |
xlim = [-74.03, -73.77]ylim = [40.63, 40.85]print(loc_df.shape)loc_df = loc_df[(loc_df.longitude > xlim[0]) & (loc_df.longitude < xlim[1])]loc_df = loc_df[(loc_df.latitude > ylim[0]) & (loc_df.latitude < ylim[1])]print(loc_df.shape)
(2917288, 2)(2895748, 2)
kmeans = KMeans(n_clusters = 15, random_state = 2, n_init = 10)kmeans.fit(loc_df)loc_df['label'] = kmeans.labels_loc_df.head()
| longitude | latitude | label | |
|---|---|---|---|
| 0 | -73.982155 | 40.767937 | 12 |
| 1 | -73.980415 | 40.738564 | 7 |
| 2 | -73.979027 | 40.763939 | 12 |
| 3 | -74.010040 | 40.719971 | 5 |
| 4 | -73.973053 | 40.793209 | 9 |
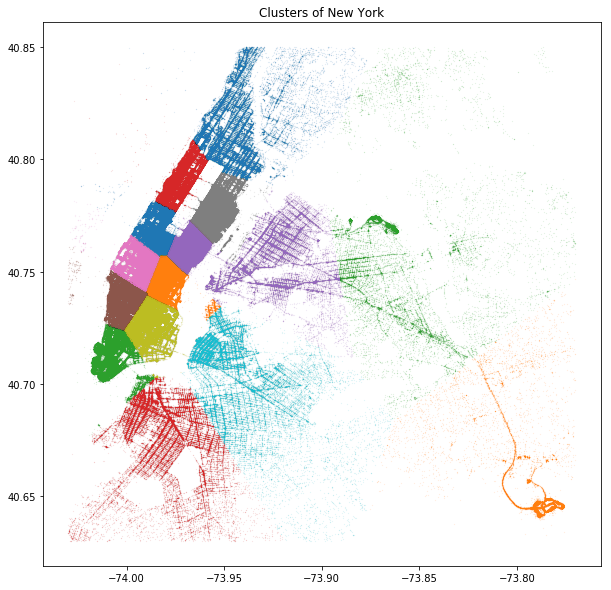
plt.figure(figsize = (10, 10))for label in loc_df.label.unique():plt.plot(loc_df.longitude[loc_df.label == label], loc_df.latitude[loc_df.label == label],'.', markersize = 0.3, alpha = 0.3)plt.title('Clusters of New York')
Text(0.5, 1.0, 'Clusters of New York')
特征工程 Feature Engineering
时间特征 Data feature, including holidays
print('train shape:', train.shape)print('test shape:', test.shape)
train shape: (1458644, 11)test shape: (625134, 9)
细分时间信息,以便进一步分类处理
for df in (train, test):df['year'] = df['pickup_datetime'].dt.yeardf['month'] = df['pickup_datetime'].dt.monthdf['day'] = df['pickup_datetime'].dt.daydf['hour'] = df['pickup_datetime'].dt.hourdf['minute'] = df['pickup_datetime'].dt.minutedf['store_and_fwd_flag'] = 1 * (df.store_and_fwd_flag.values == 'Y')
train = train.assign(log_trip_duration = np.log(train.trip_duration + 1))
分割休息日与工作日
def restday(year, month, day, holidays):is_rest = [None] * len(year)is_weekend = [None] * len(year)i = 0for yy, mm, dd in zip(year, month, day):is_weekend[i] = date(yy, mm, dd).isoweekday() in (6, 7)is_rest[i] = is_weekend[i] or date(yy, mm, dd) in holidaysi += 1return is_rest, is_weekend
- date.weekday():返回weekday,如果是星期一,返回0;如果是星期2,返回1,以此类推;
- data.isoweekday():返回工作日,如果是星期一,返回1;如果是星期2,返回2,以此类推
rest_day, weekend = restday(train.year, train.month, train.day, holiday)train['rest_day'] = rest_daytrain['weekend'] = weekendrest_day, weekend = restday(test.year, test.month, test.day, holiday)test['rest_day'] = rest_daytest['weekend'] = weekend# 简化时间信息train['pickup_time'] = train.hour + train.minute/60test['pickup_time'] = test.hour + test.minute/60
分割早晚高峰rush hour、白天day和夜晚night
for df in (train, test):df['hr_categori'] = np.nandf.loc[(df.rest_day == False) & (df.hour <= 9) & (df.hour >= 7), 'hr_categori'] = 'rush'df.loc[(df.rest_day == False) & (df.hour <= 18) & (df.hour >= 16), 'hr_categori'] = 'rush'df.loc[(df.rest_day == False) & (df.hour < 16) & (df.hour > 9), 'hr_categori'] = 'day'df.loc[(df.rest_day == False) & (df.hour < 7) | (df.hour > 18), 'hr_categori'] = 'night'df.loc[(df.rest_day == True) & (df.hour < 18) & (df.hour > 7), 'hr_categori'] = 'day'df.loc[(df.rest_day == True) & (df.hour <= 7) | (df.hour >= 18), 'hr_categori'] = 'night'
print('train shape:', train.shape)print('test shape:', test.shape)
train shape: (1458644, 21)test shape: (625134, 18)
print([i for i in train.columns if i not in test.columns])
['dropoff_datetime', 'trip_duration', 'log_trip_duration']
距离特征 Distance feature
train_join = train.join(osrm_data.set_index('id'), on = 'id')test_join = test.join(osrm_test.set_index('id'), on = 'id')print('train_join shape:', train_join.shape)print('test_join shape:', test_join.shape)
train_join shape: (1458644, 26)test_join shape: (625134, 23)
天气特征 Weather feature
weather['snow'] = 1 * (weather.Events == 'Snow') + 1 * (weather.Events == 'Fog\n\t,\nSnow')weather['year'] = weather['Time'].dt.yearweather['month'] = weather['Time'].dt.monthweather['day'] = weather['Time'].dt.dayweather['hour'] = weather['Time'].dt.hourweather = weather[weather.year == 2016][['month', 'day', 'hour', 'Temp.', 'Precip', 'snow', 'Visibility']]print(weather.shape)weather.head()
(8739, 7)
| month | day | hour | Temp. | Precip | snow | Visibility | |
|---|---|---|---|---|---|---|---|
| 22 | 1 | 1 | 0 | 5.6 | 0.0 | 0 | 16.1 |
| 23 | 1 | 1 | 1 | 5.6 | 0.0 | 0 | 16.1 |
| 24 | 1 | 1 | 2 | 5.6 | 0.0 | 0 | 16.1 |
| 25 | 1 | 1 | 3 | 5.0 | 0.0 | 0 | 16.1 |
| 26 | 1 | 1 | 4 | 5.0 | 0.0 | 0 | 16.1 |
train = pd.merge(train_join, weather, on = ['month', 'day', 'hour'], how = 'left')test = pd.merge(test_join, weather, on = ['month', 'day', 'hour'], how = 'left')print('train shape:', train.shape)print('test shape:', test.shape)
train shape: (1458644, 30)test shape: (625134, 27)
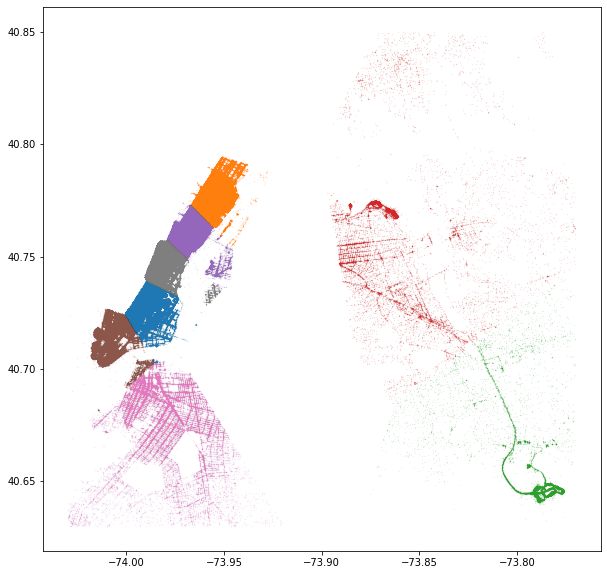
Cluster and find speed
coords = np.vstack((train[['pickup_longitude', 'pickup_latitude']].values,train[['dropoff_longitude', 'dropoff_latitude']].values,test[['pickup_longitude', 'pickup_latitude']].values,test[['dropoff_longitude', 'dropoff_latitude']].values))coords
array([[-73.98215485, 40.76793671],[-73.98041534, 40.73856354],[-73.97902679, 40.7639389 ],...,[-73.87660217, 40.74866486],[-73.85426331, 40.89178848],[-73.96932983, 40.76937866]])
kmeans = MiniBatchKMeans(n_clusters = 8, batch_size = 10000).fit(coords)
train.loc[:, 'pickup_cluster'] = kmeans.predict(train[['pickup_longitude', 'pickup_latitude']])train.loc[:, 'dropoff_cluster'] = kmeans.predict(train[['dropoff_longitude', 'dropoff_latitude']])test.loc[:, 'pickup_cluster'] = kmeans.predict(test[['pickup_longitude', 'pickup_latitude']])test.loc[:, 'dropoff_cluster'] = kmeans.predict(test[['dropoff_longitude', 'dropoff_latitude']])train[['pickup_longitude', 'pickup_latitude', 'dropoff_longitude', 'dropoff_latitude', 'pickup_cluster', 'dropoff_cluster']].head()
| pickup_longitude | pickup_latitude | dropoff_longitude | dropoff_latitude | pickup_cluster | dropoff_cluster | |
|---|---|---|---|---|---|---|
| 0 | -73.982155 | 40.767937 | -73.964630 | 40.765602 | 2 | 5 |
| 1 | -73.980415 | 40.738564 | -73.999481 | 40.731152 | 4 | 4 |
| 2 | -73.979027 | 40.763939 | -74.005333 | 40.710087 | 2 | 6 |
| 3 | -74.010040 | 40.719971 | -74.012268 | 40.706718 | 6 | 6 |
| 4 | -73.973053 | 40.793209 | -73.972923 | 40.782520 | 5 | 5 |
plt.figure(figsize = (10, 10))for label in np.unique(kmeans.labels_):plt.plot(loc_df.longitude[loc_df.label == label], loc_df.latitude[loc_df.label == label],'.', markersize = 0.3, alpha = 0.3)
print('train shape:', train.shape)print('test shape:', test.shape)
train shape: (1458644, 32)test shape: (625134, 29)
Count features
a = pd.concat([train, test]).groupby(['pickup_cluster']).size().reset_index()b = pd.concat([train, test]).groupby(['dropoff_cluster']).size().reset_index()
C:\anaconda\lib\site-packages\ipykernel_launcher.py:1: FutureWarning: Sorting because non-concatenation axis is not aligned. A future versionof pandas will change to not sort by default.To accept the future behavior, pass 'sort=False'.To retain the current behavior and silence the warning, pass 'sort=True'."""Entry point for launching an IPython kernel.C:\anaconda\lib\site-packages\ipykernel_launcher.py:2: FutureWarning: Sorting because non-concatenation axis is not aligned. A future versionof pandas will change to not sort by default.To accept the future behavior, pass 'sort=False'.To retain the current behavior and silence the warning, pass 'sort=True'.
train = pd.merge(train, a, on = 'pickup_cluster', how = 'left')train = pd.merge(train, b, on = 'dropoff_cluster', how = 'left')test = pd.merge(test, a, on = 'pickup_cluster', how = 'left')test = pd.merge(test, b, on = 'dropoff_cluster', how = 'left')
train['speed'] = train['total_distance'] / train['trip_duration']train[['speed', 'total_distance', 'trip_duration']].head()
| speed | total_distance | trip_duration | |
|---|---|---|---|
| 0 | 4.415604 | 2009.1 | 455 |
| 1 | 3.790649 | 2513.2 | 663 |
| 2 | 5.207533 | 11060.8 | 2124 |
| 3 | 4.147786 | 1779.4 | 429 |
| 4 | 3.712414 | 1614.9 | 435 |
pickup_speed = train[['speed', 'pickup_cluster']].groupby('pickup_cluster').mean().reset_index()pickup_speed = pickup_speed.rename(columns = {'speed' : 'ave_pickup_speed'})dropoff_speed = train[['speed', 'dropoff_cluster']].groupby('dropoff_cluster').mean().reset_index()dropoff_speed = dropoff_speed.rename(columns = {'speed' : 'ave_dropoff_speed'})
print(pickup_speed)print(dropoff_speed)
pickup_cluster ave_pickup_speed0 0 5.0932251 1 11.2826942 2 5.0720403 3 6.0756314 4 4.8269755 5 5.3934366 6 5.4507927 7 8.413295dropoff_cluster ave_dropoff_speed0 0 4.7386591 1 12.0164802 2 4.7880733 3 7.5711444 4 4.7179275 5 5.4373236 6 5.6750507 7 8.394009
train = pd.merge(train, pickup_speed, on = 'pickup_cluster', how = 'left')train = pd.merge(train, dropoff_speed, on = 'dropoff_cluster', how = 'left')test = pd.merge(test, pickup_speed, on = 'pickup_cluster', how = 'left')test = pd.merge(test, dropoff_speed, on = 'dropoff_cluster', how = 'left')
train = train.drop('speed', axis = 1)
print('train shape:', train.shape)print('test shape:', test.shape)
train shape: (1458644, 36)test shape: (625134, 33)
print([i for i in train.columns if i not in test.columns])
['dropoff_datetime', 'trip_duration', 'log_trip_duration']
Dummy variables: One-hot encode 处理所有类型特征
类型特征用数字标记,但数字间的大小关系会对预测产生我们不希望的影响
vendor_train = pd.get_dummies(train['vendor_id'], prefix = 'vi', prefix_sep = '_')pickup_cluster_train = pd.get_dummies(train['pickup_cluster'], prefix = 'p', prefix_sep = '_')dropoff_cluster_train = pd.get_dummies(train['dropoff_cluster'], prefix = 'd', prefix_sep = '_')store_fwd_flag_train = pd.get_dummies(train['store_and_fwd_flag'], prefix = 's', prefix_sep = '_')vendor_test = pd.get_dummies(test['vendor_id'], prefix = 'vi', prefix_sep = '_')pickup_cluster_test = pd.get_dummies(test['pickup_cluster'], prefix = 'p', prefix_sep = '_')dropoff_cluster_test = pd.get_dummies(test['dropoff_cluster'], prefix = 'd', prefix_sep = '_')store_fwd_flag_test = pd.get_dummies(test['store_and_fwd_flag'], prefix = 's', prefix_sep = '_')train['dayofweek'] = train['pickup_datetime'].dt.dayofweektest['dayofweek'] = test['pickup_datetime'].dt.dayofweekmonth_train = pd.get_dummies(train['month'], prefix = 'm', prefix_sep = '_')dam_train = pd.get_dummies(train['day'], prefix = 'dam', prefix_sep = '_')daw_train = pd.get_dummies(train['dayofweek'], prefix = 'daw', prefix_sep = '_')hr_train = pd.get_dummies(train['hour'], prefix = 'h', prefix_sep = '_')hr_cate_train = pd.get_dummies(train['hr_categori'], prefix = 'hc', prefix_sep = '_')month_test = pd.get_dummies(test['month'], prefix = 'm', prefix_sep = '_')dam_test = pd.get_dummies(test['day'], prefix = 'dam', prefix_sep = '_')daw_test = pd.get_dummies(test['dayofweek'], prefix = 'daw', prefix_sep = '_')hr_test = pd.get_dummies(test['hour'], prefix = 'h', prefix_sep = '_')hr_cate_test = pd.get_dummies(test['hr_categori'], prefix = 'hc', prefix_sep = '_')
month_train.head()
| m_1 | m_2 | m_3 | m_4 | m_5 | m_6 | |
|---|---|---|---|---|---|---|
| 0 | 0 | 0 | 1 | 0 | 0 | 0 |
| 1 | 0 | 0 | 0 | 0 | 0 | 1 |
| 2 | 1 | 0 | 0 | 0 | 0 | 0 |
| 3 | 0 | 0 | 0 | 1 | 0 | 0 |
| 4 | 0 | 0 | 1 | 0 | 0 | 0 |
train = train.drop(['id', 'vendor_id', 'pickup_cluster', 'dropoff_cluster','store_and_fwd_flag', 'month', 'day', 'dayofweek', 'hour', 'hr_categori', 'dropoff_datetime', 'trip_duration'], axis = 1)Test_id = test['id']test = test.drop(['id', 'vendor_id', 'pickup_cluster', 'dropoff_cluster','store_and_fwd_flag', 'month', 'day', 'dayofweek', 'hour', 'hr_categori'], axis = 1)
Modeling
- Train_Master和Test_Master作为预测目标,上传Kaggle
- Train_Master源自train数据集
- Test_Master源自test数据集
Train_Master = pd.concat([train, vendor_train, pickup_cluster_train, dropoff_cluster_train, store_fwd_flag_train,month_train, dam_train, daw_train, hr_train, hr_cate_train], axis = 1)Test_Master = pd.concat([test, vendor_test, pickup_cluster_test, dropoff_cluster_test, store_fwd_flag_test,month_test, dam_test, daw_test, hr_test, hr_cate_test], axis = 1)
将Train_Master分为Train和Test,不涉及Test_Master
Train_Master = Train_Master.drop('pickup_datetime', axis = 1)Test_Master = Test_Master.drop('pickup_datetime', axis = 1)Train, Test = train_test_split(Train_Master, test_size = 0.01)X_Train = Train.drop('log_trip_duration', axis = 1)Y_Train = Train['log_trip_duration']X_Test = Test.drop('log_trip_duration', axis = 1)Y_Test = Test['log_trip_duration']Y_Train = Y_Train.reset_index().drop('index', axis = 1)Y_Test = Y_Test.reset_index().drop('index', axis = 1)
使用xgb特有的数据结构DMatrix,速度更快
dtrain = xgb.DMatrix(X_Train, label = Y_Train)dvalid = xgb.DMatrix(X_Test, label = Y_Test)dtest = xgb.DMatrix(Test_Master)watchlist = [(dtrain, 'train'), (dvalid, 'valid')]# 理想的结果是模型在watchlist中的两个set上表现一样地好
xgb_pars = {'objective' : 'reg:linear','learning_rate' : 0.05,'max_depth' : 7,'subsample' : 0.8,'colsample_bytree' : 0.7,'colsample_bylevel' : 0.7,'silent' : 1,'reg_alpha' : 1}model = xgb.train(xgb_pars, dtrain, 100, watchlist, early_stopping_rounds = 5,maximize = False, verbose_eval = 1)print('Modeling RMSLE % .5f' %model.best_score)
[0] train-rmse:5.72071 valid-rmse:5.71359Multiple eval metrics have been passed: 'valid-rmse' will be used for early stopping.Will train until valid-rmse hasn't improved in 5 rounds.[1] train-rmse:5.43652 valid-rmse:5.42959[2] train-rmse:5.16664 valid-rmse:5.15993[3] train-rmse:4.91048 valid-rmse:4.90398[4] train-rmse:4.66798 valid-rmse:4.66166[5] train-rmse:4.43687 valid-rmse:4.4307[6] train-rmse:4.21742 valid-rmse:4.21139[7] train-rmse:4.00899 valid-rmse:4.0031[8] train-rmse:3.81135 valid-rmse:3.80559[9] train-rmse:3.62356 valid-rmse:3.61793[10] train-rmse:3.44519 valid-rmse:3.43965[11] train-rmse:3.27661 valid-rmse:3.27129[12] train-rmse:3.11585 valid-rmse:3.11064[13] train-rmse:2.96326 valid-rmse:2.95812[14] train-rmse:2.81842 valid-rmse:2.8134[15] train-rmse:2.68097 valid-rmse:2.67604[16] train-rmse:2.55061 valid-rmse:2.54573[17] train-rmse:2.42696 valid-rmse:2.42213[18] train-rmse:2.30962 valid-rmse:2.30485[19] train-rmse:2.1983 valid-rmse:2.19364[20] train-rmse:2.09279 valid-rmse:2.08819[21] train-rmse:1.99277 valid-rmse:1.98825[22] train-rmse:1.89802 valid-rmse:1.89356[23] train-rmse:1.80818 valid-rmse:1.80382[24] train-rmse:1.72373 valid-rmse:1.71942[25] train-rmse:1.64307 valid-rmse:1.63881[26] train-rmse:1.56664 valid-rmse:1.56242[27] train-rmse:1.49434 valid-rmse:1.49023[28] train-rmse:1.42606 valid-rmse:1.42196[29] train-rmse:1.36146 valid-rmse:1.35739[30] train-rmse:1.30082 valid-rmse:1.29687[31] train-rmse:1.24305 valid-rmse:1.23917[32] train-rmse:1.18844 valid-rmse:1.18463[33] train-rmse:1.13687 valid-rmse:1.13312[34] train-rmse:1.08825 valid-rmse:1.08456[35] train-rmse:1.04279 valid-rmse:1.03918[36] train-rmse:0.999537 valid-rmse:0.995962[37] train-rmse:0.958848 valid-rmse:0.955314[38] train-rmse:0.920506 valid-rmse:0.917043[39] train-rmse:0.884371 valid-rmse:0.880961[40] train-rmse:0.850502 valid-rmse:0.847148[41] train-rmse:0.818737 valid-rmse:0.815504[42] train-rmse:0.788936 valid-rmse:0.785738[43] train-rmse:0.760988 valid-rmse:0.757844[44] train-rmse:0.73487 valid-rmse:0.731798[45] train-rmse:0.710508 valid-rmse:0.7075[46] train-rmse:0.687611 valid-rmse:0.684679[47] train-rmse:0.666258 valid-rmse:0.663418[48] train-rmse:0.646386 valid-rmse:0.643666[49] train-rmse:0.627901 valid-rmse:0.625226[50] train-rmse:0.610705 valid-rmse:0.608164[51] train-rmse:0.594841 valid-rmse:0.592374[52] train-rmse:0.580073 valid-rmse:0.577685[53] train-rmse:0.566276 valid-rmse:0.563964[54] train-rmse:0.553586 valid-rmse:0.551364[55] train-rmse:0.541802 valid-rmse:0.539665[56] train-rmse:0.530938 valid-rmse:0.528837[57] train-rmse:0.520891 valid-rmse:0.518795[58] train-rmse:0.511724 valid-rmse:0.509689[59] train-rmse:0.503191 valid-rmse:0.501274[60] train-rmse:0.495394 valid-rmse:0.493556[61] train-rmse:0.488261 valid-rmse:0.486498[62] train-rmse:0.481713 valid-rmse:0.480063[63] train-rmse:0.475621 valid-rmse:0.474073[64] train-rmse:0.470123 valid-rmse:0.468653[65] train-rmse:0.465024 valid-rmse:0.463596[66] train-rmse:0.460254 valid-rmse:0.458901[67] train-rmse:0.455962 valid-rmse:0.4547[68] train-rmse:0.452054 valid-rmse:0.450878[69] train-rmse:0.448391 valid-rmse:0.44725[70] train-rmse:0.445074 valid-rmse:0.443996[71] train-rmse:0.442037 valid-rmse:0.441076[72] train-rmse:0.439282 valid-rmse:0.438398[73] train-rmse:0.436759 valid-rmse:0.435955[74] train-rmse:0.434434 valid-rmse:0.433737[75] train-rmse:0.43231 valid-rmse:0.43164[76] train-rmse:0.430316 valid-rmse:0.429741[77] train-rmse:0.428579 valid-rmse:0.428089[78] train-rmse:0.426804 valid-rmse:0.42643[79] train-rmse:0.425351 valid-rmse:0.425114[80] train-rmse:0.424028 valid-rmse:0.423859[81] train-rmse:0.422741 valid-rmse:0.422651[82] train-rmse:0.421421 valid-rmse:0.421356[83] train-rmse:0.420333 valid-rmse:0.420332[84] train-rmse:0.419373 valid-rmse:0.419435[85] train-rmse:0.418452 valid-rmse:0.418557[86] train-rmse:0.417631 valid-rmse:0.417816[87] train-rmse:0.416853 valid-rmse:0.417082[88] train-rmse:0.416167 valid-rmse:0.416446[89] train-rmse:0.415507 valid-rmse:0.415831[90] train-rmse:0.414853 valid-rmse:0.415315[91] train-rmse:0.414216 valid-rmse:0.414727[92] train-rmse:0.413691 valid-rmse:0.41419[93] train-rmse:0.413165 valid-rmse:0.41368[94] train-rmse:0.412663 valid-rmse:0.413233[95] train-rmse:0.412157 valid-rmse:0.412737[96] train-rmse:0.411703 valid-rmse:0.412313[97] train-rmse:0.411311 valid-rmse:0.411921[98] train-rmse:0.410933 valid-rmse:0.411623[99] train-rmse:0.410626 valid-rmse:0.411271Modeling RMSLE 0.41127
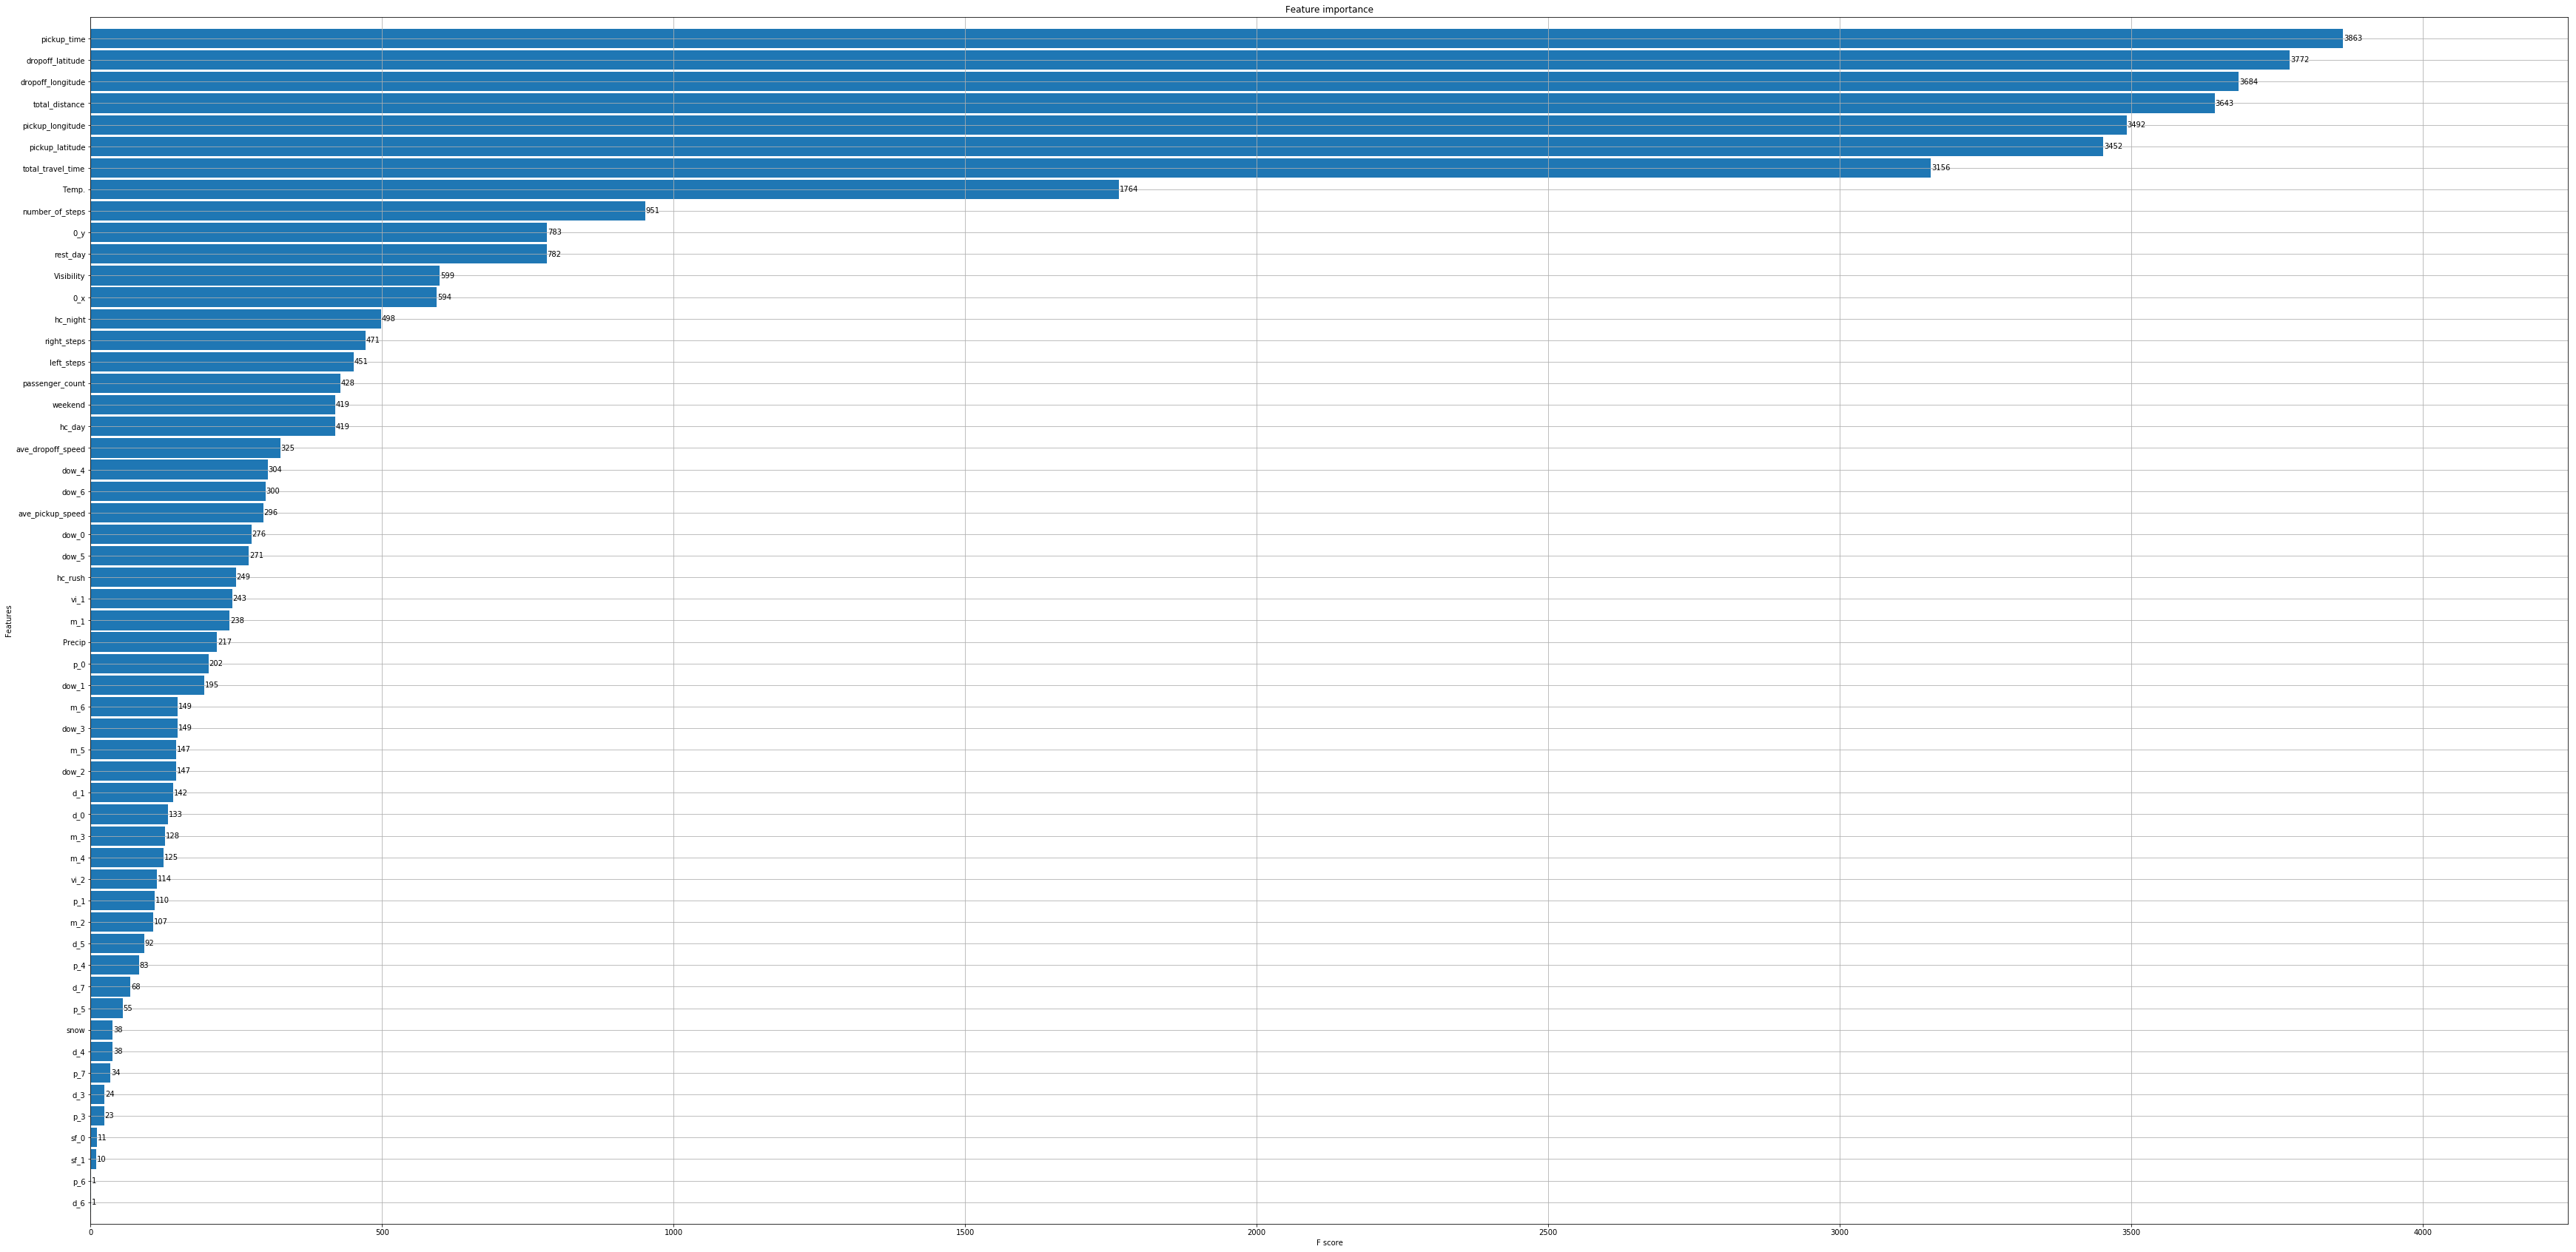
ax = xgb.plot_importance(model, max_num_features = 70, height = 0.9)ax.figure.set_size_inches(20, 30)
如何在Jupyter放大XGB的绘图尺寸?
- fig, ax = plt.subplots(figsize=(10,8))
- plot_importance(model, ax=ax)
或者,你可以让绘图函数创建图形,然后更改其大小。 - ax = plot_importance(model)
- ax.figure.set_size_inches(10,8)
pred = model.predict(dtest)pred = np.exp(pred) - 1
submission = pd.concat([Test_id, pd.DataFrame(pred)], axis = 1)submission.columns = ['id', 'trip_duration']submission['trip_duration'] = submission.apply(lambda x : 1 if (x['trip_duration'] <= 0) else x['trip_duration'], axis = 1)submission.to_csv('submission.csv', index = False)

若有收获,就点个赞吧
0 人点赞
