准备工作
安装所需的库
打开cmd
首先再键盘上面找到win和R键。
同时按下win和R键,在输入框中输入**cmd**。
点击确定打开命令提示符。
下面介绍几个常见的用于绘图的库。
在命令提示符中输入相应的安装命令即可。
安装numpy
pip install numpy -i https://pypi.douban.com/simple
安装pandas
pip install pandas -i https://pypi.douban.com/simple
安装matpoltlib
pip install matplotlib -i https://pypi.douban.com/simple
下面讲解其中基本绘图的用法。
Matpoltlib
申明
本小节笔记摘自于:
python如何使用Matplotlib画图(基础篇)
python中matplotlib的颜色及形状_Mortal的博客-CSDN博客_matplotlib 颜色
导入模块
在写入的python文件开头写下如下语句导入模块:
#导入matplotlib的pyplot模块import matplotlib.pyplot as plt
绘制折线图
实例
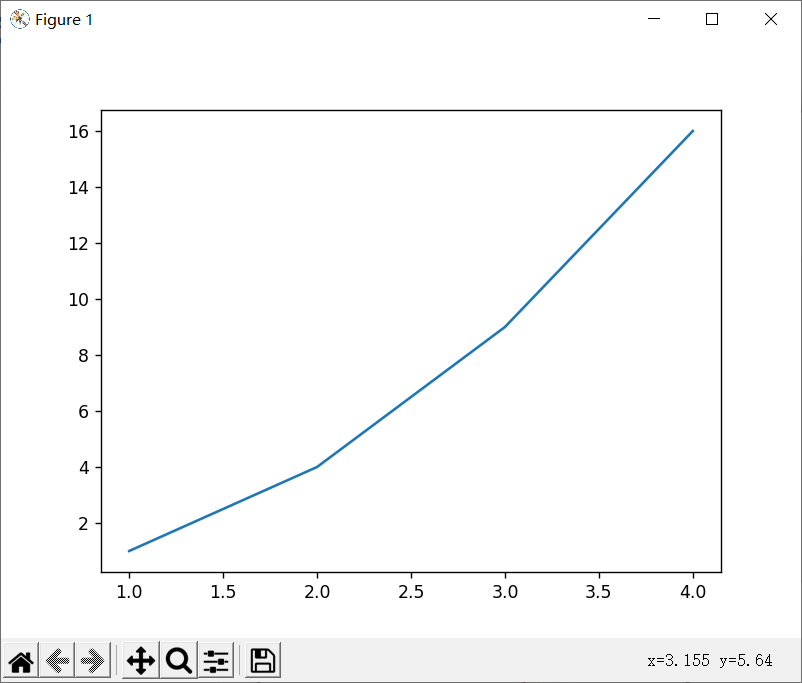
先看最简单的例子:
import matplotlib.pyplot as pltx = [1, 2, 3, 4]y = [1, 4, 9, 16]plt.plot(x, y)plt.show()
语法讲解
首先第一行:import matplotlib.pyplot as plt,作用就是导入matplotlib里面的pyplot模块,并且别名为**plt**。
3/4行分别定义了横纵坐标,也就是x轴和y轴。plot(x,y)用于绘制图像。show()用于显示图像。
两个函数都是plt内部的方法所以需要通过plt.进行调用。
属性设置
首先看一下plot()的完整用法:
# 所有可选参数plt.plot(x,y,color,linestyle=,linewidth,marker,markeredgecolor,markeredgwidth,markerfacecolor,markersize,label)
这里选择常用的参数进行讲解:
plt.plot(x, y, linewidth = '1', label='test',color=' red ', linestyle=':', marker='|')
线条宽度(linewidth)
图例(label)
这个需要和后面的legend()联合使用,详情看后面的讲解。
线条样式(linestyle)
表示线条的样式,常用的样式有如下几种:
| 标记字符 | 还可使用 | 说明 |
|---|---|---|
| ‘-’ | “solid” | 实线 |
| ‘–’ | “dashed” | 破折线 |
| ‘-.’ | “dashdot” | 点划线 |
| ‘:’ | “dotted” | 虚线 |
| ’ ’ | ‘none’ | 无线条 |
标注形状(marker)
简单的来讲就是每个点用什么符号进行表示。
常见有:
| 标记字符 | 还可使用 | 说明 |
|---|---|---|
| ‘.’ | point marker | 点标记 |
| ‘,’ | pixel marker | 像素标记(极小点) |
| ‘o’ | circle marker | 实心圈标记 |
| ‘v’ | triangle_down marker | 倒三角标记 |
| ‘^’ | triangle_up marker | 上三角标记 |
| ‘<’ | triangle_left marker | 左三角标记 |
| ‘d’ | thin_diamond marker | 受菱形标记 |
| ‘|’ | vline marker | 垂直线标记 |
| ‘_’ | hline marker | 水平线标记 |
颜色(color)
支持的颜色有:
cnames = {'aliceblue': '#F0F8FF','antiquewhite': '#FAEBD7','aqua': '#00FFFF','aquamarine': '#7FFFD4','azure': '#F0FFFF','beige': '#F5F5DC','bisque': '#FFE4C4','black': '#000000','blanchedalmond': '#FFEBCD','blue': '#0000FF','blueviolet': '#8A2BE2','brown': '#A52A2A','burlywood': '#DEB887','cadetblue': '#5F9EA0','chartreuse': '#7FFF00','chocolate': '#D2691E','coral': '#FF7F50','cornflowerblue': '#6495ED','cornsilk': '#FFF8DC','crimson': '#DC143C','cyan': '#00FFFF','darkblue': '#00008B','darkcyan': '#008B8B','darkgoldenrod': '#B8860B','darkgray': '#A9A9A9','darkgreen': '#006400','darkkhaki': '#BDB76B','darkmagenta': '#8B008B','darkolivegreen': '#556B2F','darkorange': '#FF8C00','darkorchid': '#9932CC','darkred': '#8B0000','darksalmon': '#E9967A','darkseagreen': '#8FBC8F','darkslateblue': '#483D8B','darkslategray': '#2F4F4F','darkturquoise': '#00CED1','darkviolet': '#9400D3','deeppink': '#FF1493','deepskyblue': '#00BFFF','dimgray': '#696969','dodgerblue': '#1E90FF','firebrick': '#B22222','floralwhite': '#FFFAF0','forestgreen': '#228B22','fuchsia': '#FF00FF','gainsboro': '#DCDCDC','ghostwhite': '#F8F8FF','gold': '#FFD700','goldenrod': '#DAA520','gray': '#808080','green': '#008000','greenyellow': '#ADFF2F','honeydew': '#F0FFF0','hotpink': '#FF69B4','indianred': '#CD5C5C','indigo': '#4B0082','ivory': '#FFFFF0','khaki': '#F0E68C','lavender': '#E6E6FA','lavenderblush': '#FFF0F5','lawngreen': '#7CFC00','lemonchiffon': '#FFFACD','lightblue': '#ADD8E6','lightcoral': '#F08080','lightcyan': '#E0FFFF','lightgoldenrodyellow': '#FAFAD2','lightgreen': '#90EE90','lightgray': '#D3D3D3','lightpink': '#FFB6C1','lightsalmon': '#FFA07A','lightseagreen': '#20B2AA','lightskyblue': '#87CEFA','lightslategray': '#778899','lightsteelblue': '#B0C4DE','lightyellow': '#FFFFE0','lime': '#00FF00','limegreen': '#32CD32','linen': '#FAF0E6','magenta': '#FF00FF','maroon': '#800000','mediumaquamarine': '#66CDAA','mediumblue': '#0000CD','mediumorchid': '#BA55D3','mediumpurple': '#9370DB','mediumseagreen': '#3CB371','mediumslateblue': '#7B68EE','mediumspringgreen': '#00FA9A','mediumturquoise': '#48D1CC','mediumvioletred': '#C71585','midnightblue': '#191970','mintcream': '#F5FFFA','mistyrose': '#FFE4E1','moccasin': '#FFE4B5','navajowhite': '#FFDEAD','navy': '#000080','oldlace': '#FDF5E6','olive': '#808000','olivedrab': '#6B8E23','orange': '#FFA500','orangered': '#FF4500','orchid': '#DA70D6','palegoldenrod': '#EEE8AA','palegreen': '#98FB98','paleturquoise': '#AFEEEE','palevioletred': '#DB7093','papayawhip': '#FFEFD5','peachpuff': '#FFDAB9','peru': '#CD853F','pink': '#FFC0CB','plum': '#DDA0DD','powderblue': '#B0E0E6','purple': '#800080','red': '#FF0000','rosybrown': '#BC8F8F','royalblue': '#4169E1','saddlebrown': '#8B4513','salmon': '#FA8072','sandybrown': '#FAA460','seagreen': '#2E8B57','seashell': '#FFF5EE','sienna': '#A0522D','silver': '#C0C0C0','skyblue': '#87CEEB','slateblue': '#6A5ACD','slategray': '#708090','snow': '#FFFAFA','springgreen': '#00FF7F','steelblue': '#4682B4','tan': '#D2B48C','teal': '#008080','thistle': '#D8BFD8','tomato': '#FF6347','turquoise': '#40E0D0','violet': '#EE82EE','wheat': '#F5DEB3','white': '#FFFFFF','whitesmoke': '#F5F5F5','yellow': '#FFFF00','yellowgreen': '#9ACD32'}
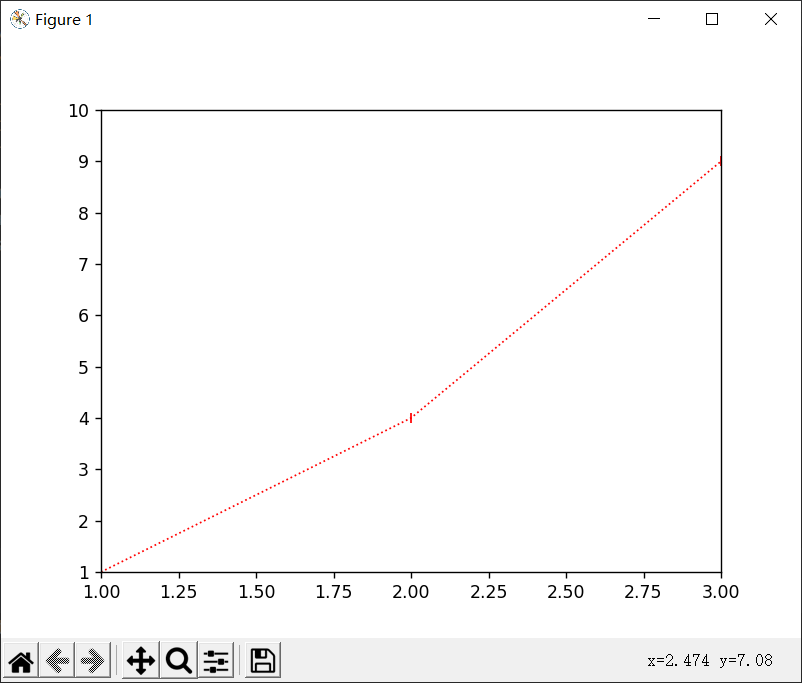
综合实例
import matplotlib.pyplot as pltx = [1, 2, 3, 4]y = [1, 4, 9, 16]plt.plot(x, y, linewidth = '1',color='red', linestyle=':', marker='|')plt.show()
运行结果如下:<br />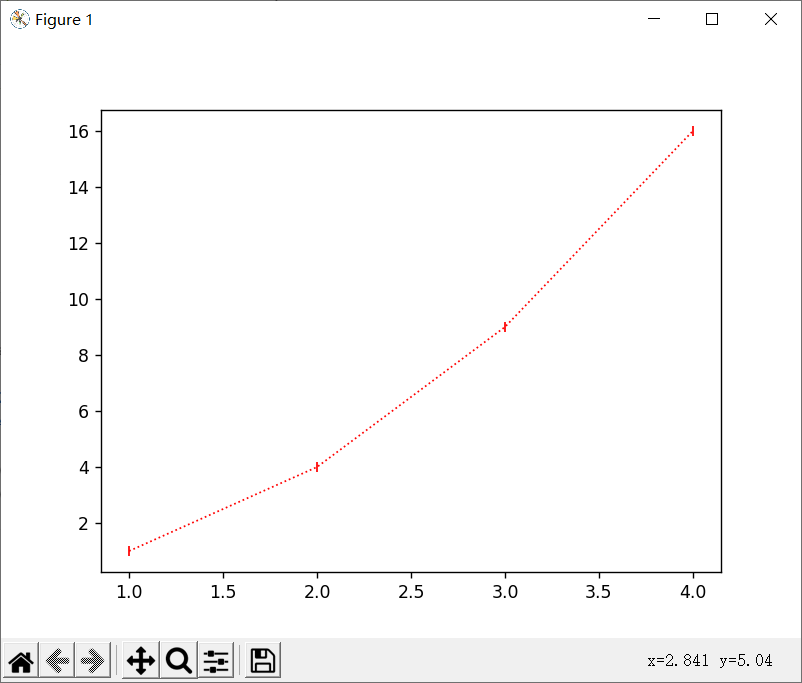
其他属性
控制坐标轴范围(axis)
语法格式为:axis([x1,x2,y1,y2]),表示x轴的范围是[x1,x2],y轴的范围是[y1,y2]。
import matplotlib.pyplot as pltx = [1, 2, 3, 4]y = [1, 4, 9, 16]plt.plot(x, y, linewidth='1', color='red', linestyle=':', marker='|')plt.axis([1, 3, 1, 10])plt.show()
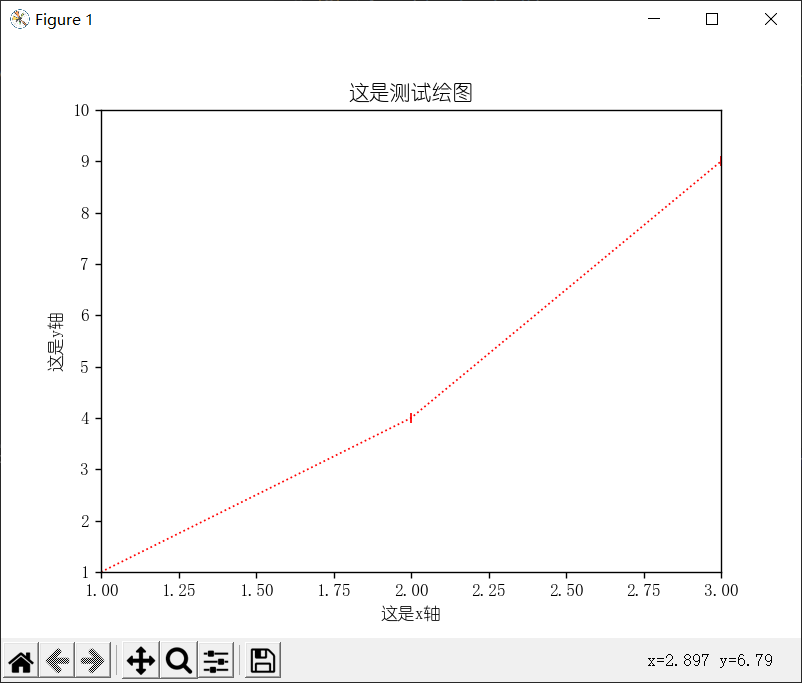
设置标签和标题等
xlabel设置x轴的名称ylabel设置y轴的名称title设置绘图的标题。
实例演示
import matplotlib.pyplot as plt# 下面这两行代码是为了防止中文不显示import matplotlibmatplotlib.rc("font",family='YouYuan')x = [1, 2, 3, 4]y = [1, 4, 9, 16]plt.plot(x, y, linewidth='1', color='red', linestyle=':', marker='|')plt.axis([1, 3, 1, 10])plt.xlabel("这是x轴")plt.ylabel("这是y轴")plt.title("这是测试绘图")plt.show()
中文不显示问题
解决中文不显示问题可以看下面这个链接:
彻底解决Python里matplotlib不显示中文的问题
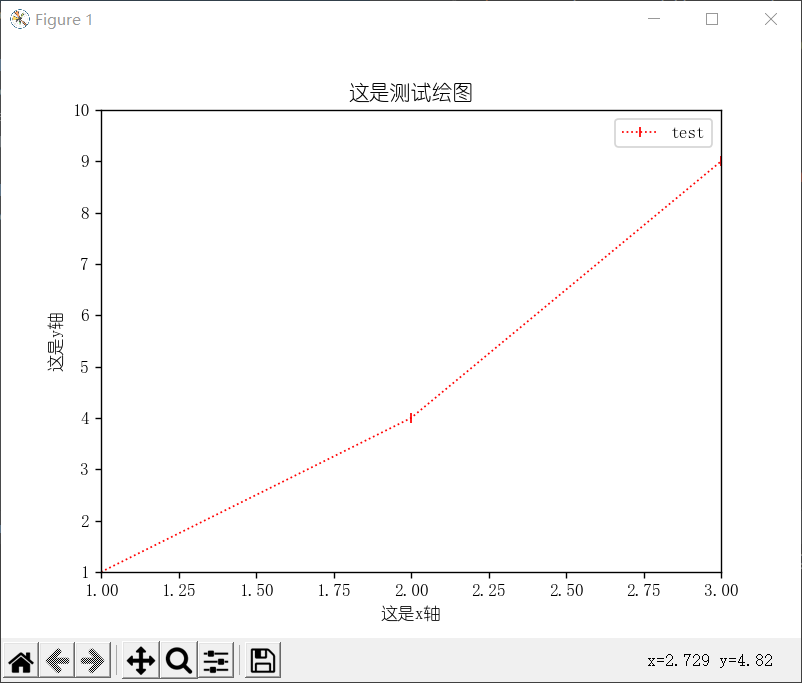
显示图例
import matplotlib.pyplot as pltimport matplotlibmatplotlib.rc("font",family='YouYuan')x = [1, 2, 3, 4]y = [1, 4, 9, 16]plt.plot(x, y, linewidth='1',label='test', color='red', linestyle=':', marker='|')plt.axis([1, 3, 1, 10])plt.xlabel("这是x轴")plt.ylabel("这是y轴")plt.title("这是测试绘图")plt.legend() # 显示图例plt.show()
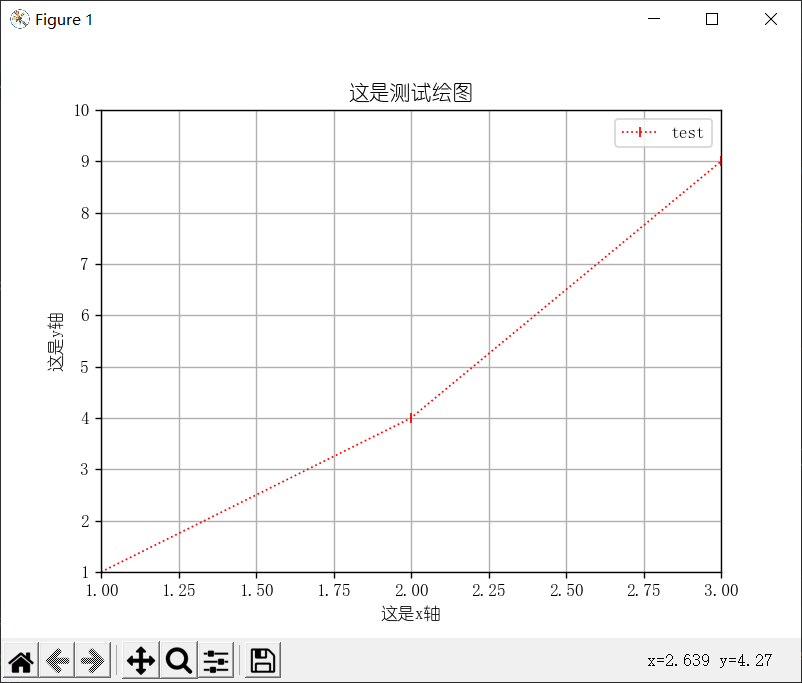
显示网格
import matplotlib.pyplot as pltimport matplotlibmatplotlib.rc("font",family='YouYuan')x = [1, 2, 3, 4]y = [1, 4, 9, 16]plt.plot(x, y, linewidth='1',label='test', color='red', linestyle=':', marker='|')plt.axis([1, 3, 1, 10])plt.xlabel("这是x轴")plt.ylabel("这是y轴")plt.title("这是测试绘图")plt.legend() # 显示图例plt.grid(True) # 显示网格plt.show()
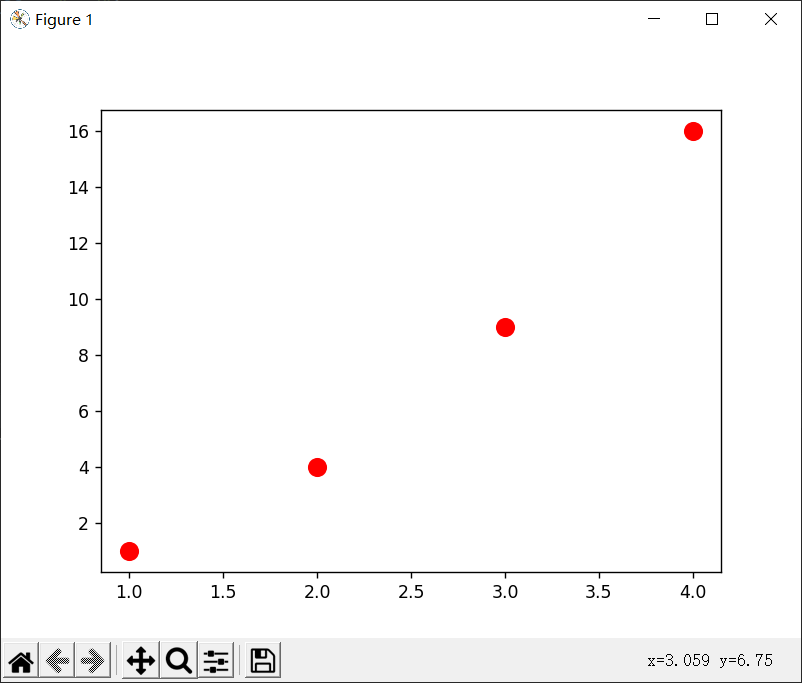
绘制散点图
基本语法
plt.scatter(x,y,s,c,marker,linewidths,edgecolors)
参数说明
| 参数 | 说明 |
|---|---|
| (x,y) | 散点的位置 |
| s | 每个点的面积,即散点的大小。若只有一个具体值时,则所有点的大小都一样。也可呈现多个值,这样就成了气泡图 |
| c | 每个点的颜色,可多样 |
| marker | 标记,同折线图中marker |
| linewidths | 散点线宽 |
| edgecolors | 散点外轮廓的颜色 |
实例
import matplotlib.pyplot as pltx = [1, 2, 3, 4]y = [1, 4, 9, 16]plt.scatter(x, y,s=100,c="red")plt.show()
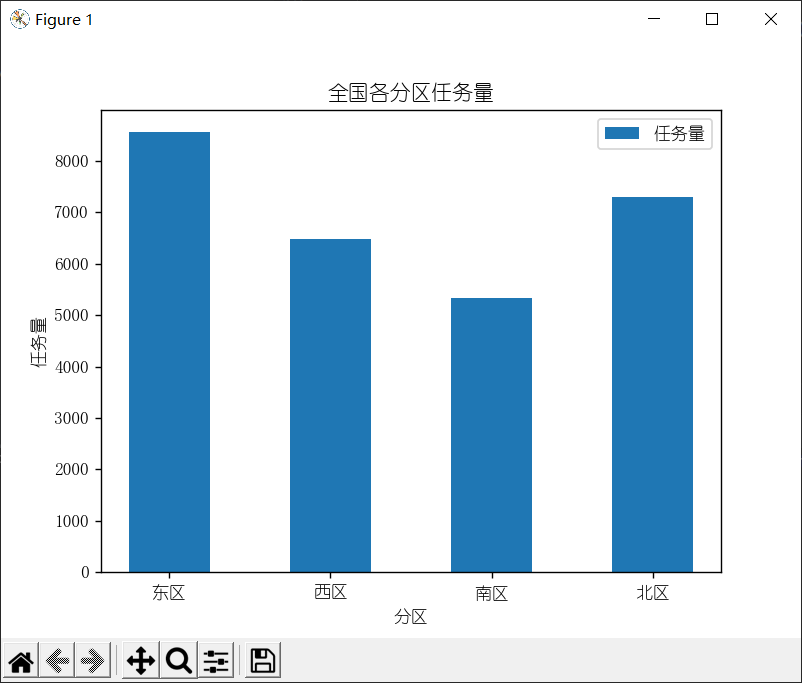
绘制柱状图
基本语法
plot.bar(x,height,width=0.8,bottom=None,align='center',color,edgecolor)
参数说明
| 参数 | 说明 |
|---|---|
| x | 表示在什么位置显示柱形图 |
| height | 柱子高度 |
| width | 每根柱子的宽度,可各不相同 |
| bottom | 每根柱子的底部位置,可各不相同 |
| align | 柱子的位置与x值的关系,可选center、edge两个参数,center表示柱子位于x值的中心位置,edge表示边缘位置 |
| color | 柱子颜色 |
| edgecolor | 柱子边缘的颜色 |
实例讲解
import matplotlib.pyplot as pltimport numpy as npimport matplotlibmatplotlib.rc("font",family='YouYuan')# 这里是使用numpy库来定义 x 和 y传入的参数为数组x = np.array(["东区", "西区", "南区", "北区"])y = np.array([8566, 6482, 5335, 7310])plt.bar(x, y, width=0.5, align="center", label="任务量")plt.title("全国各分区任务量", loc="center")plt.xlabel('分区')plt.ylabel('任务量')plt.legend() # 显示图例plt.show()
关于numpy后续会讲解。
增加数据标签
如果想要在每个条形图上面标明数字,可以用以下的方法:
plt.text(x,y,string,fontsize=15,verticalalignment="top",horizontalalignment="right")
其中:
x,y:表示坐标值上的值string:表示说明文字fontsize:表示字体大小verticalalignment:垂直对齐方式 ,参数:[ ‘center’ | ‘top’ | ‘bottom’ | ‘baseline’ ],可以简写为vahorizontalalignment:水平对齐方式 ,参数:[ ‘center’ | ‘right’ | ‘left’ ],可以简写为ha
举个例子:
import matplotlib.pyplot as pltimport numpy as npimport matplotlibmatplotlib.rc("font",family='YouYuan')x = np.array(["东区", "西区", "南区", "北区"])y = np.array([8566, 6482, 5335, 7310])plt.bar(x, y, width=0.5, align="center", label="任务量")plt.title("全国各分区任务量", loc="center")# 添加数据标签for a, b in zip(x, y):plt.text(a, b, b, ha='center', va="bottom", fontsize=12, color="r")plt.xlabel('分区')plt.ylabel('任务量')plt.legend() # 显示图例plt.show()
这里先解释一下`zip()`函数。<br />`zip()` 函数用于将可迭代的对象作为参数,将对象中对应的元素打包成**一个个元组**,然后返回由这些元组组成的列表。<br />例如:
a = [1,2,3]b = [4,5,6]zipped = zip(a,b) # 打包为元组的列表# 返回结果为 :[(1, 4), (2, 5), (3, 6)]
接着分析`plt.text(a, b, b, ha='center', va="bottom", fontsize=12, color="r")`<br />后面四个属性都在上面有讲解,这里不再赘述。<br />前面的`a,b,b`中前两个分别代表`x`和`y`,后面一个`b`表示的是在条形图上面**显示的数据**。<br />运行结果如下:<br />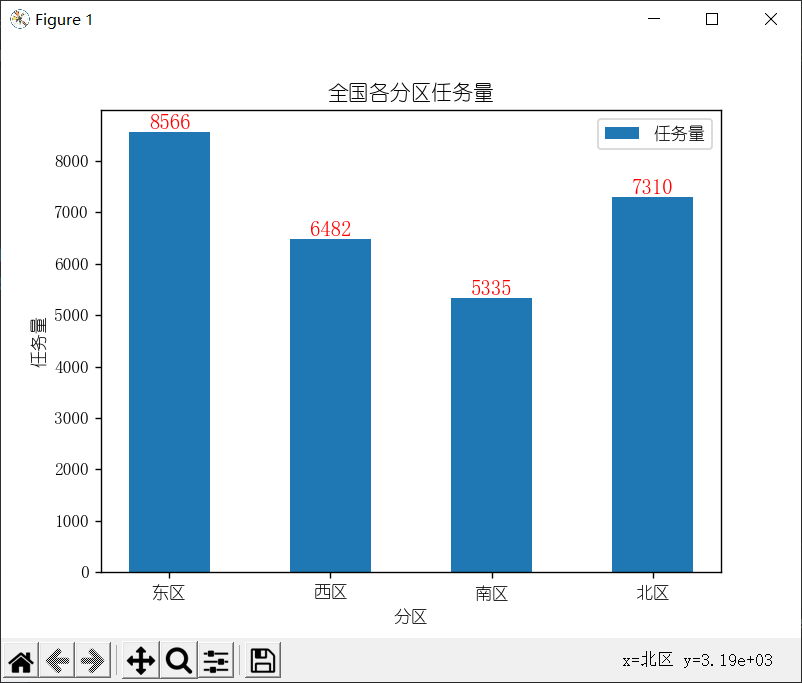
簇状柱形图
直接展示代码
import matplotlib.pyplot as pltimport numpy as npimport matplotlibmatplotlib.rc("font",family='YouYuan')x = np.array([1, 2, 3, 4])y1 = np.array([8566, 6482, 5335, 7310])y2 = np.array([4283, 2667, 3655, 3241])plt.bar(x, y1, width=0.3, label="任务量")plt.bar(x + 0.3, y2, width=0.3, label="完成量") # x+0.3相当于完成量的每个柱子右移0.3plt.title("全国各分区任务量", loc="center")# 添加数据标签for a, b in zip(x, y1):plt.text(a, b, b, ha='center', va="bottom", fontsize=12, color="blue")# 注意这里为了使标签对齐,需要讲a向右偏移0.3个单位for a, b in zip(x, y2):plt.text(a+0.3, b, b, ha='center', va="bottom", fontsize=12, color="g")plt.xlabel('区域')plt.ylabel('任务情况')# 设置x轴刻度值# 设置的时候是x向右便宜0.15个单位plt.xticks(x + 0.15, ["东区", "西区", "南区", "北区"])plt.grid(False)plt.legend() # 显示图例plt.show()
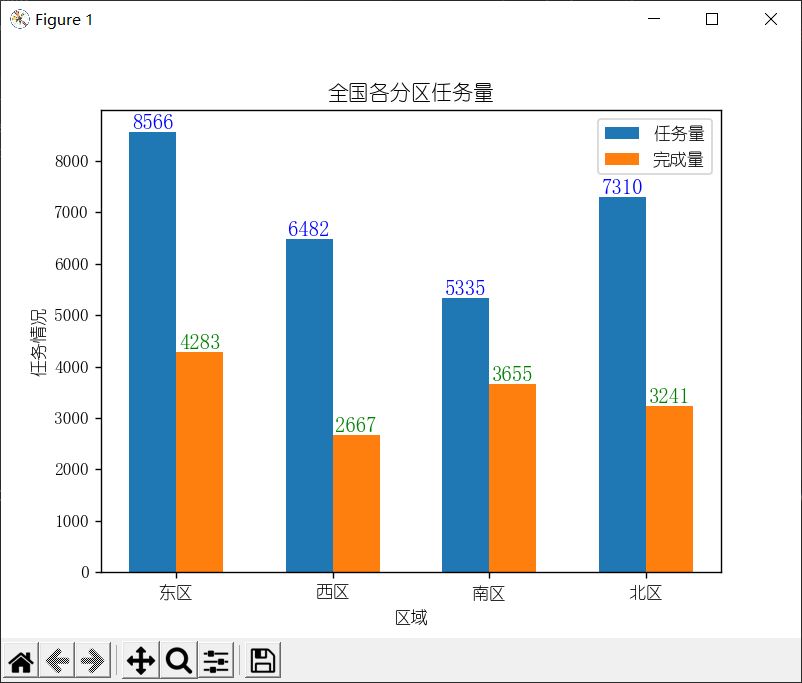
比较简单这里就不自己阐述了,都写在注释里面了,可以自行调试代码查看运行效果。
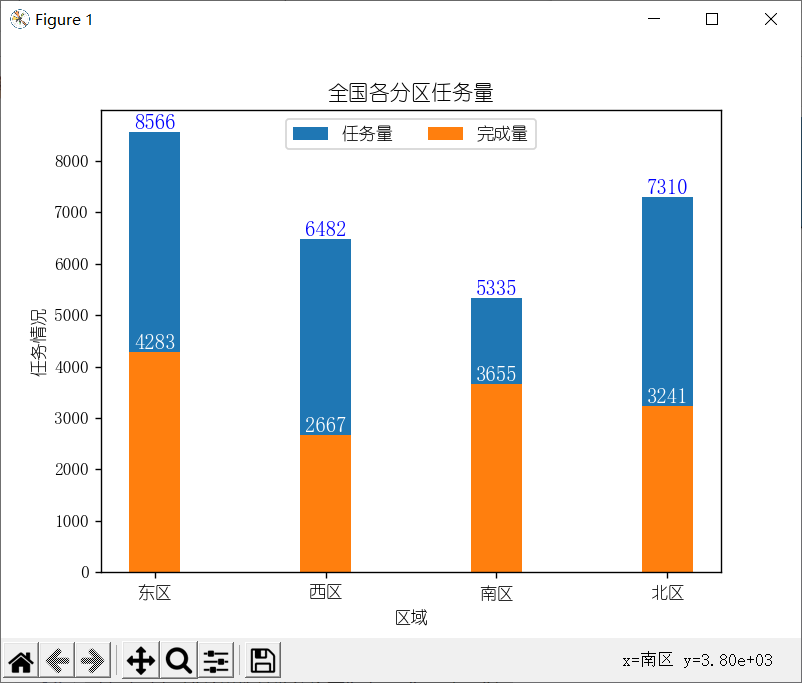
堆积柱状图
import matplotlib.pyplot as pltimport numpy as npimport matplotlibmatplotlib.rc("font",family='YouYuan')x = np.array(["东区", "西区", "南区", "北区"])y1 = np.array([8566, 6482, 5335, 7310])y2 = np.array([4283, 2667, 3655, 3241])plt.bar(x, y1, width=0.3, label="任务量")plt.bar(x, y2, width=0.3, label="完成量")plt.title("全国各分区任务量", loc="center")# 添加数据标签for a, b in zip(x, y1):plt.text(a, b, b, ha='center', va="bottom", fontsize=12, color="blue")for a, b in zip(x, y2):plt.text(a, b, b, ha='center', va="bottom", fontsize=12, color="white")plt.xlabel('区域')plt.ylabel('任务情况')plt.grid(False)plt.legend(loc="upper center", ncol=2)plt.show()

若有收获,就点个赞吧
0 人点赞
