学习目标
- 目标
- 知道Pandas的Series结构
- 掌握Pandas的Dataframe结构
- 了解Pandas的MultiIndex与panel结构
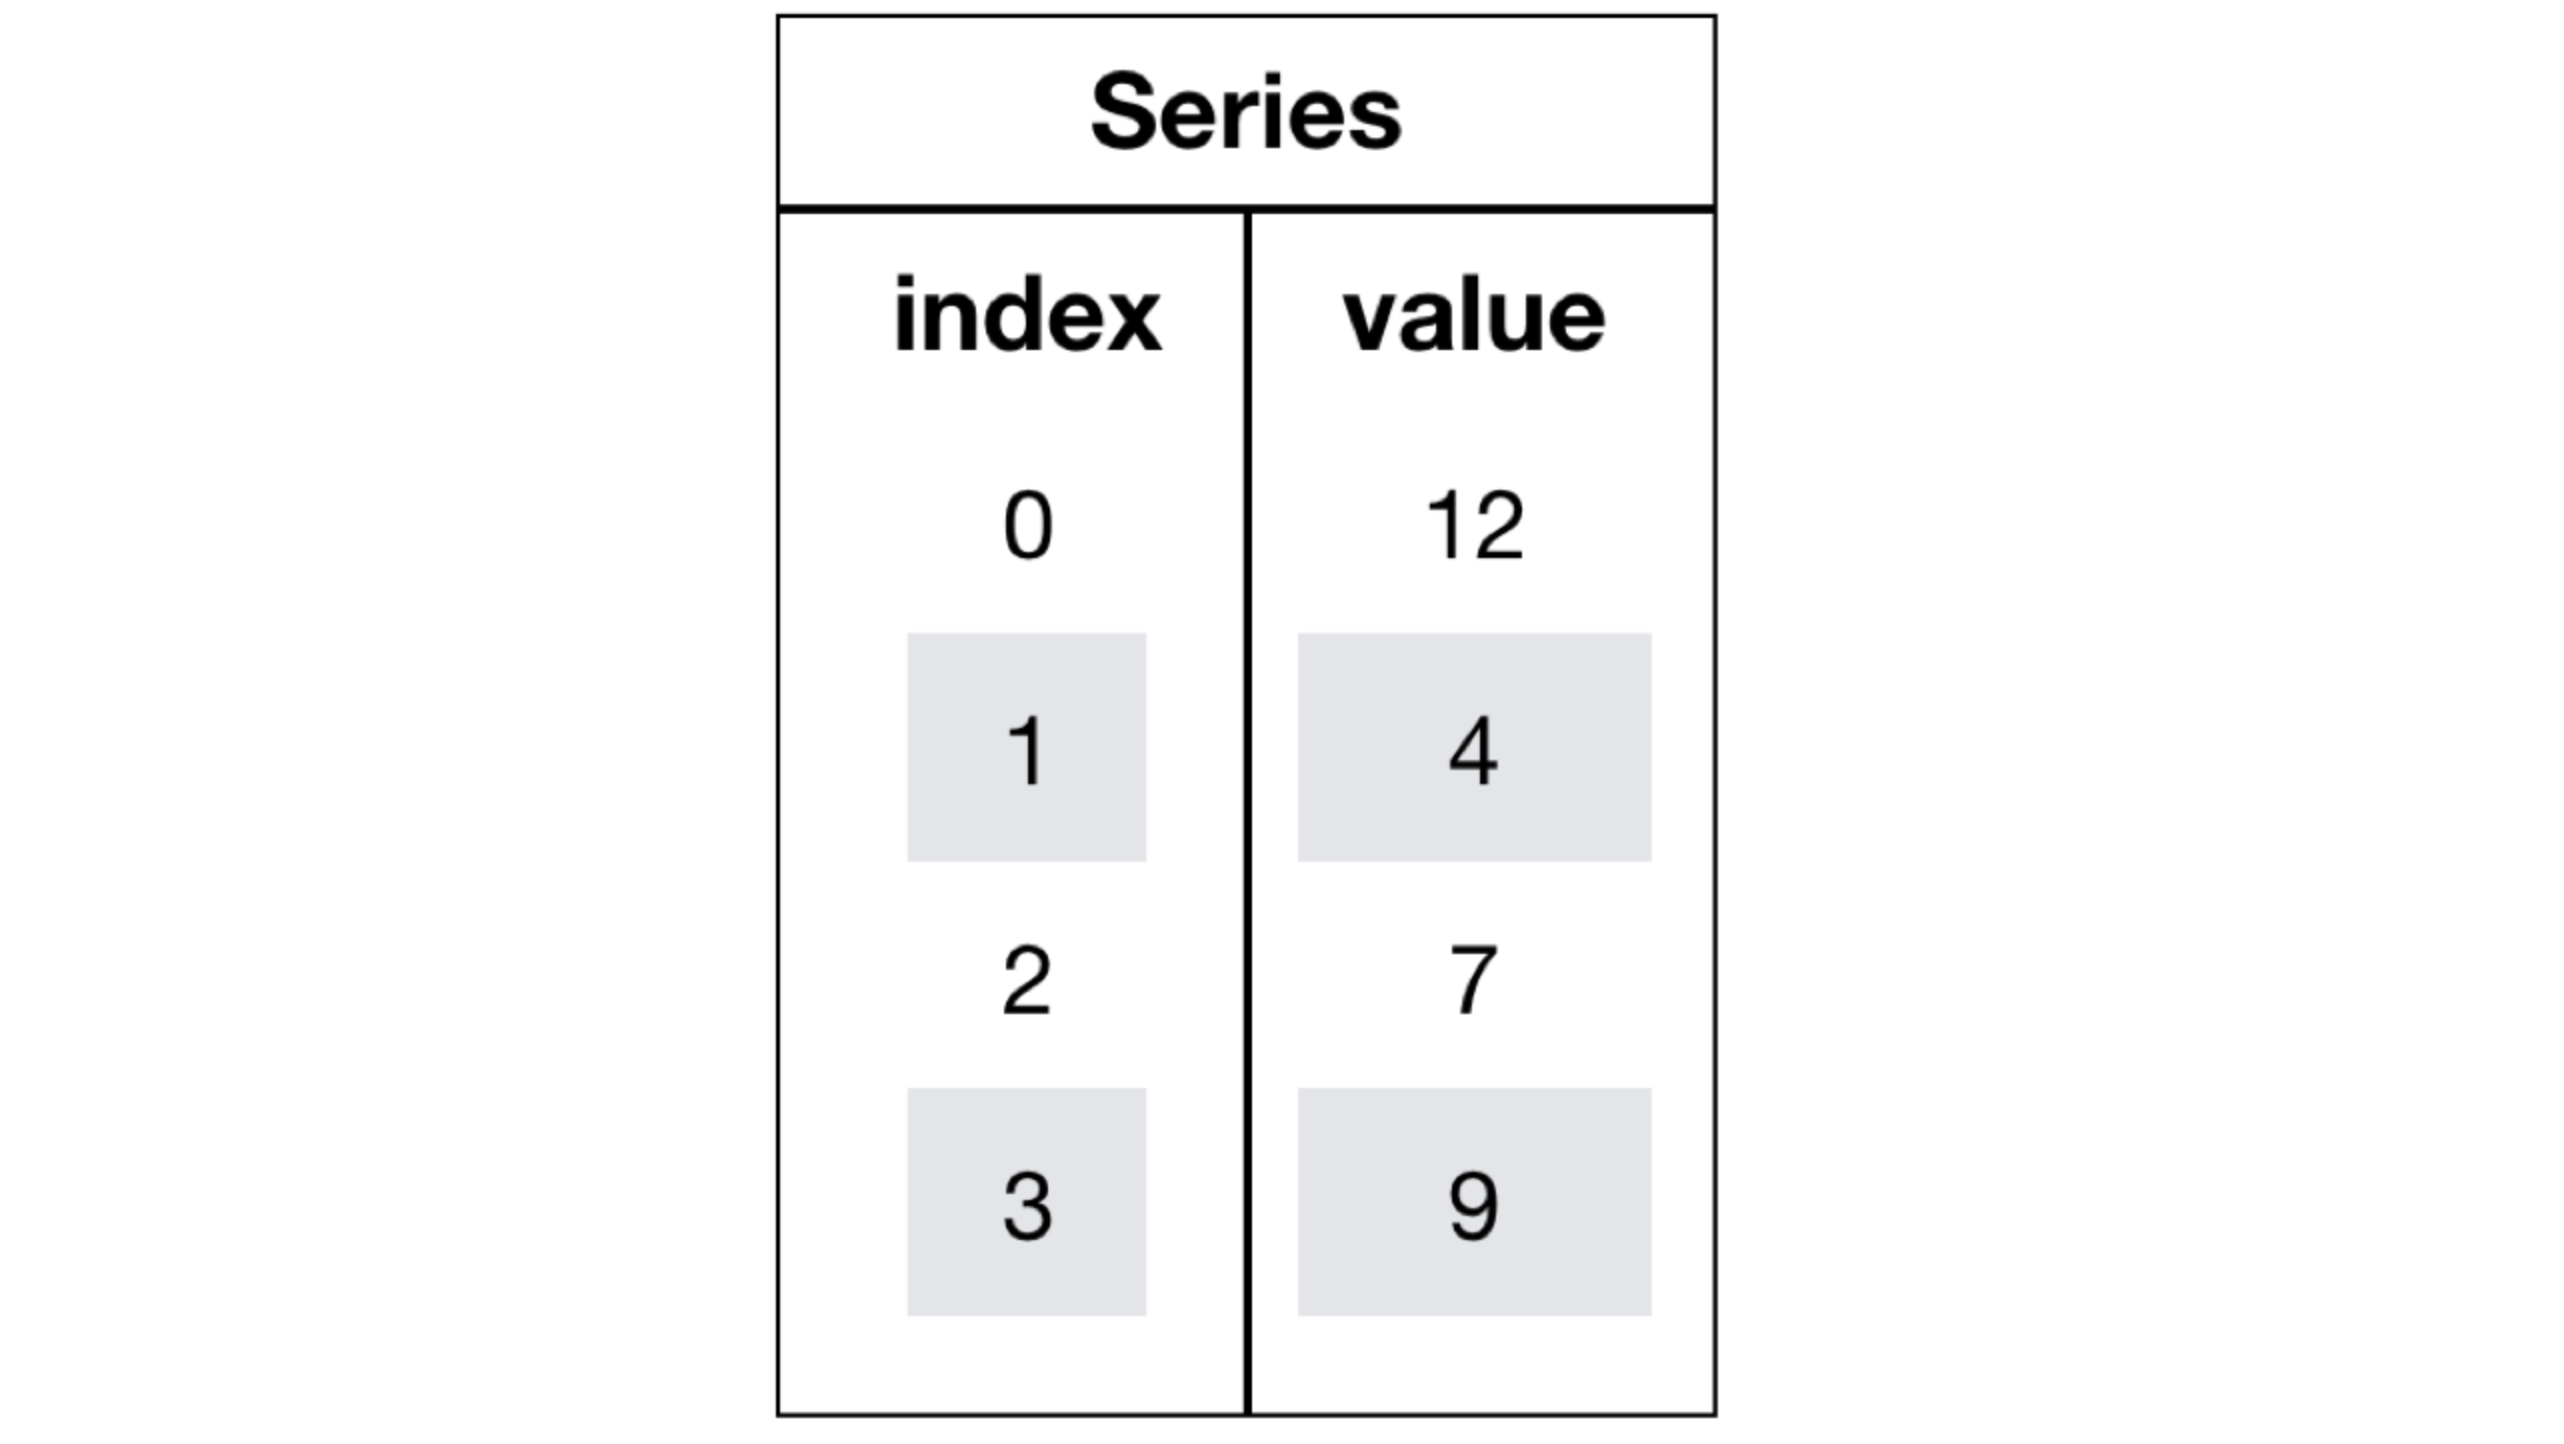
Pandas中一共有三种数据结构,分别为:Series、DataFrame和MultiIndex(老版本中叫Panel )。
其中Series是一维数据结构,DataFrame是二维的表格型数据结构,MultiIndex是三维的数据结构。
1.Series
Series是一个类似于一维数组的数据结构,它能够保存任何类型的数据,比如整数、字符串、浮点数等,主要由一组数据和与之相关的索引两部分构成。
1.1 Series的创建
# 导入pandasimport pandas as pdpd.Series(data=None, index=None, dtype=None)
- 参数:
- data:传入的数据,可以是ndarray、list等
- index:索引,必须是唯一的,且与数据的长度相等。如果没有传入索引参数,则默认会自动创建一个从0-N的整数索引。
- dtype:数据的类型
通过已有数据创建
指定内容,默认索引
pd.Series(np.arange(10))
# 运行结果0 01 12 23 34 45 56 67 78 89 9dtype: int64
指定索引
pd.Series([6.7,5.6,3,10,2], index=[1,2,3,4,5])
# 运行结果1 6.72 5.63 3.04 10.05 2.0dtype: float64
通过字典数据创建
color_count = pd.Series({'red':100, 'blue':200, 'green': 500, 'yellow':1000})color_count
# 运行结果blue 200green 500red 100yellow 1000dtype: int64
1.2 Series的属性
为了更方便地操作Series对象中的索引和数据,Series中提供了两个属性index和values
index ```python color_count.index
结果
Index([‘blue’, ‘green’, ‘red’, ‘yellow’], dtype=’object’)
- values```pythoncolor_count.values# 结果array([ 200, 500, 100, 1000])
也可以使用索引来获取数据:
color_count[2]# 结果100
2.DataFrame
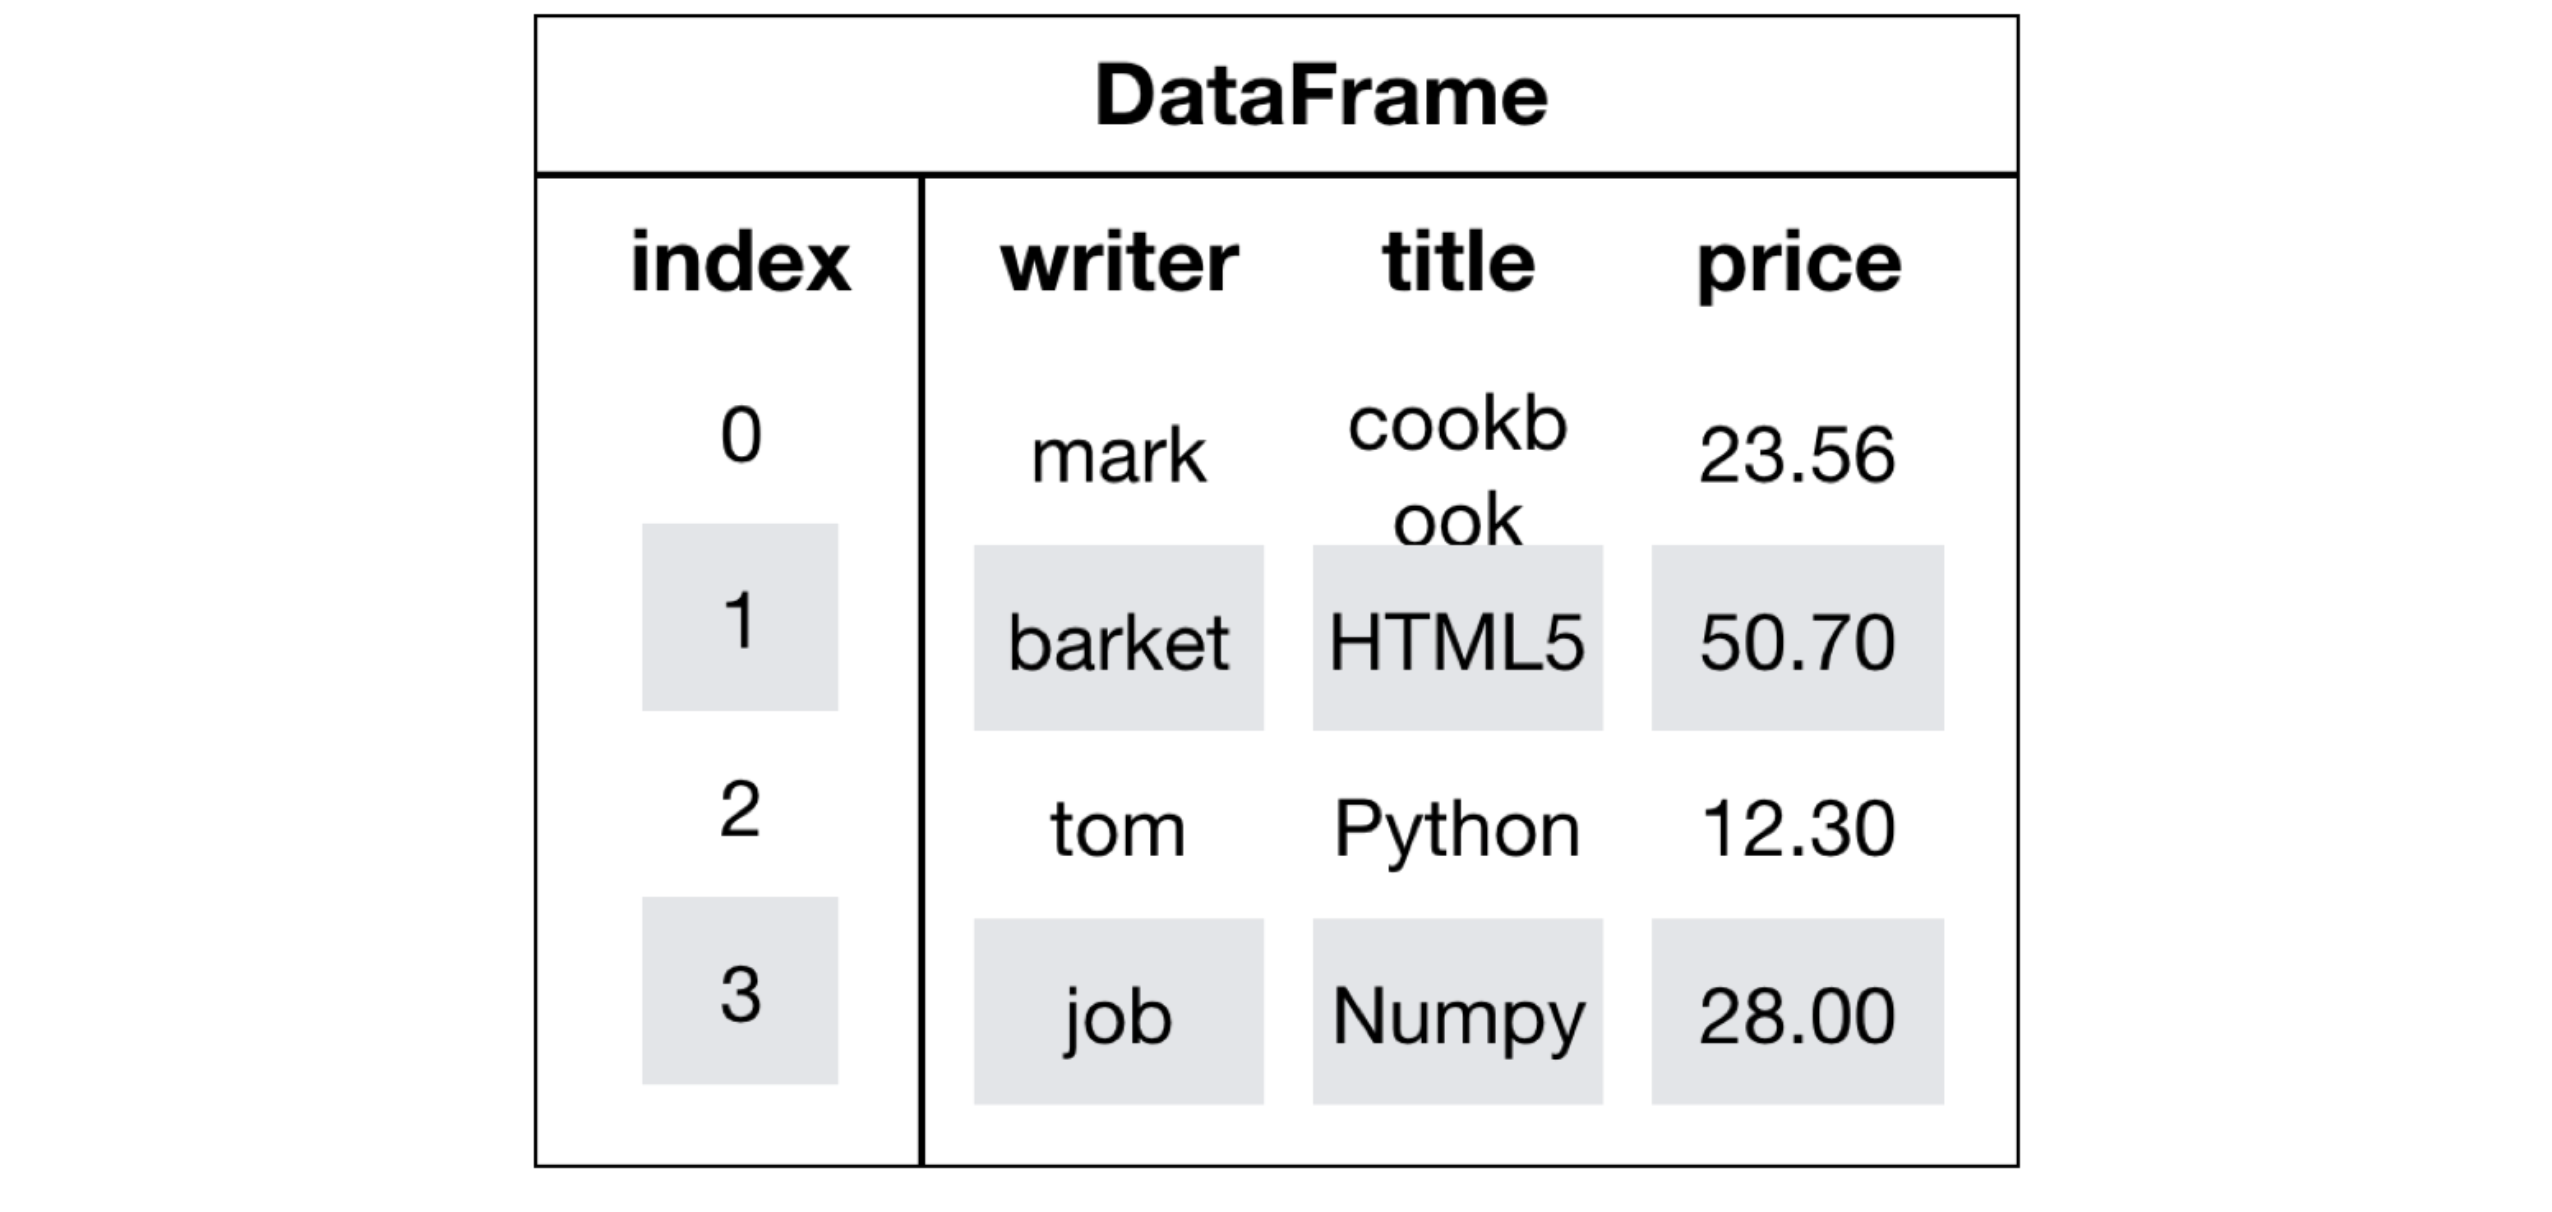
DataFrame是一个类似于二维数组或表格(如excel)的对象,既有行索引,又有列索引
- 行索引,表明不同行,横向索引,叫index,0轴,axis=0
- 列索引,表名不同列,纵向索引,叫columns,1轴,axis=1

2.1 DataFrame的创建
```python导入pandas
import pandas as pd
pd.DataFrame(data=None, index=None, columns=None)
- 参数:- index:行标签。如果没有传入索引参数,则默认会自动创建一个从0-N的整数索引。- columns:列标签。如果没有传入索引参数,则默认会自动创建一个从0-N的整数索引。- 通过已有数据创建举例一:```pythonpd.DataFrame(np.random.randn(2,3))

回忆咱们在前面直接使用np创建的数组显示方式,比较两者的区别。
举例二:创建学生成绩表
# 生成10名同学,5门功课的数据score = np.random.randint(40, 100, (10, 5))# 结果array([[92, 55, 78, 50, 50],[71, 76, 50, 48, 96],[45, 84, 78, 51, 68],[81, 91, 56, 54, 76],[86, 66, 77, 67, 95],[46, 86, 56, 61, 99],[46, 95, 44, 46, 56],[80, 50, 45, 65, 57],[41, 93, 90, 41, 97],[65, 83, 57, 57, 40]])
但是这样的数据形式很难看到存储的是什么的样的数据,可读性比较差!!
问题:如何让数据更有意义的显示?
# 使用Pandas中的数据结构score_df = pd.DataFrame(score)

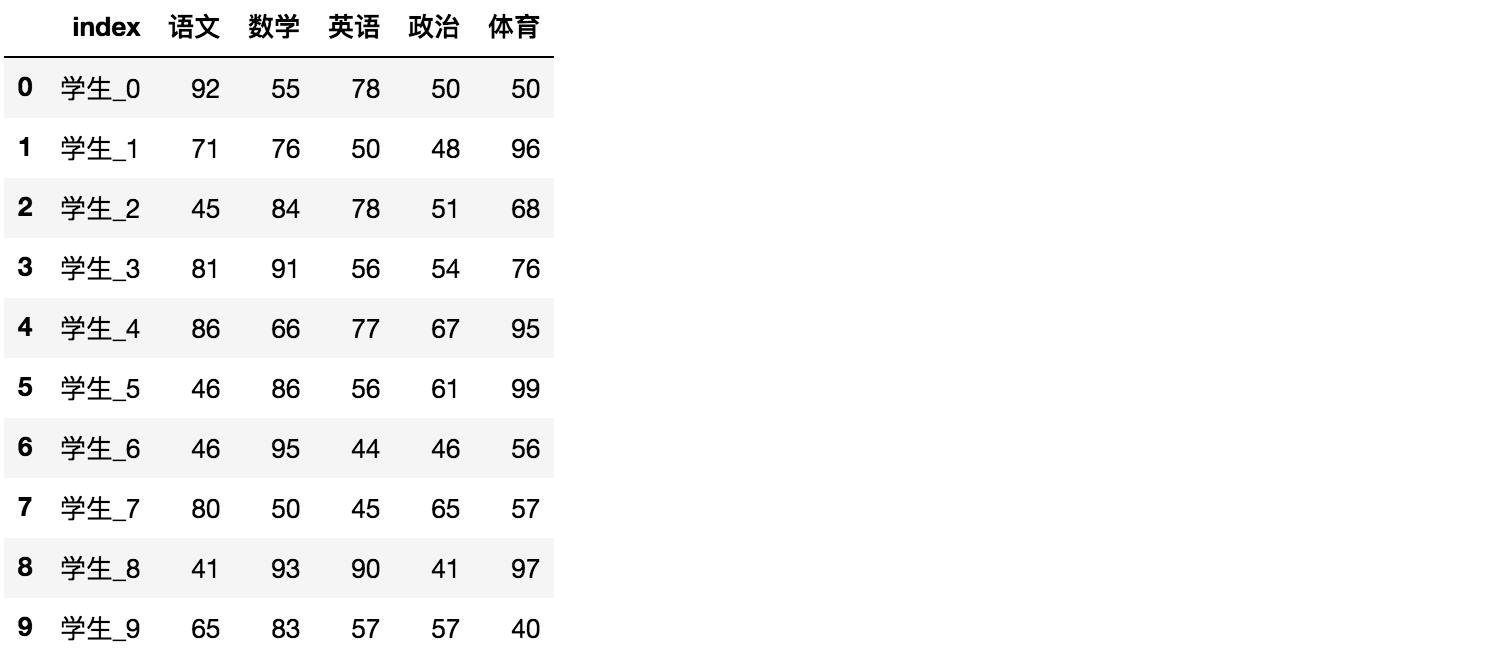
给分数数据增加行列索引,显示效果更佳
效果:
构造列索引序列
stu = [‘同学’ + str(i) for i in range(score_df.shape[0])]
添加行索引
data = pd.DataFrame(score, columns=subjects, index=stu)
<a name="NWkUu"></a>### 2.2 DataFrame的属性- **shape**```pythondata.shape# 结果(10, 5)
- index ```python data.index
结果
Index([‘同学0’, ‘同学1’, ‘同学2’, ‘同学3’, ‘同学4’, ‘同学5’, ‘同学6’, ‘同学7’, ‘同学8’, ‘同学9’], dtype=’object’)
- **columns**DataFrame的列索引列表```pythondata.columns# 结果Index(['语文', '数学', '英语', '政治', '体育'], dtype='object')
- values
直接获取其中array的值
data.valuesarray([[92, 55, 78, 50, 50],[71, 76, 50, 48, 96],[45, 84, 78, 51, 68],[81, 91, 56, 54, 76],[86, 66, 77, 67, 95],[46, 86, 56, 61, 99],[46, 95, 44, 46, 56],[80, 50, 45, 65, 57],[41, 93, 90, 41, 97],[65, 83, 57, 57, 40]])
- T
转置
data.T
结果
- head(5):显示前5行内容
如果不补充参数,默认5行。填入参数N则显示前N行
data.head(5)

- tail(5):显示后5行内容
如果不补充参数,默认5行。填入参数N则显示后N行
data.tail(5)
2.3 DatatFrame索引的设置
2.3.1 修改行列索引值
stu = ["学生_" + str(i) for i in range(score_df.shape[0])]# 必须整体全部修改data.index = stu
注意:以下修改方式是错误的
# 错误修改方式data.index[3] = '学生_3'
2.3.2 重设索引
reset_index(drop=False)
set_index(keys, drop=True)
- keys : 列索引名成或者列索引名称的列表
- drop : boolean, default True.当做新的索引,删除原来的列
设置新索引案例
1、创建
df = pd.DataFrame({'month': [1, 4, 7, 10],'year': [2012, 2014, 2013, 2014],'sale':[55, 40, 84, 31]})month sale year0 1 55 20121 4 40 20142 7 84 20133 10 31 2014
2、以月份设置新的索引
df.set_index('month')sale yearmonth1 55 20124 40 20147 84 201310 31 2014
3、设置多个索引,以年和月份
df = df.set_index(['year', 'month'])dfsaleyear month2012 1 552014 4 402013 7 842014 10 31
注:通过刚才的设置,这样DataFrame就变成了一个具有MultiIndex的DataFrame。
3.MultiIndex与Panel
3.1 MultiIndex
MultiIndex是三维的数据结构;
多级索引(也称层次化索引)是pandas的重要功能,可以在Series、DataFrame对象上拥有2个以及2个以上的索引。
3.1.1 multiIndex的特性
打印刚才的df的行索引结果
df.indexMultiIndex(levels=[[2012, 2013, 2014], [1, 4, 7, 10]],labels=[[0, 2, 1, 2], [0, 1, 2, 3]],names=['year', 'month'])
多级或分层索引对象。
df.index.levels
FrozenList([[1, 2], [1, 4, 7, 10]])
<a name="IuING"></a>#### 3.1.2 multiIndex的创建```pythonarrays = [[1, 1, 2, 2], ['red', 'blue', 'red', 'blue']]pd.MultiIndex.from_arrays(arrays, names=('number', 'color'))# 结果MultiIndex(levels=[[1, 2], ['blue', 'red']],codes=[[0, 0, 1, 1], [1, 0, 1, 0]],names=['number', 'color'])
3.2 Panel
3.2.1 panel的创建
- class
pandas.Panel(data=None, items=None, major_axis=None, minor_axis=None)- 作用:存储3维数组的Panel结构
- 参数:
- data : ndarray或者dataframe
- items : 索引或类似数组的对象,axis=0
- major_axis : 索引或类似数组的对象,axis=1
- minor_axis : 索引或类似数组的对象,axis=2
```python
p = pd.Panel(data=np.arange(24).reshape(4,3,2),
items=list('ABCD'),major_axis=pd.date_range('20130101', periods=3),minor_axis=['first', 'second'])
结果
<a name="yd9H9"></a>#### 3.2.2 查看panel数据```pythonp[:,:,"first"]p["B",:,:]
注:Pandas从版本0.20.0开始弃用:推荐的用于表示3D数据的方法是通过DataFrame上的MultiIndex方法
4 小结
- pandas的优势【了解】
- 增强图表可读性
- 便捷的数据处理能力
- 读取文件方便
- 封装了Matplotlib、Numpy的画图和计算
- series【知道】
- 创建
- pd.Series([], index=[])
- pd.Series({})
- 属性
- 对象.index
- 对象.values
- 创建
- DataFrame【掌握】
- 创建
- pd.DataFrame(data=None, index=None, columns=None)
- 属性
- shape — 形状
- index — 行索引
- columns — 列索引
- values — 查看值
- T — 转置
- head() — 查看头部内容
- tail() — 查看尾部内容
- DataFrame索引
- 修改的时候,需要进行全局修改
- 对象.reset_index()
- 对象.set_index(keys)
- 创建
- MultiIndex与Panel【了解】
- multiIndex:
- 类似ndarray中的三维数组
- 创建:
- pd.MultiIndex.from_arrays()
- 属性:
- 对象.index
- panel:
- pd.Panel(data, items, major_axis, minor_axis)
- panel数据要是想看到,则需要进行索引到dataframe或者series才可以
- multiIndex:


