1 需求
现在我们有一组从2006年到2016年1000部最流行的电影数据
数据来源:https://www.kaggle.com/damianpanek/sunday-eda/data
- 问题1:我们想知道这些电影数据中评分的平均分,导演的人数等信息,我们应该怎么获取?
- 问题2:对于这一组电影数据,如果我们想rating,runtime的分布情况,应该如何呈现数据?
问题3:对于这一组电影数据,如果我们希望统计电影分类(genre)的情况,应该如何处理数据?
2 实现
首先获取导入包,获取数据
%matplotlib inlineimport pandas as pdimport numpy as npfrom matplotlib import pyplot as plt
#文件的路径path = "./data/IMDB-Movie-Data.csv"#读取文件df = pd.read_csv(path)
2.1 问题一:
我们想知道这些电影数据中评分的平均分,导演的人数等信息,我们应该怎么获取?
得出评分的平均分
使用mean函数
df["Rating"].mean()
- 得出导演人数信息
求出唯一值,然后进行形状获取
## 导演的人数# df["Director"].unique().shape[0]np.unique(df["Director"]).shape[0]644
2.2 问题二:
对于这一组电影数据,如果我们想Rating,Runtime (Minutes)的分布情况,应该如何呈现数据?
- 直接呈现,以直方图的形式
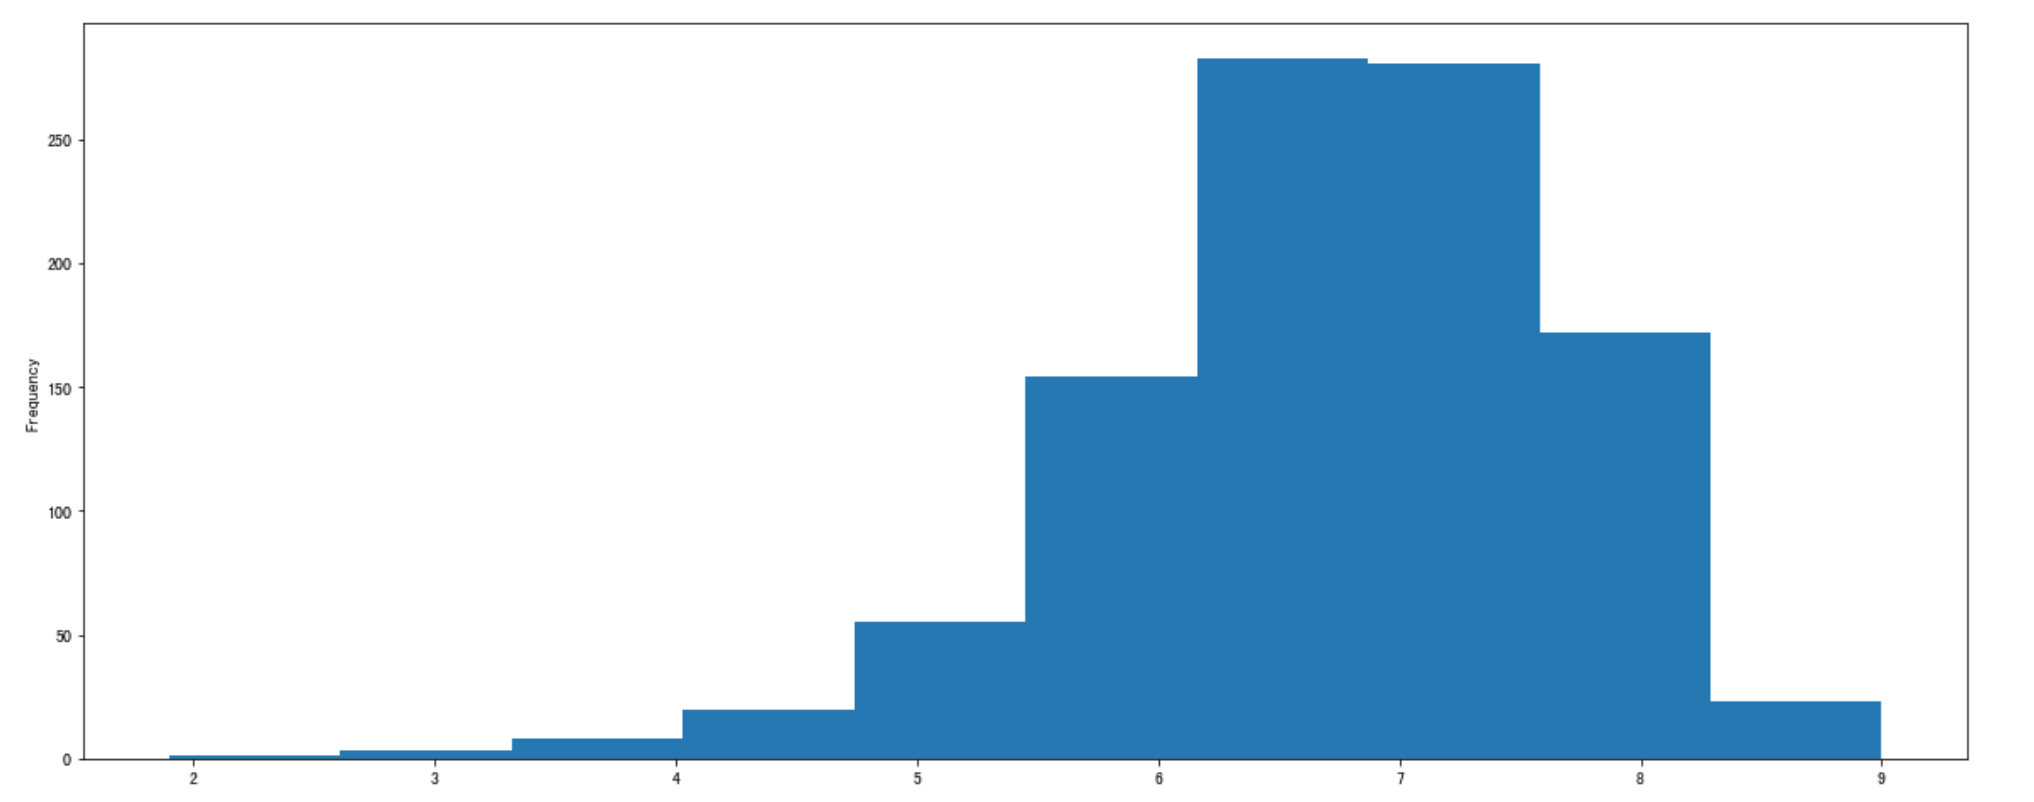
选择分数列数据,进行plot
df["Rating"].plot(kind='hist',figsize=(20,8))

- Rating进行分布展示
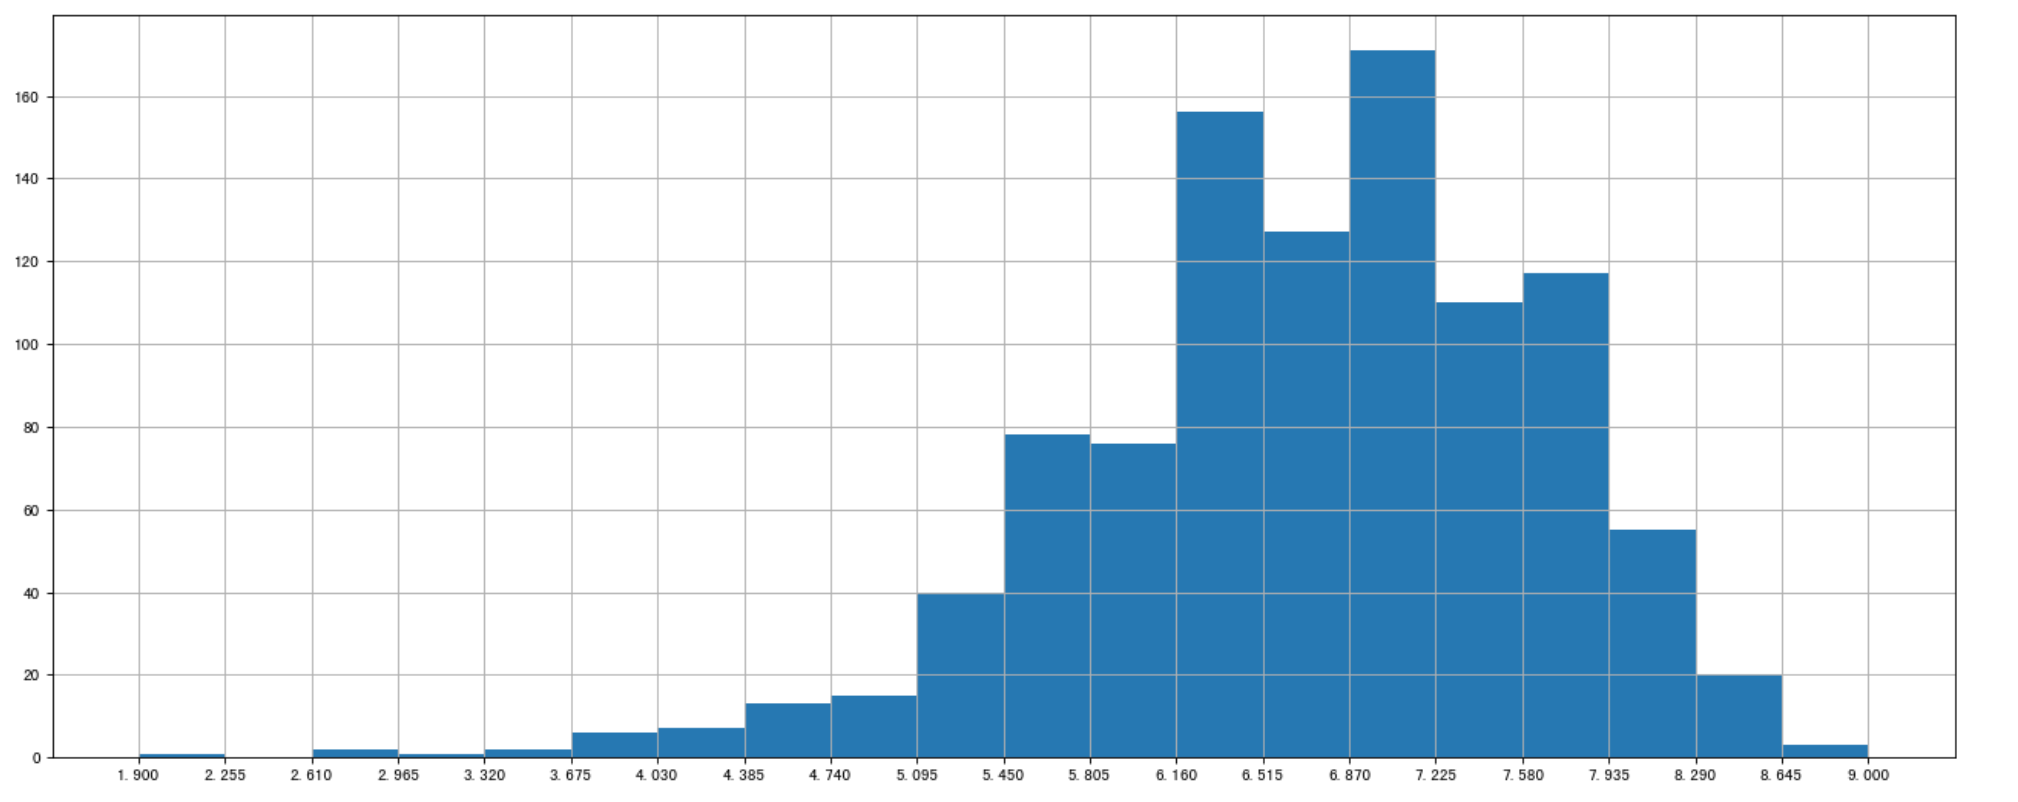
进行绘制直方图
plt.figure(figsize=(20,8),dpi=80)plt.hist(df["Rating"].values,bins=20)plt.show()
修改刻度的间隔
# 求出最大最小值max_ = df["Rating"].max()min_ = df["Rating"].min()# 生成刻度列表t1 = np.linspace(min_,max_,num=21)# [ 1.9 2.255 2.61 2.965 3.32 3.675 4.03 4.385 4.74 5.095 5.45 5.805 6.16 6.515 6.87 7.225 7.58 7.935 8.29 8.645 9. ]# 修改刻度plt.xticks(t1)# 添加网格plt.grid()

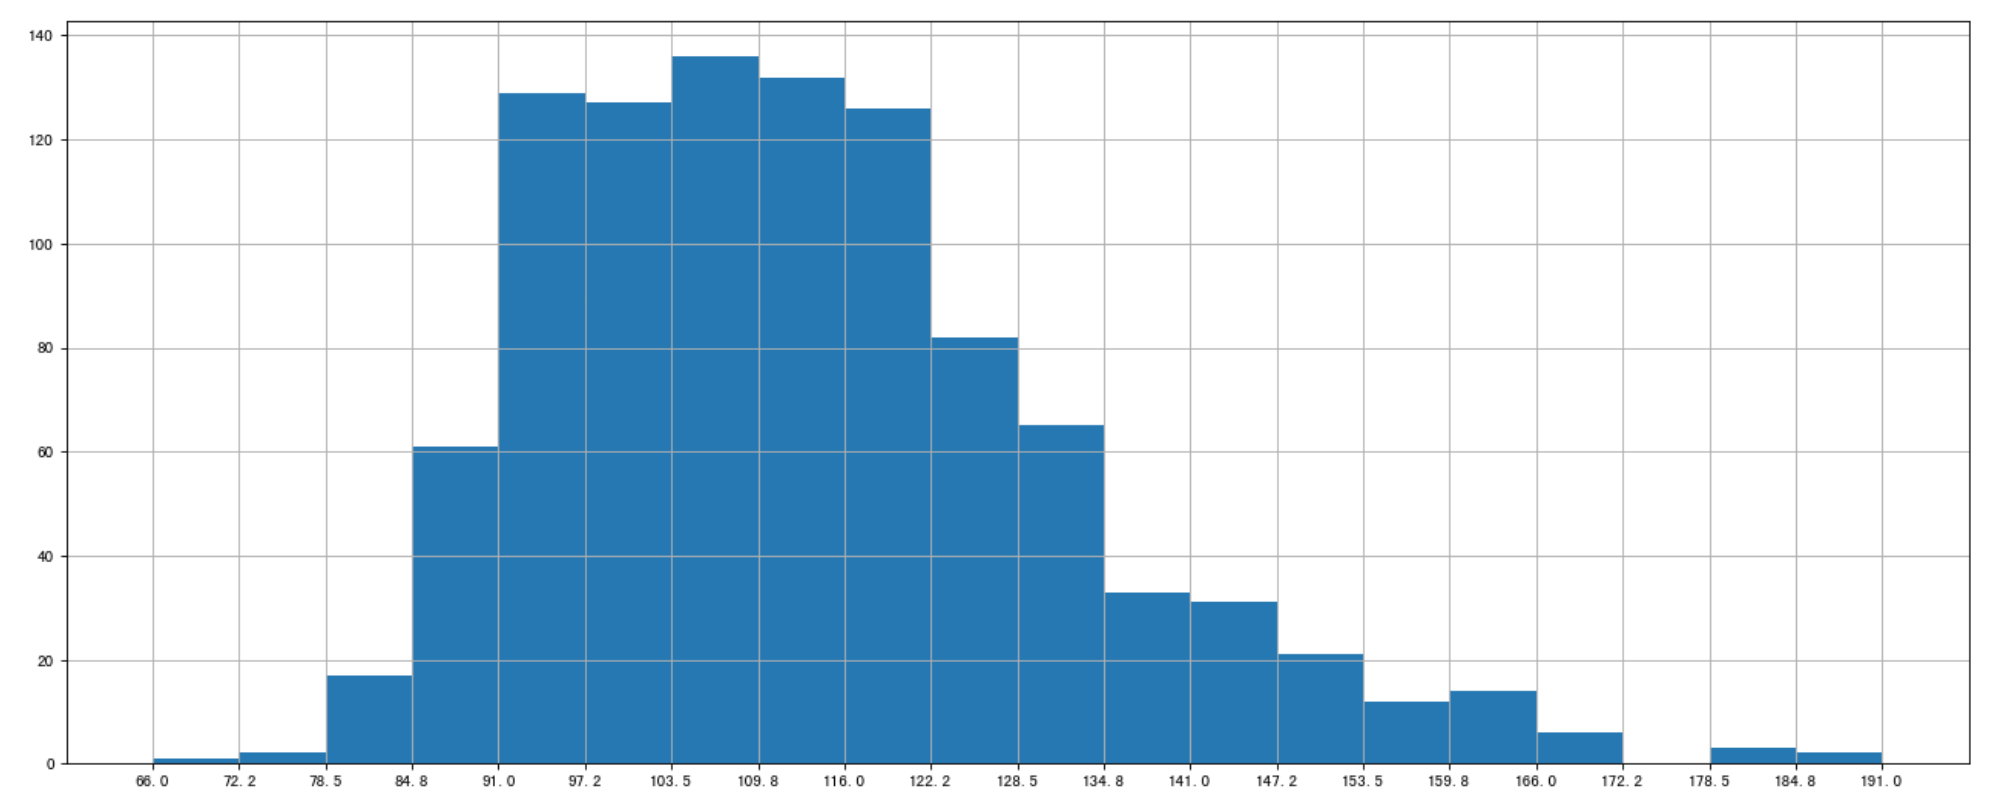
- Runtime (Minutes)进行分布展示
进行绘制直方图
plt.figure(figsize=(20,8),dpi=80)plt.hist(df["Runtime (Minutes)"].values,bins=20)plt.show()
修改间隔
# 求出最大最小值max_ = df["Runtime (Minutes)"].max()min_ = df["Runtime (Minutes)"].min()# # 生成刻度列表t1 = np.linspace(min_,max_,num=21)# 修改刻度plt.xticks(np.linspace(min_,max_,num=21))# 添加网格plt.grid()
2.3 问题三:
对于这一组电影数据,如果我们希望统计电影分类(genre)的情况,应该如何处理数据?
- 思路分析
- 思路
- 1、创建一个全为0的dataframe,列索引置为电影的分类,temp_df
- 2、遍历每一部电影,temp_df中把分类出现的列的值置为1
- 3、求和
- 思路
- 1、创建一个全为0的dataframe,列索引置为电影的分类,temp_df
```python
进行字符串分割
temp_list = [i.split(“,”) for i in df[“Genre”]]获取电影的分类
genre_list = np.unique([i for j in temp_list for i in j])
增加新的列
temp_df = pd.DataFrame(np.zeros([df.shape[0],genre_list.shape[0]]),columns=genre_list)
- 2、遍历每一部电影,temp_df中把分类出现的列的值置为1```pythonfor i in range(1000):#temp_list[i] ['Action','Adventure','Animation']temp_df.ix[i,temp_list[i]]=1print(temp_df.sum().sort_values())
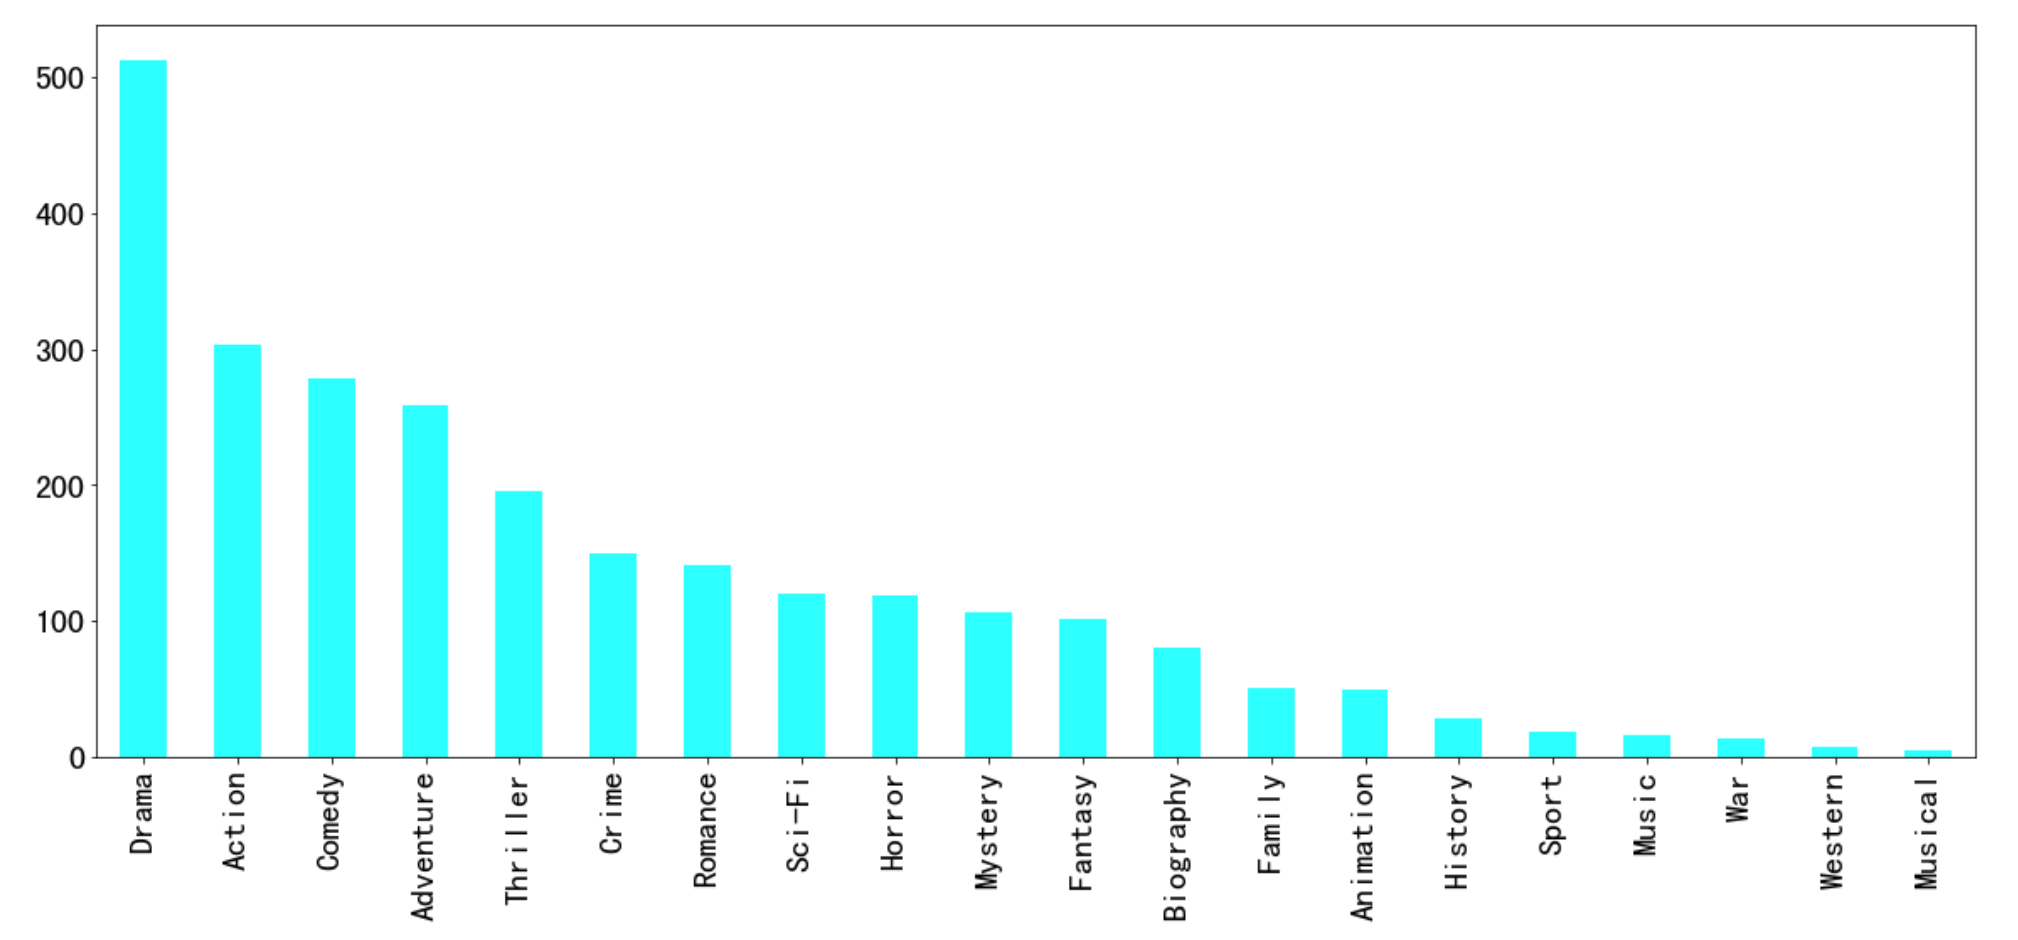
- 3、求和,绘图 ```python temp_df.sum().sort_values(ascending=False).plot(kind=”bar”,figsize=(20,8),fontsize=20,colormap=”cool”)
Musical 5.0
Western 7.0
War 13.0
Music 16.0
Sport 18.0
History 29.0
Animation 49.0
Family 51.0
Biography 81.0
Fantasy 101.0
Mystery 106.0
Horror 119.0
Sci-Fi 120.0
Romance 141.0
Crime 150.0
Thriller 195.0
Adventure 259.0
Comedy 279.0
Action 303.0
Drama 513.0
dtype: float64
```


