思维导图
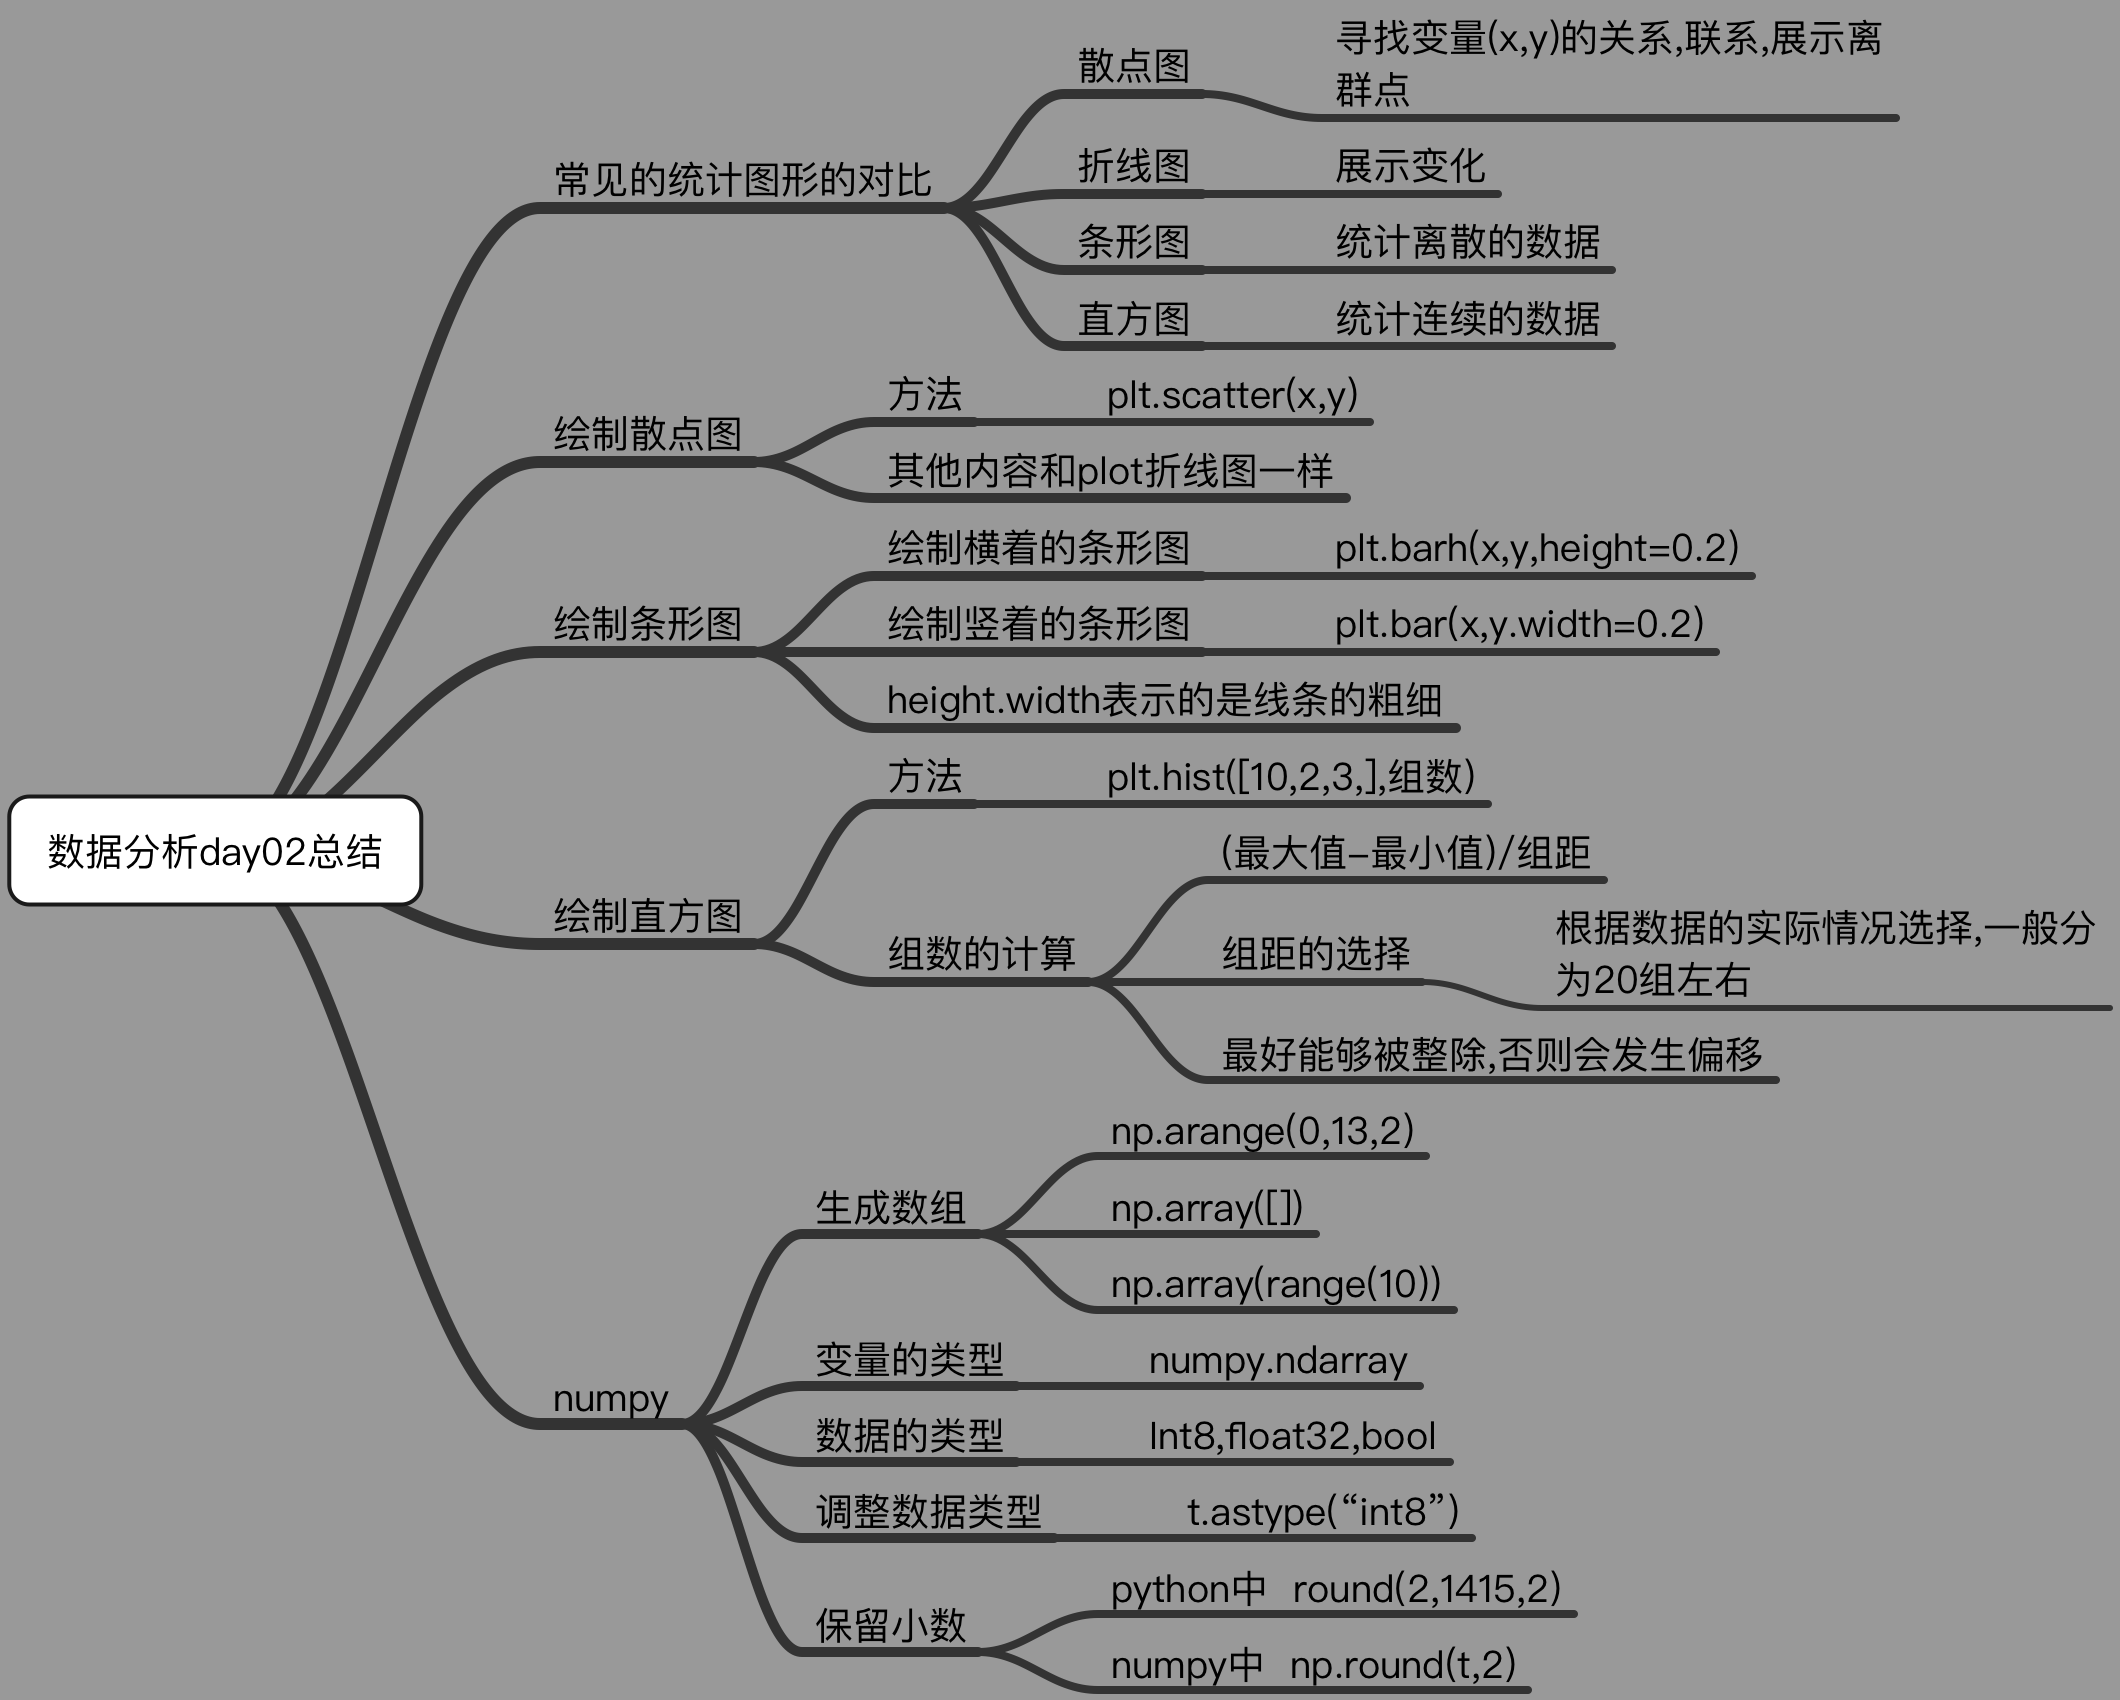
四种图形使用情况对比
- 观察变化的时候使用 折线图,plot
- 观察不同维度之间的关系 散点图 ,scatter
- 统计离散的数据 条形图 bar,barh
-
scatter
-
bar,barh
plt.bar(x,y,width=0.3)
-
hist
plt.hist([1,2,3],组数)
-
numpy
创建数组
import numpy as np np.array([]) np.array(range()) np.arange(3,10,2) #生成从3到10,步长为2的一个一维数组
数据类型
int, float, “int64” ,”int32”,”float32”,bool t1.dtype #观察数据类型 t1.astype()

若有收获,就点个赞吧
0 人点赞
