1 几个小例子
最简单的图表应该就是一个函数图像 .
首先 import 库,并且设置绘图的样式:
%matplotlib inlineimport matplotlib.pyplot as pltplt.style.use('seaborn-whitegrid')import numpy as np
首先创建图像 ( figure ) 和坐标轴 ( axes ):
fig = plt.figure()ax = plt.axes()
在 notebook 中执行后,会自动嵌入下面的图像: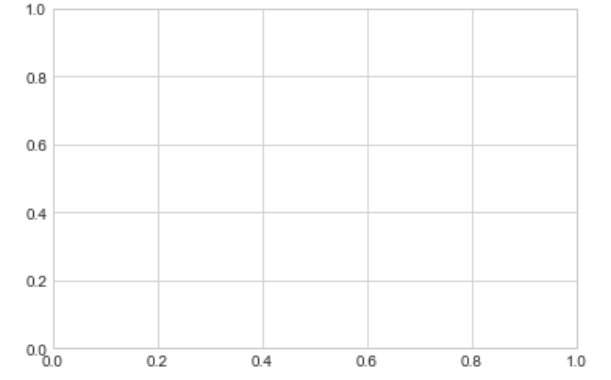
在 Matplotlib 中, figure ( 类 plt.Figure 的一个实例 ) 可以认为就是一个容器 ( container ),这个容器里面装有所有绘制坐标中、曲线、标签等的对象。 axes ( 类 plt.Axes 的一个实例 ) 包括:坐标轴的刻度、标题。
然后就可以使用下面的命令进行绘图啦:
fig = plt.figure()ax = plt.axes()x = np.linspace(0 ,10, 100)ax.plot(x, np.sin(x))
画出来的图张这个熊样(bushi):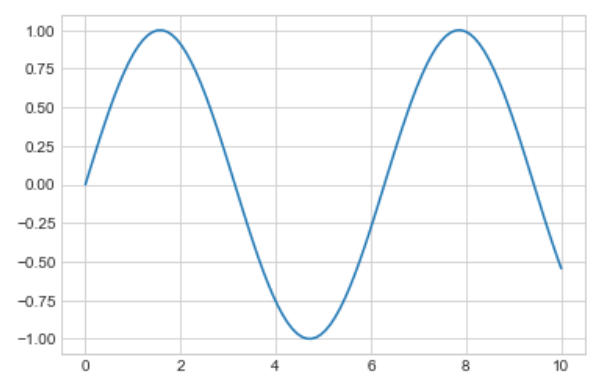
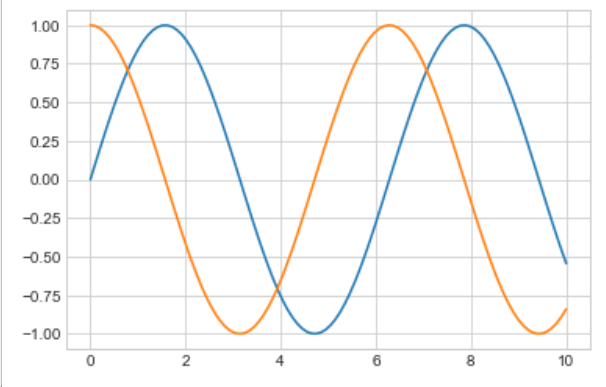
如果想在一幅图像中画多条曲线,那么就多次调用 plt.plot() 就可以啦:
plt.plot(x, np.sin(x))plt.plt(x, np.cos(x))
2 修饰图表:曲线的颜色与样式
在 plt.plot() 函数中,使用形参 color 可以修改曲线的颜色:
plt.plot(x, np.sin(x - 0), color='blue') # specify color by nameplt.plot(x, np.sin(x - 1), color='g') # short colro code (rgbcmyk)plt.plot(x, np.sin(x - 2), color='0.75') # Grayscale between 0 and 1plt.plot(x, np.sin(x - 3), color='#FFDD44') # Hex code (RRGGBB from 00 to FF)plt.plot(x, np.sin(x - 4), color=(1.0, 0.2, 0.3)) # RGB tuple, values 0 to 1plt.plot(x, np.sin(x - 5), color='chartreuse') # all HTML color names supported
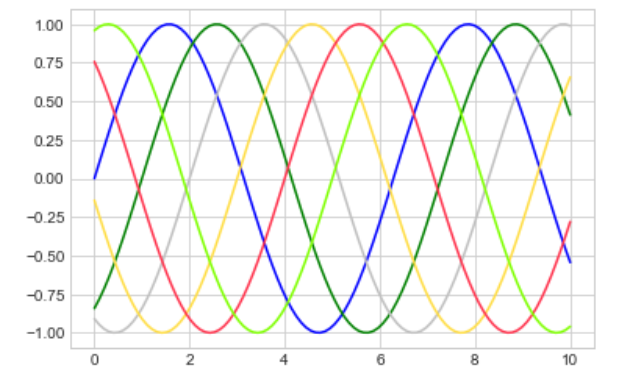
如果没有指定曲线的颜色,Matplotlib 会自动从默认的颜色集中选择。
同样,曲线的样式可以通过 plt.plot() 函数中的形参 linestyle 来指定:
plt.plot(x, x + 0, linestyle='solid')plt.plot(x, x + 1, linestyle='dashed')plt.plot(x, x + 2, linestyle='dashdot')plt.plot(x, x + 3, linestyle='dotted')# For short, you can use the following codes:plt.plot(x, x + 4, linestyle='-')plt.plot(x, x + 5, linestyle='--')plt.plot(x, x + 6, linestyle='-.')plt.plot(x, x + 7, linestyle=':')
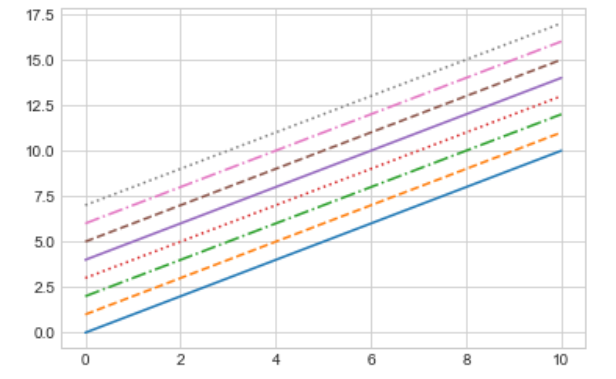
当然,如果你还嫌麻烦,可以将 linestyle 和 color 合并:
plt.plot(x, x + 0, '-g') # solid greenplt.plot(x, x + 1, '--c') # dashed cyanplt.plot(x, x + 2, '-.k') # dashdot blackplt.plot(x, x + 3, ':r'); # dotted red
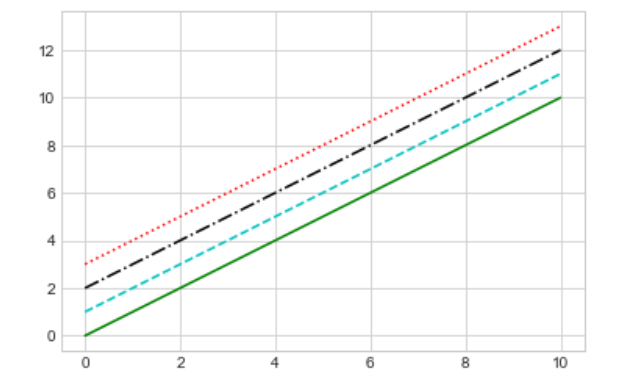
当然,在 plt.plot() 中还有很多别的关键字,好好查查吧!
3 修饰图表:坐标轴范围
(按照原作者的话 “Matplotlib does a decent job for choosing default axes limits for your plot”, decent 用的好呀!
最基本的方法我们可以使用 plt.xlim() 和 plt.ylim() 方法来修改坐标轴的范围:
plt.plot(x, np.sin(x))plt.xlim(-1, 11)plt.ylim(-1.5, 1.5)
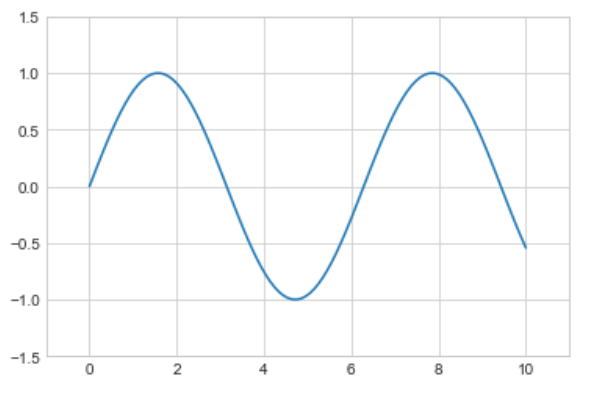
可以看到,
plt.xlim()和plt.ylim()都是左闭右闭的区间,这与 Python 内置左闭右开的风格不大一样(比如range()就是左闭右开的区间。
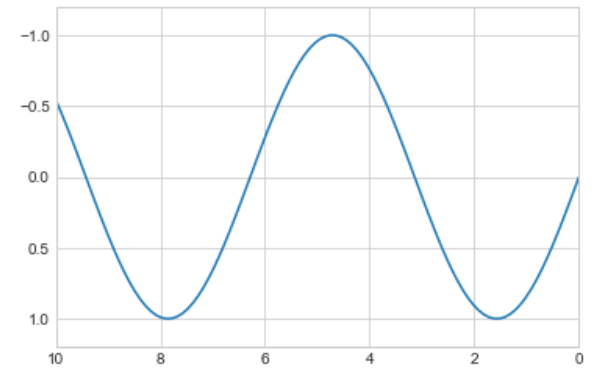
这玩意也可以用来将坐标轴倒置:
plt.plot(x, np.sin(x))plt.xlim(10, 0)plt.ylim(1.2, -1.2);
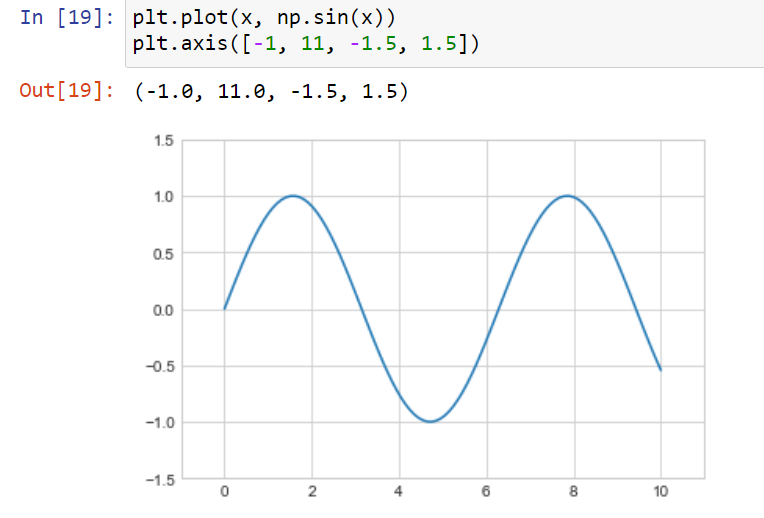
另外一种方法是使用 plt.axis() (注意:这里是 axis() ,不是 axes() )。通过传入 [xmin, xmax, ymin, ymax] 这样的 list ,就可以一步到胃:
plt.plot(x, np.sin(x))plt.axis([-1, 11, -1.5, 1.5])
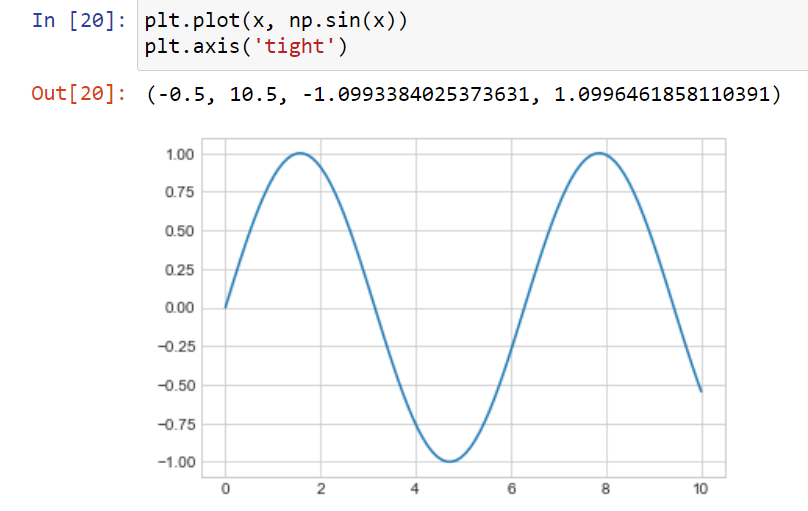
当然, plt.axis() 还有更强大的功能!比如可以通过下面的代码让曲线的界限变得紧凑:
plt.plot(x, np.sin(x))plt.axis('tight')
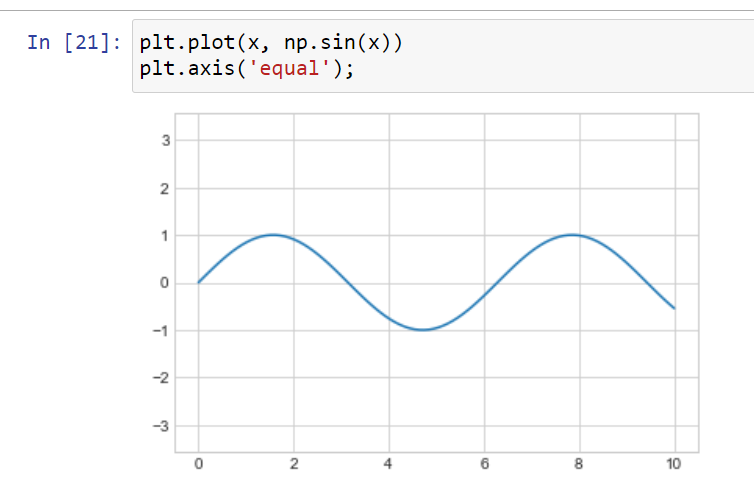
也可以通过下面的代码让 x 轴和 y 轴的单位长度相等:
plt.plot(x, np.sin(x))plt.axis('equal');
4 加入标签 Labeling Plots
这一小节包括:图表的标题、坐标轴的标签以及简单的图例。
首先是坐标轴的标签:
plt.plot(x, np.sin(x))plt.title("A Sine Curve")plt.xlabel("x")plt.ylabel("sin(x)")
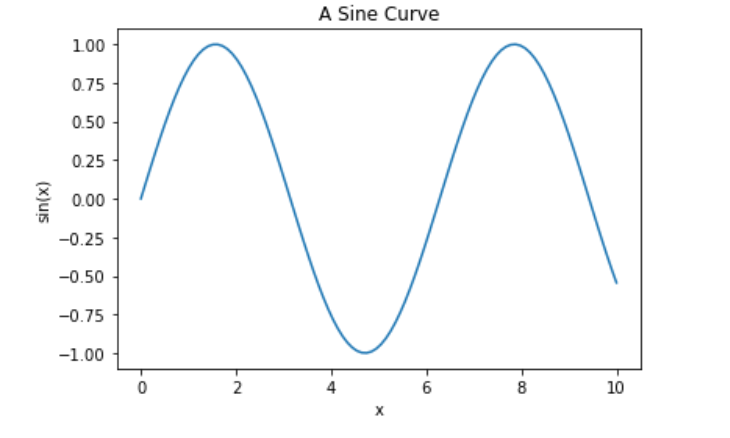
关于标题和标签的位置、大小以及样式,都可以通过向上面这三个函数传递不同的参数值来修改。具体可以查看Matplotlib 的官方文档。
当一个图像上有多条曲线的时候,我们就可以创建图例来更好的展示图表。 plt.legend() 可以创建图例,图例中曲线的名字可以通过向 plt.plot() 中传递 label 参数进行修改:
plt.plot(x, np.sin(x), '-g', label='sin(x)')plt.plot(x, np.cos(x), ':b', label='cos(x)')plt.axis('equal')plt.legend()
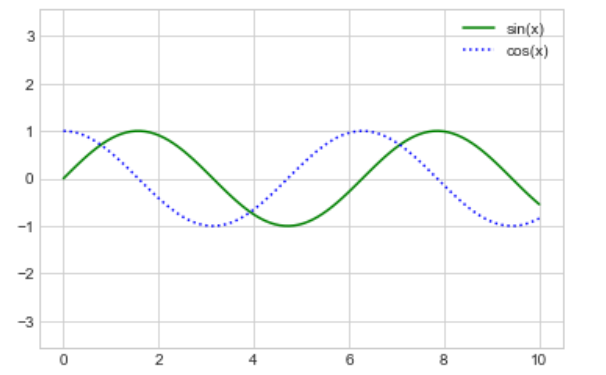
关于图例的更多高级的使用方法,在第 6 章自定义图例中进行讲解。
5 Matplotlib 的小陷阱
原文的标题为 “Aside: Matplotlib Gotchas”.
虽然绝大多数 plt 中 的函数被直接翻译成 ax 中的方法,比如plt.plot() → ax.plot(), plt.legend() → ax.legend() . 但是也有一些不大一样的,这是个坑:
plt.xlabel()→ax.set_xlabel()plt.ylabel()→ax.set_ylabel()plt.xlim()→ax.set_xlim()plt.ylim()→ax.set_ylim()plt.title()→ax.set_title()
在面向对象的接口中,我们一般不单独使用这些方法,取而代之的是使用 ax.set() 方法来设置这些参数:
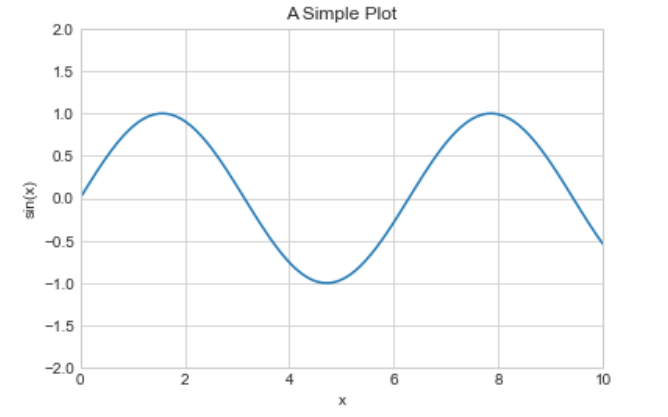
ax = plt.axes()ax.plot(x, np.sin(x))ax.set(xlim=(0, 10), ylim=(-2, 2),xlabel='x', ylabel='sin(x)',title='A Simple Plot')
