安装Prometheus
下载安装包:https://prometheus.io/download/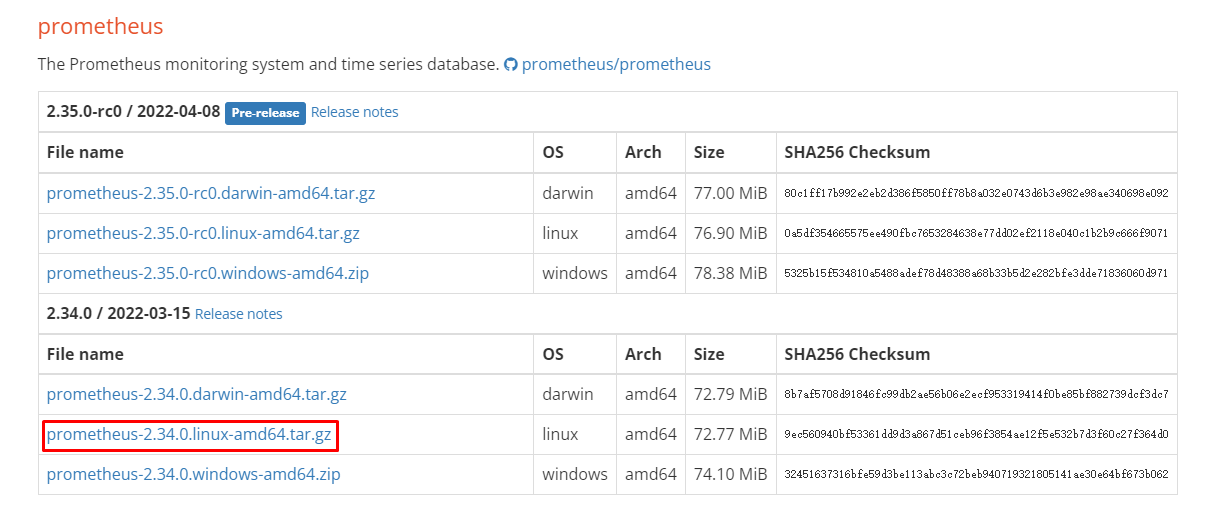
解压安装包
tar -zxvf prometheus-2.34.0.linux-amd64.tar.gz
启动prometheus
cd prometheus-2.34.0.linux-amd64./prometheus --config.file=prometheus.yml
推荐使用动态更新配置方式启动
./prometheus --config.file=prometheus.yml --web.enable-lifecycle
每当配置更新了,可以通过两种热加载方式来操作,一个是直接用kill命令发送HUP信号,一个是开启web.enable-lifecycle选项后使用curl命令
kill -HUP `pidof prometheus`curl -X POST http://localhost:9090/-/reload
prometheus UI页面:http://192.168.1.10:9090/graph
prometheus.yml参数介绍
global: #这里的配置项可以单独配置在某个job中scrape_interval: 15s #采集数据间隔,默认15秒evaluation_interval: 15s 告警规则监测频率,比如已经设置了内存使用大于70%就告警的规则,这里就会每15秒执行一次告警规则scrape_timeout:10s #采集超时时间#alerting:# alertmanagers:# - static_configs:# - targets:# - alertmanager:9093scrape_configs:- job_name: 'prometheus-server' #被监控资源的组名称为jobmetrics_path defaults to '/metrics' #该行可不写,获取数据URI默认为/metricsscheme defaults to 'http' #默认http方式采集static_configs:- targets: ['localhost:9090','192.168.1.100:9100'] #节点地址与获取Metrics数据端口,多个地址用逗号分隔,也可以写多行- job_name: 'nodes'file_sd_configs:static_configs:- targets:- 192.168.1.101:9100- 192.168.1.102:9100- 192.168.1.103:9100
安装可视化工具Grafana
下载地址:https://grafana.com/grafana/download
wget https://dl.grafana.com/enterprise/release/grafana-enterprise-8.4.6-1.x86_64.rpmsudo yum install grafana-enterprise-8.4.6-1.x86_64.rpm
systemctl daemon-reloadsystemctl start grafana-serversystemctl status grafana-server
登录:http://192.168.1.10:3000/login,账号:admin 密码:admin
Grafana集成Prometheus
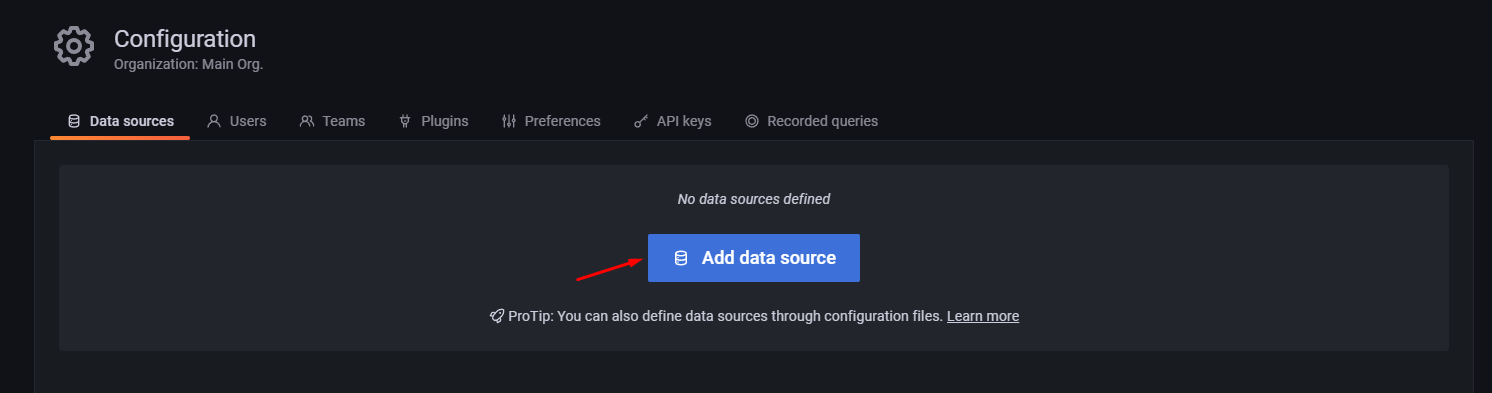
1、新增一个数据源,数据源类型选择Prometheus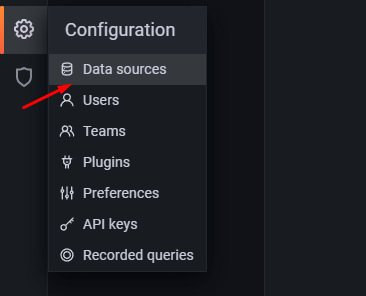
2、配置Prometheus服务端的地址和端口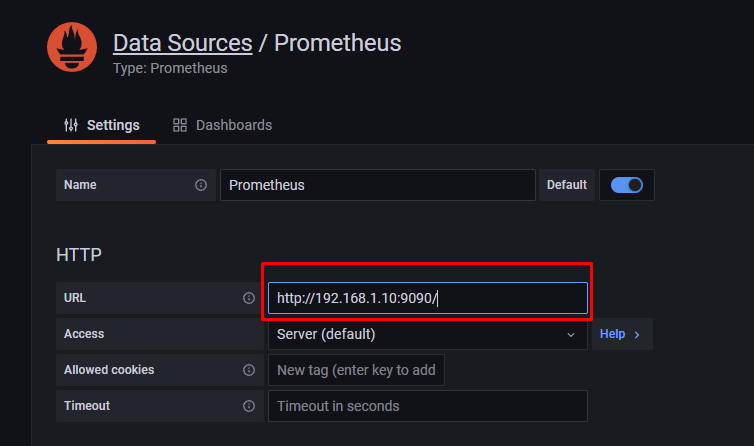
3、添加Dashbord,可以直接导入现成模板,也可以去https://grafana.com/dashboards网站上下载其他Dashboard模板 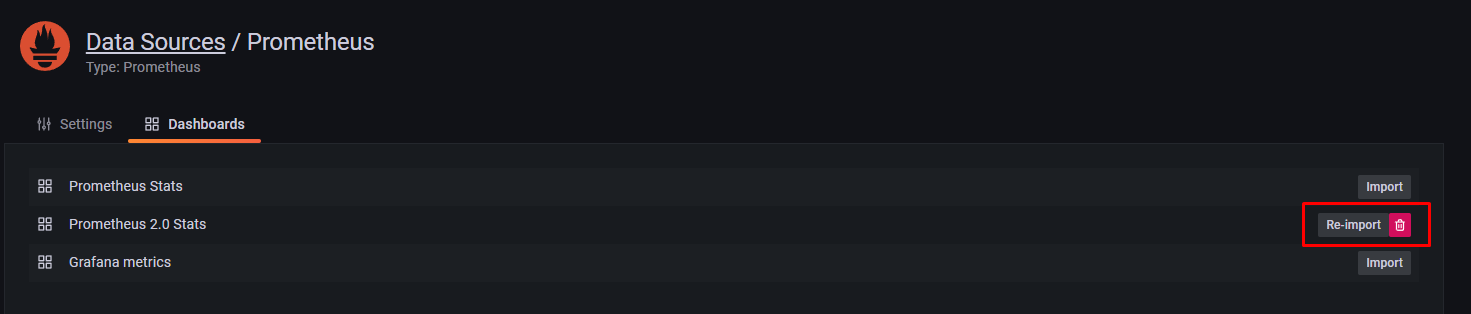
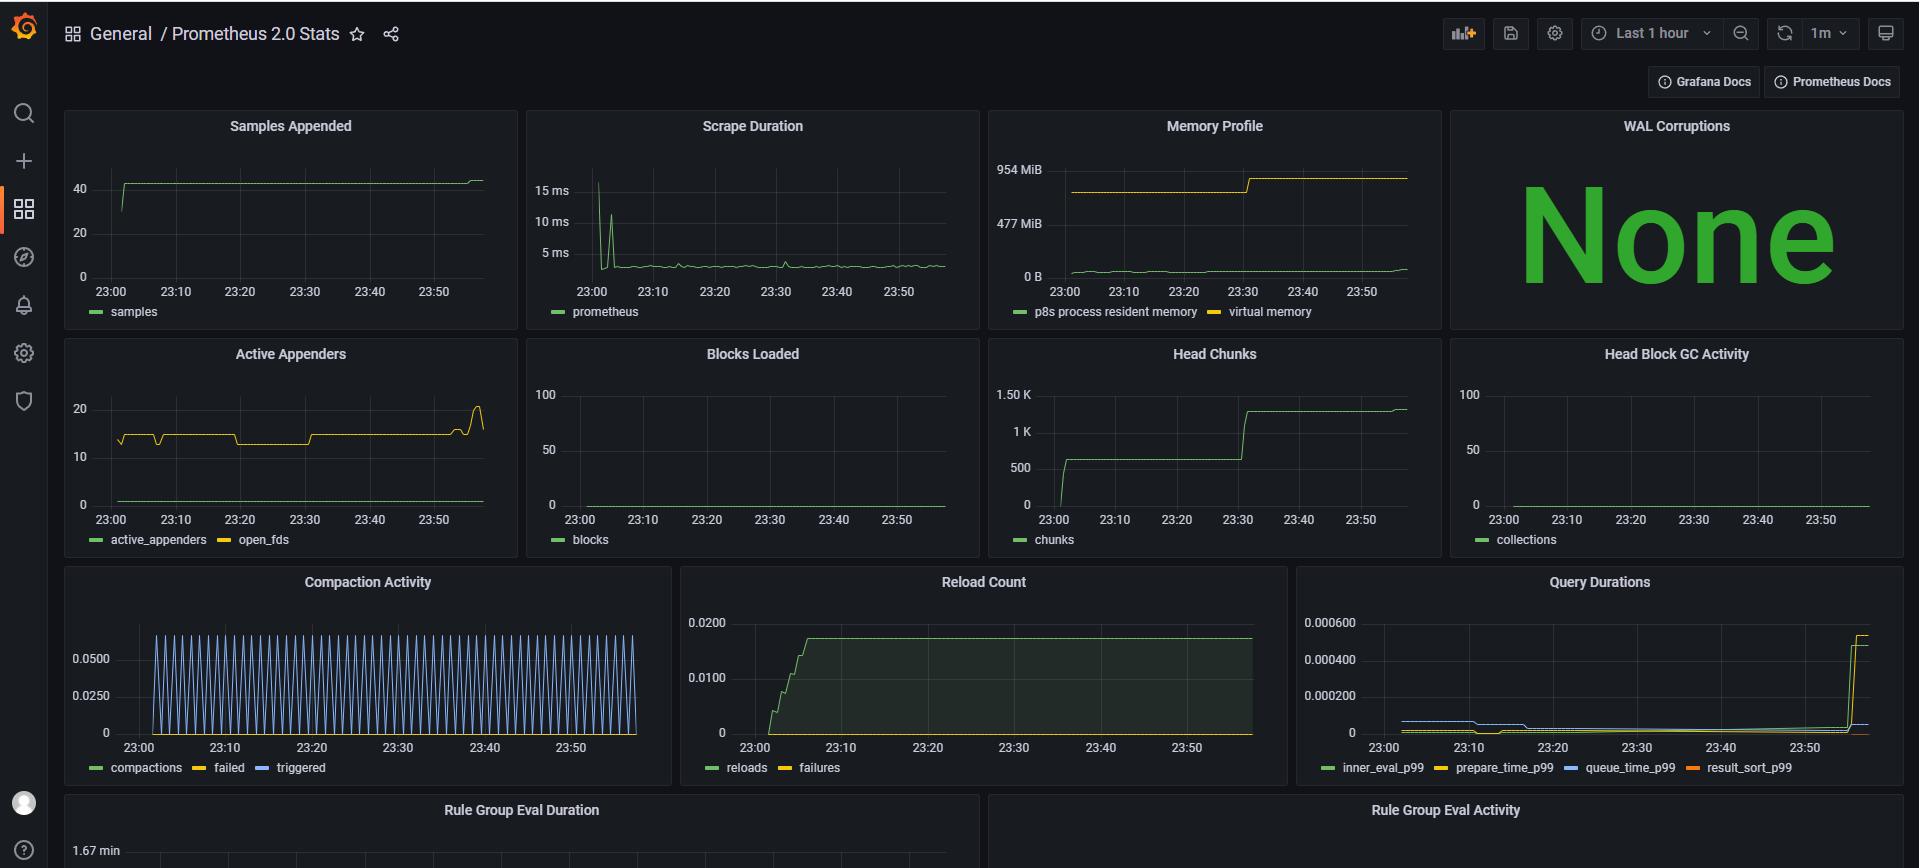
4、返回Dashboard可以查看到漂亮的图表了 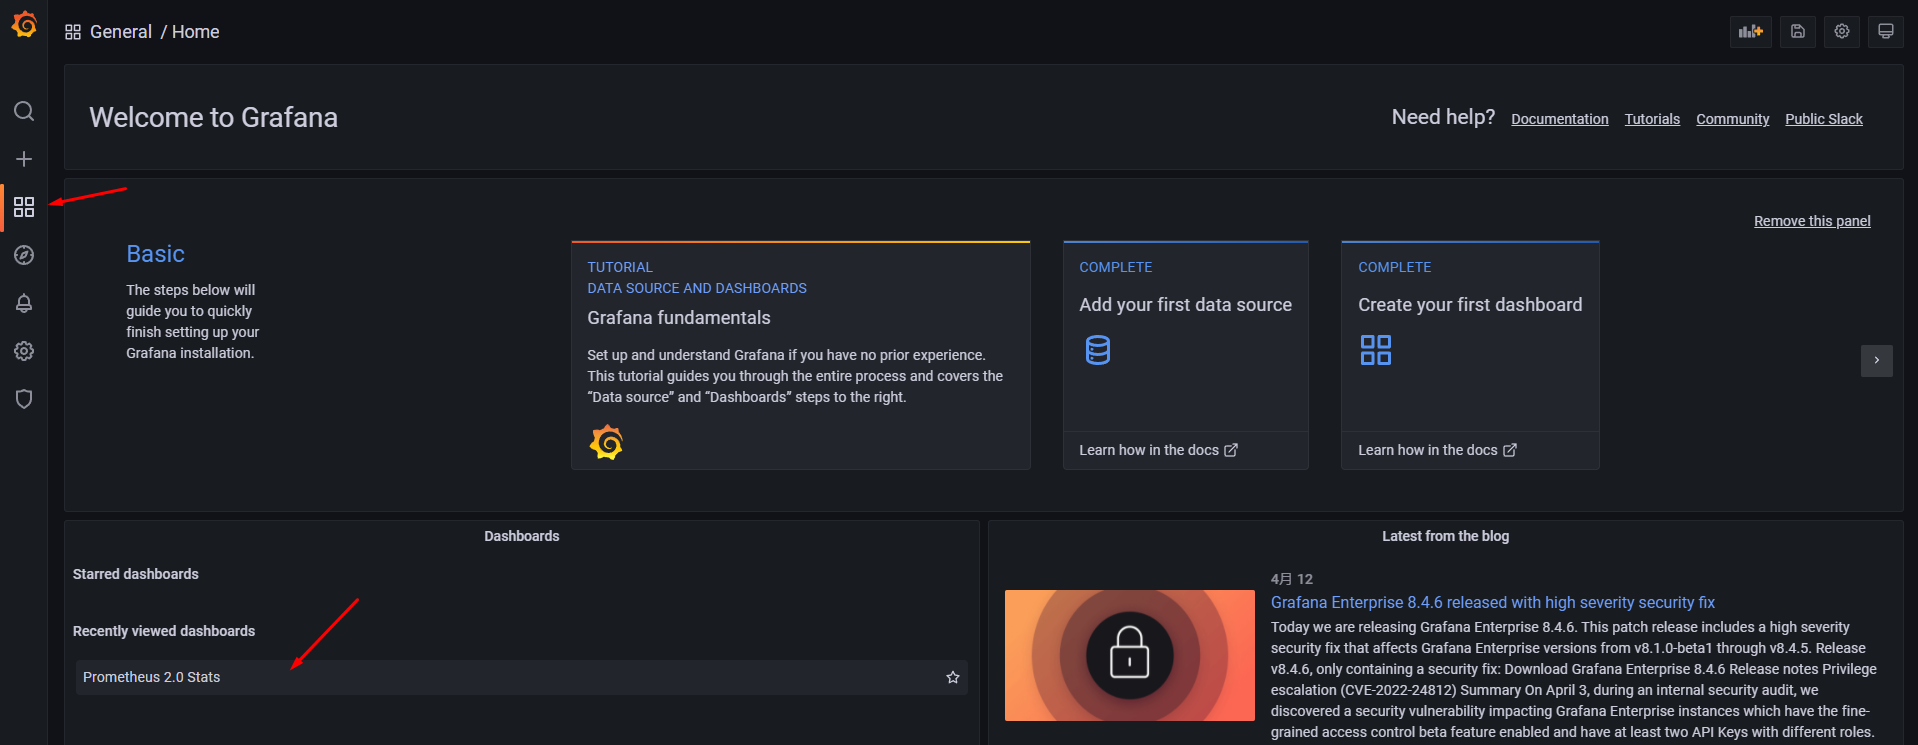

若有收获,就点个赞吧
0 人点赞
