maven
<!--监控--><dependency><groupId>org.springframework.boot</groupId><artifactId>spring-boot-starter-actuator</artifactId></dependency><!--适配prometheus--><dependency><groupId>io.micrometer</groupId><artifactId>micrometer-registry-prometheus</artifactId></dependency><!-- https://mvnrepository.com/artifact/io.github.mweirauch/micrometer-jvm-extras --><dependency><groupId>io.github.mweirauch</groupId><artifactId>micrometer-jvm-extras</artifactId><version>0.2.2</version></dependency>
yaml
spring:application:name: zlintent# 监控配置management:endpoint:health:show-details: alwaysmetrics:enabled: trueprometheus:enabled: trueendpoints:web:exposure:include: '*'metrics:export:prometheus:enabled: true#访问http://localhost:8080/actuator/infoinfo:author: zhanglmobile: iphone
配置prometheus.yml
# my global config
global:
  scrape_interval: 15s # Set the scrape interval to every 15 seconds. Default is every 1 minute.
  evaluation_interval: 15s # Evaluate rules every 15 seconds. The default is every 1 minute.
  # scrape_timeout is set to the global default (10s).

# Alertmanager configuration
alerting:
  alertmanagers:
    - static_configs:
        - targets:
          # - alertmanager:9093

# Load rules once and periodically evaluate them according to the global 'evaluation_interval'.
rule_files:
  # - "first_rules.yml"
  # - "second_rules.yml"

# A scrape configuration containing exactly one endpoint to scrape:
# Here it's Prometheus itself.
scrape_configs:
  # The job name is added as a label `job=<job_name>` to any timeseries scraped from this config.
  - job_name: "prometheus"

    # metrics_path defaults to '/metrics'
    # scheme defaults to 'http'.

    static_configs:
      - targets: ["localhost:9090"]

  - job_name: "springboot-prometheus"
    metrics_path: '/actuator/prometheus'
    static_configs:
      - targets: ["192.168.1.4:8080"]
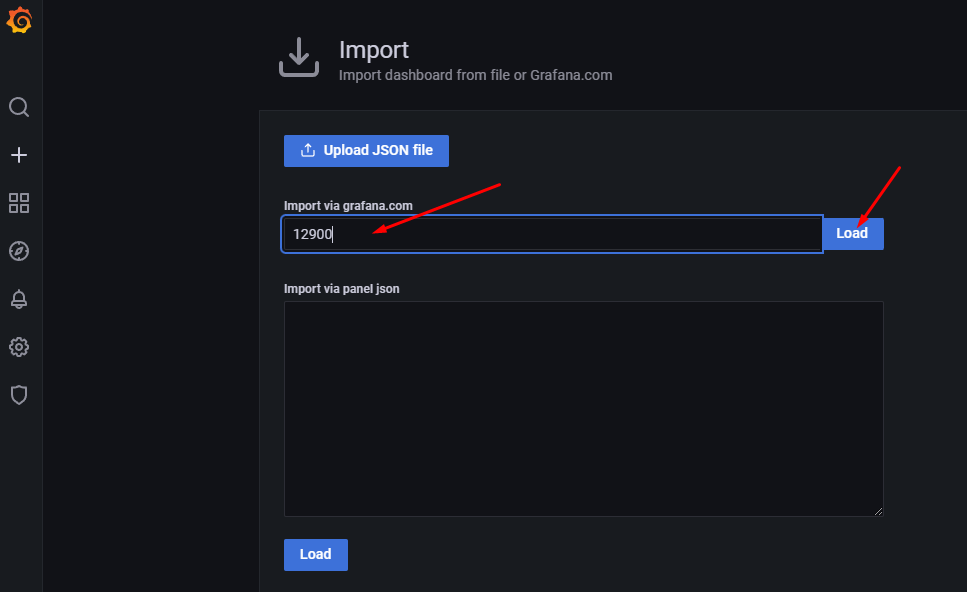
Grafana安装模板
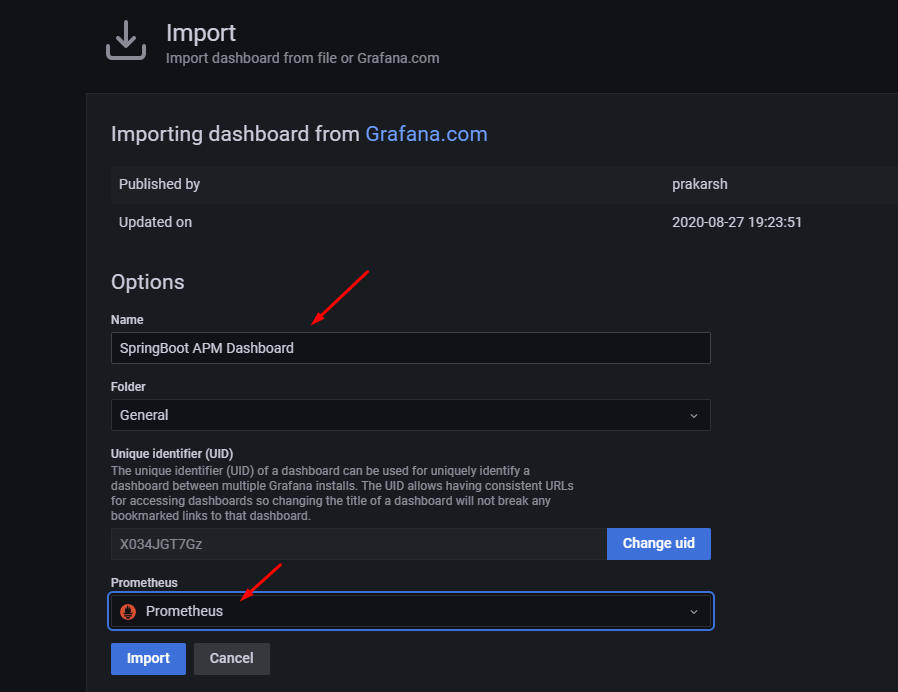
选用了4701模板的JVM监控和12900SpringBoot监控
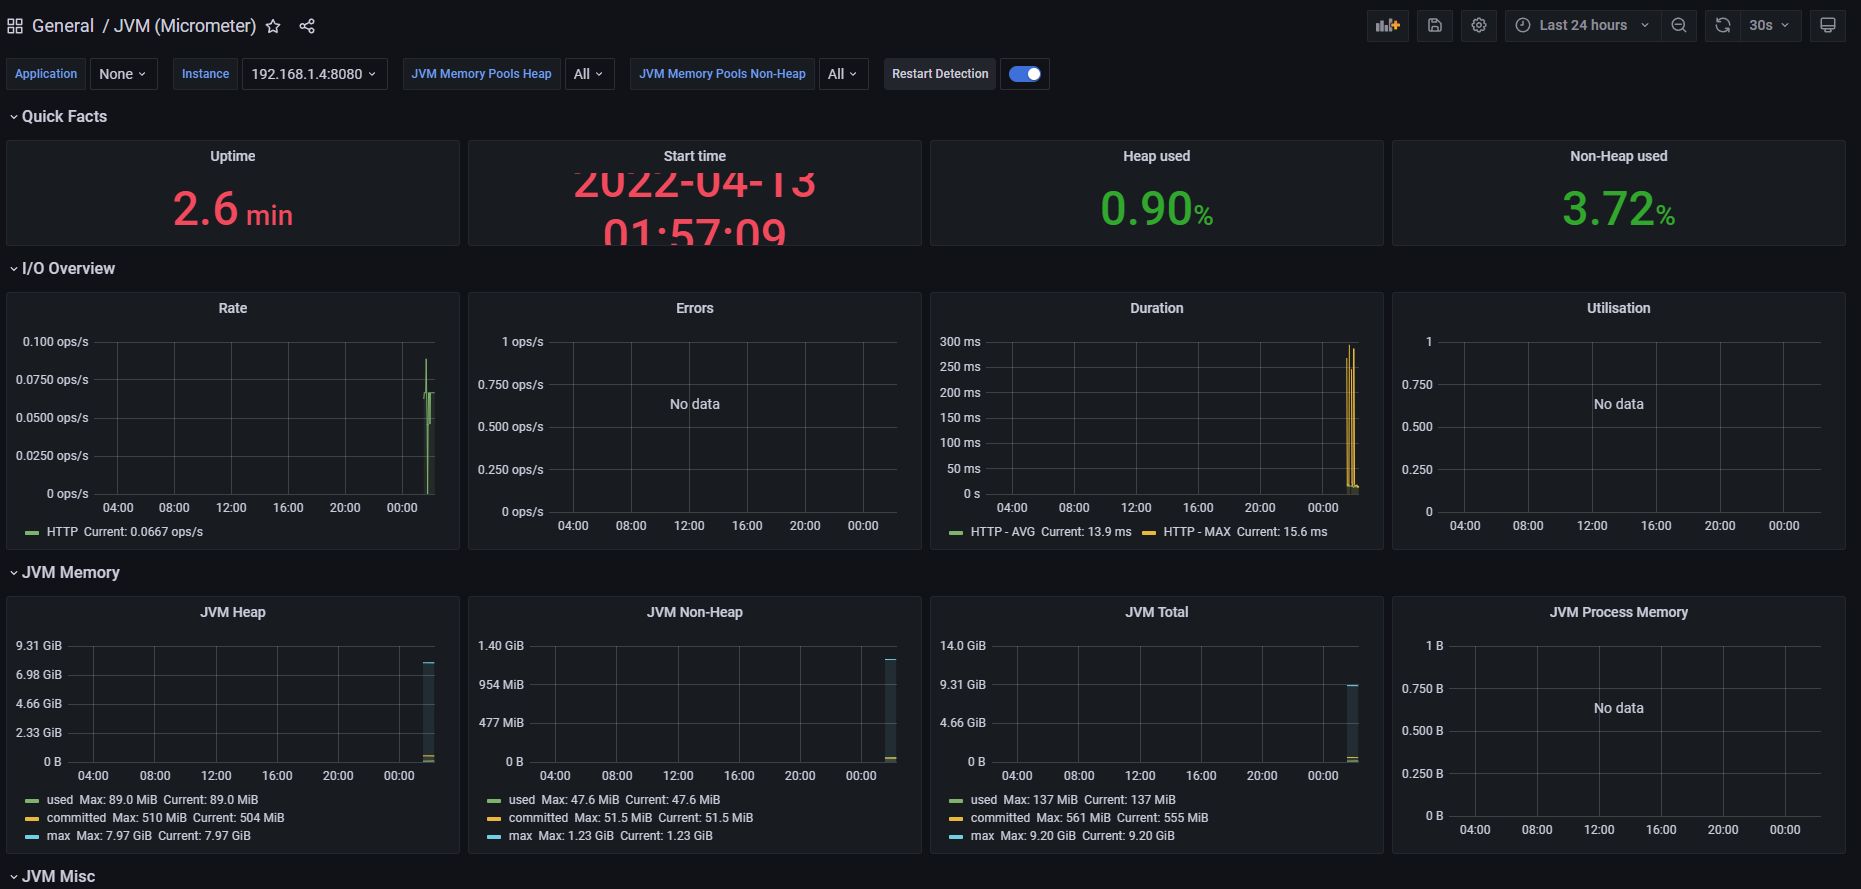
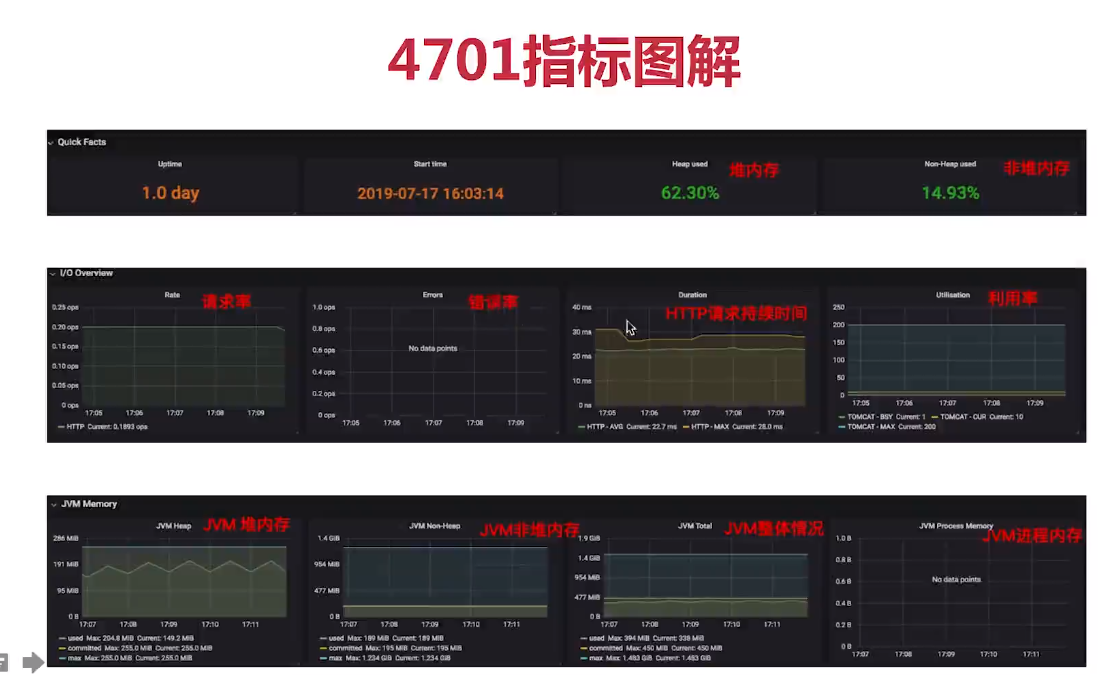
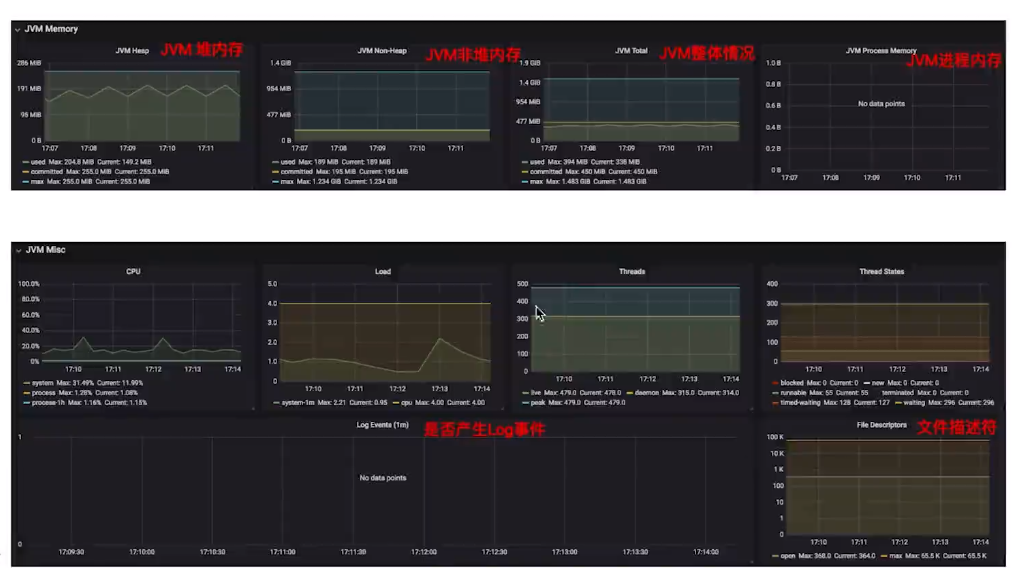
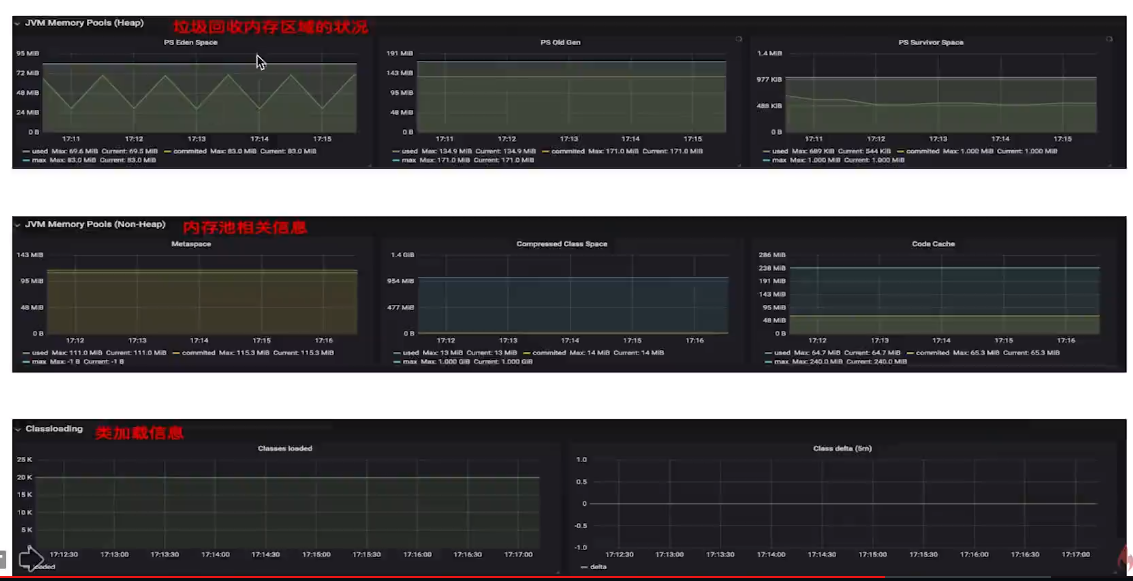
JVM信息(4701)
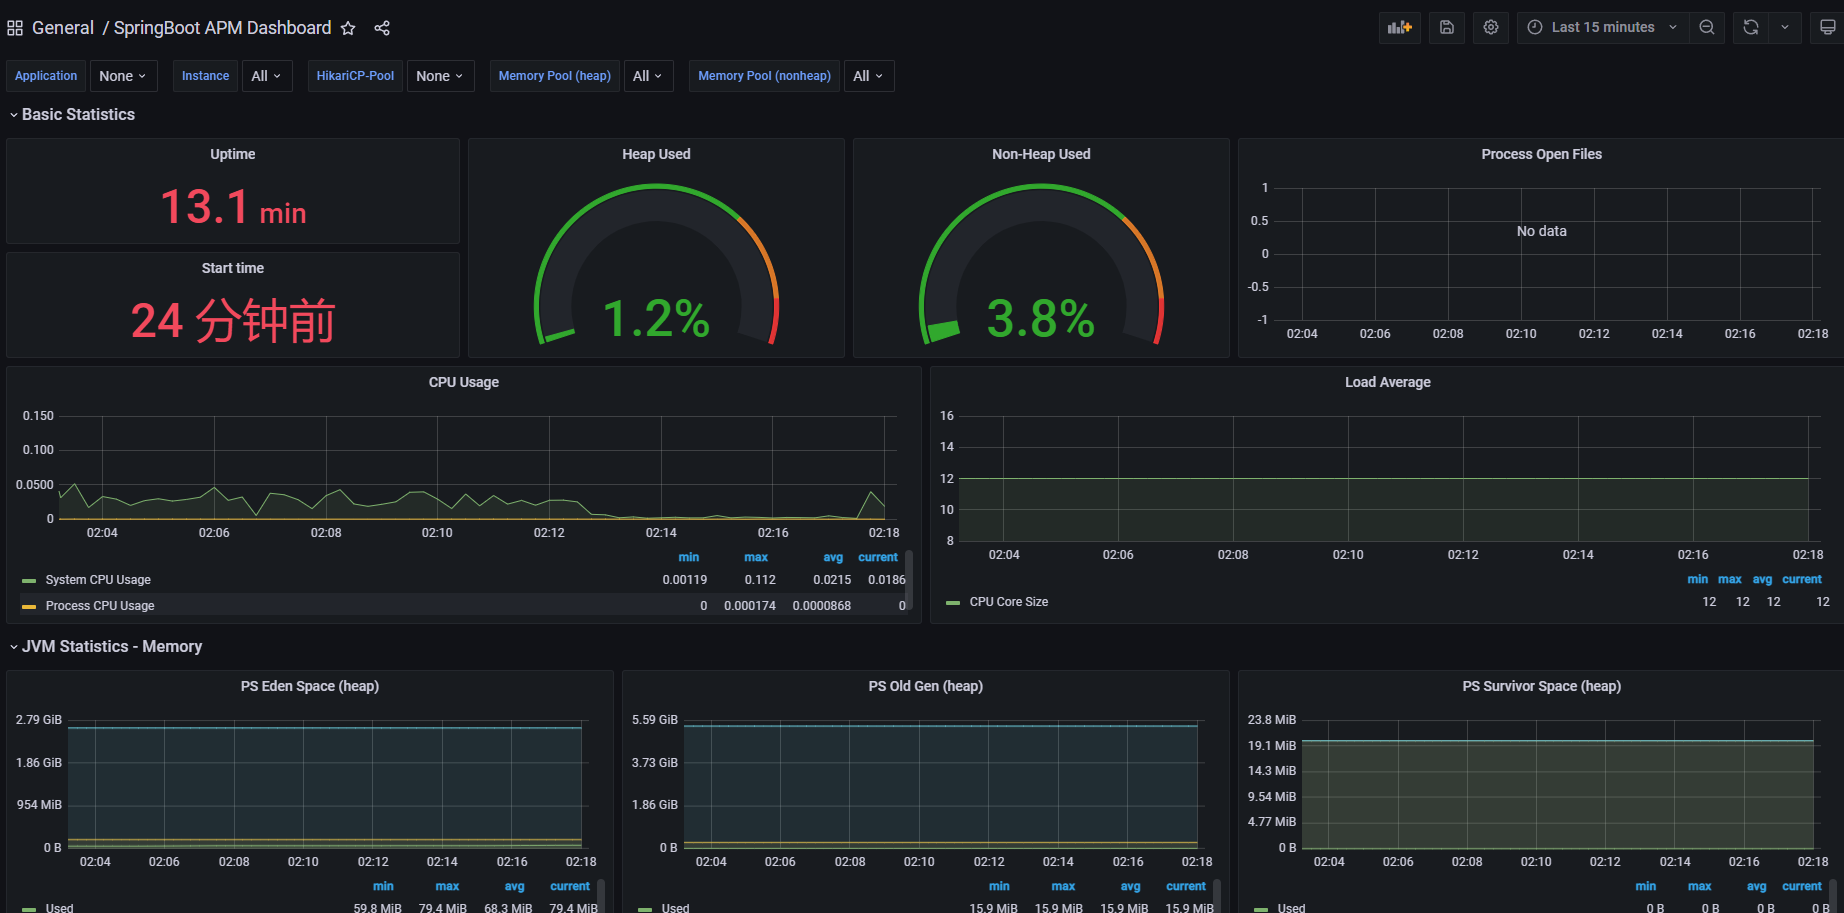
SpringBoot信息(12900)
服务器监控(8919)
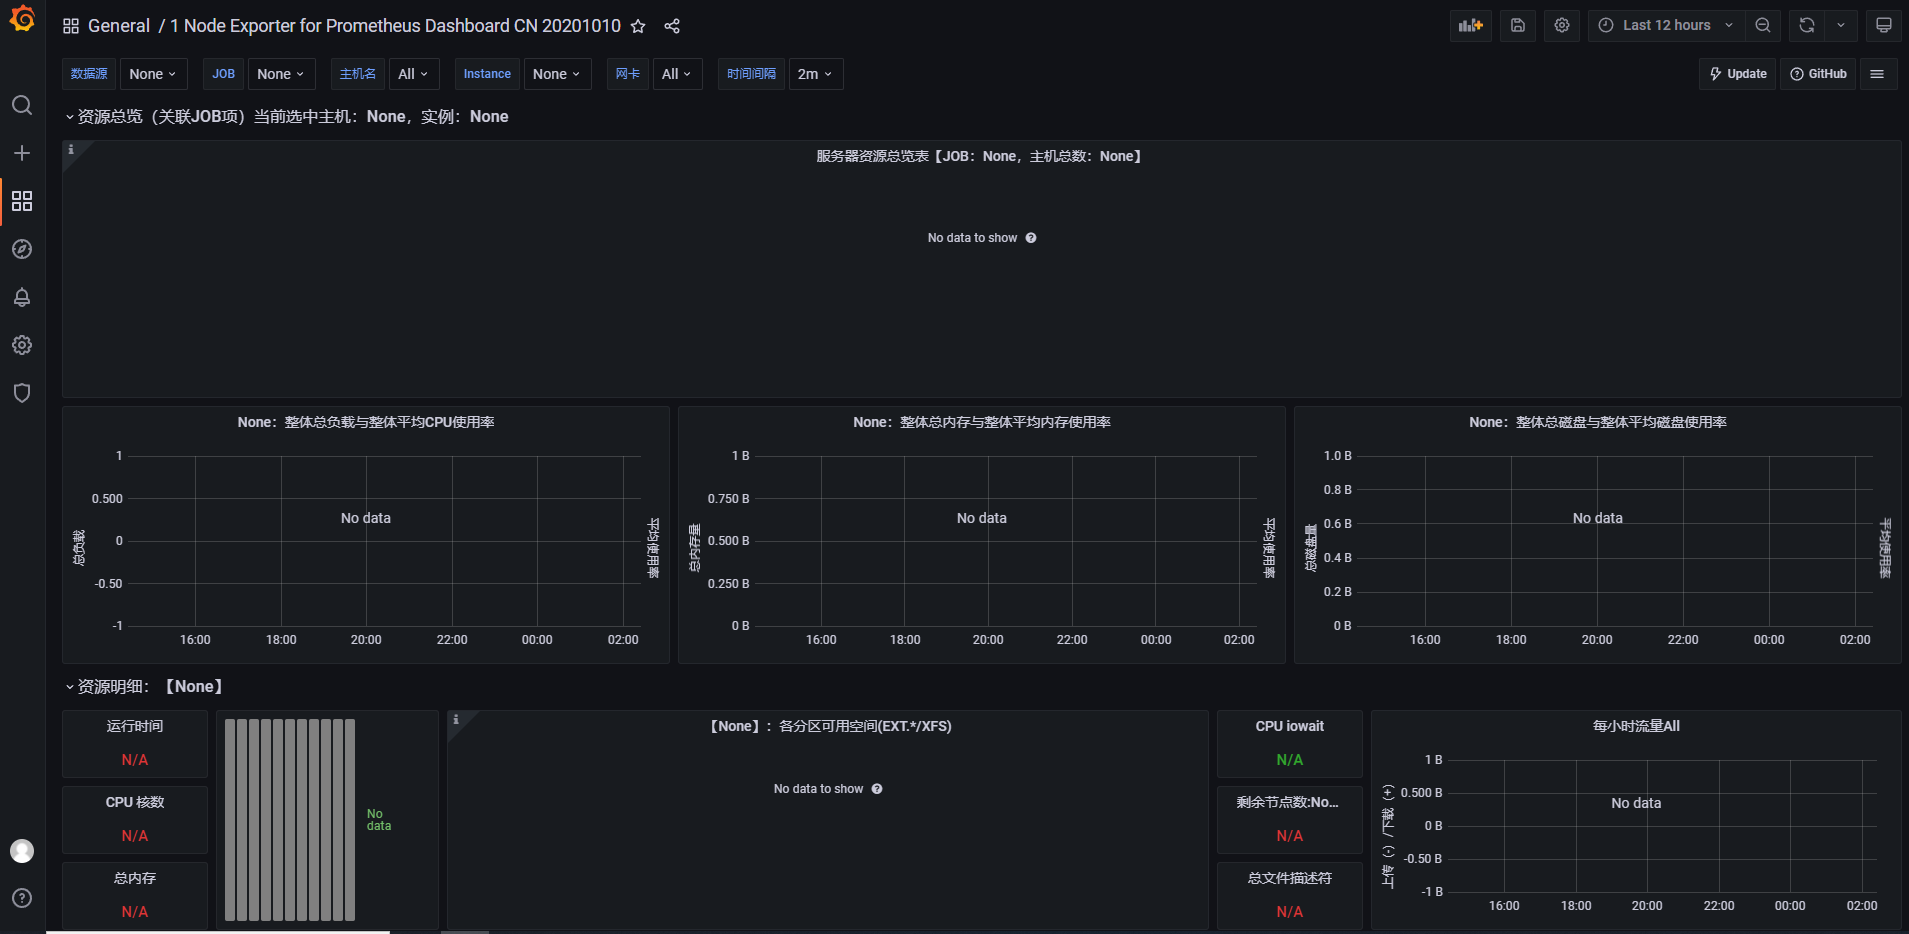
【中文版本】2020.10.10更新,增加整体资源展示!支持 Grafana6&7,Node Exporter v0.16及以上的版本,优化重要指标展示。包含整体资源展示与资源明细图表:CPU 内存 磁盘 IO 网络等监控指标。https://github.com/starsliao/Prometheus

若有收获,就点个赞吧
0 人点赞
