为什么要学习时间序列
在许多数据分析中都会遇见与时间有关的数据,他们可能是字符串…各种各样的格式,Pandas有良好的工具可以帮助我们处理这些数据,它的优势体现在处理时间和处理难度。
date_range方法
pd.date_range(start=None, end=None, periods=None, freq=’D’)
开始时间 结束时间 周期 频率
start和end以及freq配合能够生成start和end范围内以频率freq的一组时间索引(D是一天,可以写nD表示n天,M表示月)
但下面这种用的更多
start和periods(周期=n,每隔n个取一个)以及freq配合能够生成从start开始的频率为freq的periods个时间索引
start可以写的格式很多 20190101,2019-01-01,2019/01/01,2019.01.01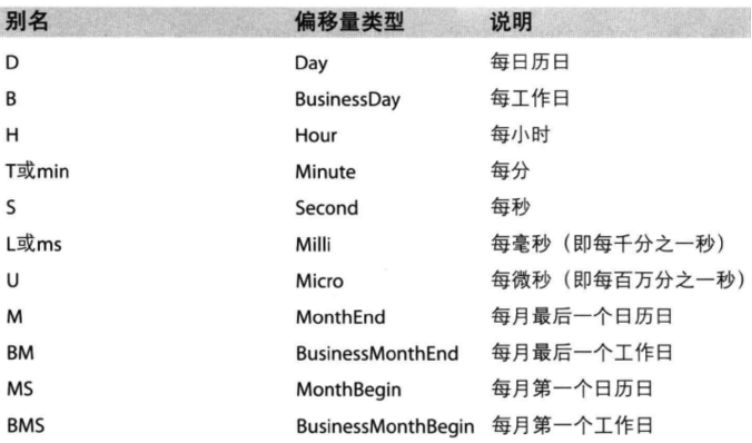
import pandas as pdimport numpy as npdate_list = pd.date_range(start='20190101',end='20190202',freq='D')print(date_list)------------output------------DatetimeIndex(['2019-01-01', '2019-01-02', '2019-01-03', '2019-01-04','2019-01-05', '2019-01-06', '2019-01-07', '2019-01-08','2019-01-09', '2019-01-10', '2019-01-11', '2019-01-12','2019-01-13', '2019-01-14', '2019-01-15', '2019-01-16','2019-01-17', '2019-01-18', '2019-01-19', '2019-01-20','2019-01-21', '2019-01-22', '2019-01-23', '2019-01-24','2019-01-25', '2019-01-26', '2019-01-27', '2019-01-28','2019-01-29', '2019-01-30', '2019-01-31', '2019-02-01','2019-02-02'],dtype='datetime64[ns]', freq='D')
案例
美国蒙哥马利 2015到2017年25万条911的紧急电话的数据
montcoalert.zip
数据来自:https://www.kaggle.com/mchirico/montcoalert/data
预览
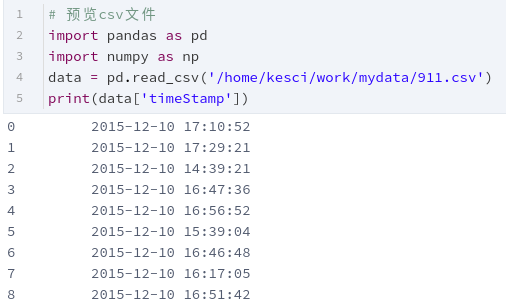
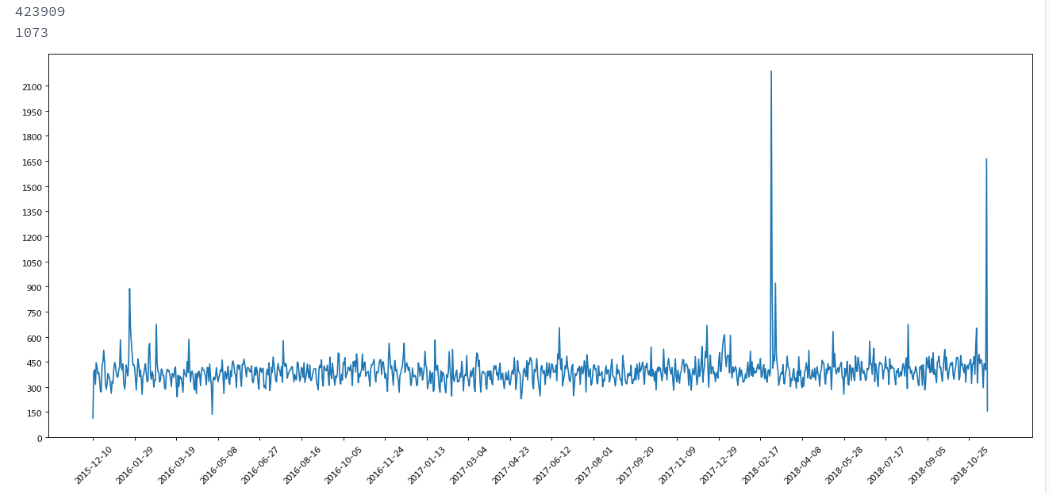
如果不用这些知识,想要获得每天报警人数
import numpy as npimport pandas as pdimport matplotlib.pyplot as pltall_datas = pd.read_csv('/home/kesci/work/mydata/911.csv')all_datas["timeStamp"] = all_datas["timeStamp"].str.split(' ').tolist()print(all_datas["timeStamp"].shape[0])a = np.ones((all_datas["timeStamp"].shape[0],)).astype('int')one_data = pd.Series(a).to_frame()one_data.columns = ['count']time_data = all_datas["timeStamp"]last_data = one_data.join(time_data)last_data["timeStamp"] = last_data.timeStamp.apply(lambda x: x[0] if True else np.nan)# print(last_data.groupby(by='timeStamp').count())draw_data = last_data.groupby(by='timeStamp').count()_x = range(draw_data["count"].shape[0])_y = list(draw_data.values)print(draw_data.shape[0])plt.figure(figsize=(20,8),dpi=80)plt.plot(_x, _y) # 绘制点plt.xticks(range(0,draw_data.shape[0],50),list(draw_data.index.tolist())[::50],rotation=45) # 设置x坐标轴plt.yticks(range(0, int(max(_y))+1,150)) # 设置y坐标轴plt.show()
将时间作为索引
>>> time = pd.date_range(start='20190101',periods=10,freq='D')>>> df = pd.DataFrame(np.random.rand(10),index=time)>>> df02019-01-01 0.9272322019-01-02 0.8882312019-01-03 0.6115342019-01-04 0.8894522019-01-05 0.8497992019-01-06 0.3178022019-01-07 0.1891402019-01-08 0.9108312019-01-09 0.6215552019-01-10 0.616275
转化为时间序列
回到最开始的911数据的案例中,我们可以使用pandas提供的方法把时间字符串转化为时间序列
df[“timeStamp”] = pd.to_datetime(df[“timeStamp”],format=””)
format参数大部分情况下可以不用写,但是对于pandas无法格式化的时间字符串,我们可以使用该参数,比如包含中文
格式传参
http://www.runoob.com/python3/python3-date-time.html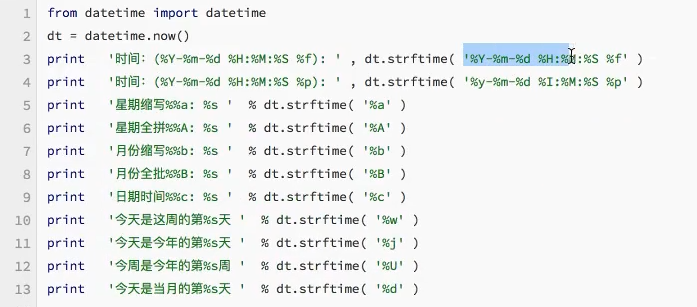
重采样
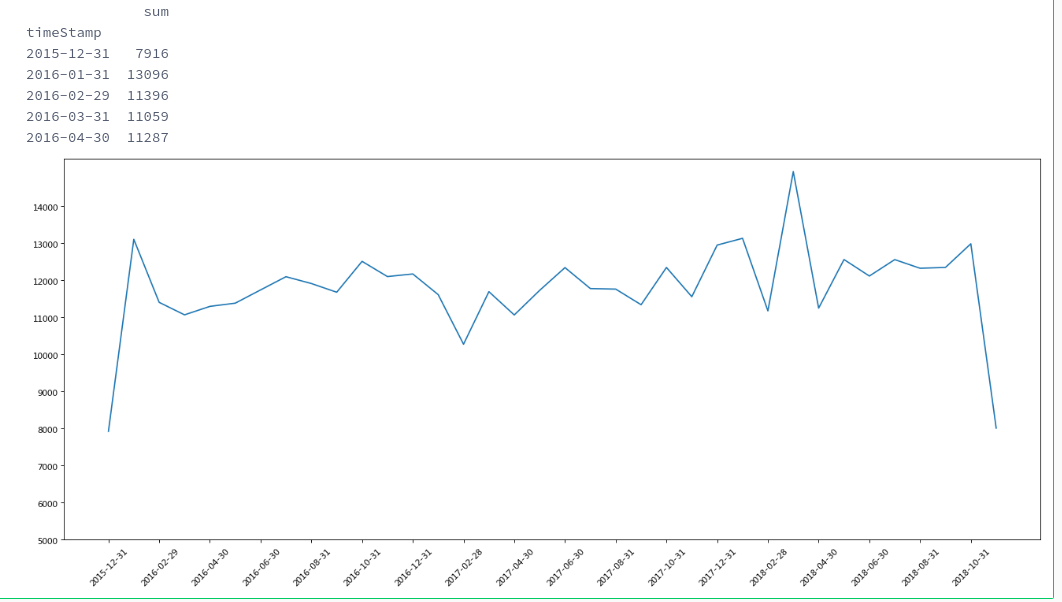
如果我们想要看到以天为单位的数据,那么我们就要进行重采样
重采样:指的是将时间序列从一个频率转化为另一个频率进行处理的过程,将高频率数据转化为低频率数据为降采样,低频率转化为高频率为升采样。
pandas提供了一个resample的方法来帮助我们实现频率转化
.resample
还是刚刚的数据
import numpy as npimport pandas as pdimport matplotlib.pyplot as pltall_datas = pd.read_csv('/home/kesci/input/study_data3465/911.csv')a = np.ones((all_datas["timeStamp"].shape[0],)).astype('int')just_one = pd.Series(a).to_frame()using_data = pd.to_datetime(all_datas["timeStamp"])using_data = using_data.to_frame().join(just_one)using_data.set_index("timeStamp",inplace=True)using_data = using_data.resample('M').count()using_data.columns = ['sum']print(using_data.head(5))_x = range(using_data.shape[0])_y = list(using_data['sum'])plt.figure(figsize=(20,8),dpi=80)plt.plot(_x, _y) # 绘制点plt.xticks(range(0,using_data.shape[0],2),list(map(lambda x:str(x)[:10],using_data.index))[::2],rotation=45) # 设置x坐标轴plt.yticks(range(5000, int(max(_y))+1,1000)) # 设置y坐标轴plt.show()
官网的栗子
>>> d = dict({'price': [10, 11, 9, 13, 14, 18, 17, 19],... 'volume': [50, 60, 40, 100, 50, 100, 40, 50]})>>> df = pd.DataFrame(d)>>> df['week_starting'] = pd.date_range('01/01/2018',... periods=8,... freq='W')>>> dfprice volume week_starting0 10 50 2018-01-071 11 60 2018-01-142 9 40 2018-01-213 13 100 2018-01-284 14 50 2018-02-045 18 100 2018-02-116 17 40 2018-02-187 19 50 2018-02-25>>> df.resample('M', on='week_starting').mean()price volumeweek_starting2018-01-31 10.75 62.52018-02-28 17.00 60.0
For a DataFrame with MultiIndex, the keyword level can be used to specify on which level the resampling needs to take place.
>>> days = pd.date_range('1/1/2000', periods=4, freq='D')>>> d2 = dict({'price': [10, 11, 9, 13, 14, 18, 17, 19],... 'volume': [50, 60, 40, 100, 50, 100, 40, 50]})>>> df2 = pd.DataFrame(d2,... index=pd.MultiIndex.from_product([days,... ['morning',... 'afternoon']]... ))>>> df2price volume2000-01-01 morning 10 50afternoon 11 602000-01-02 morning 9 40afternoon 13 1002000-01-03 morning 14 50afternoon 18 1002000-01-04 morning 17 40afternoon 19 50>>> df2.resample('D', level=0).sum()price volume2000-01-01 21 1102000-01-02 22 1402000-01-03 32 1502000-01-04 36 90
增加与时间有关的特征
DatetimeIndex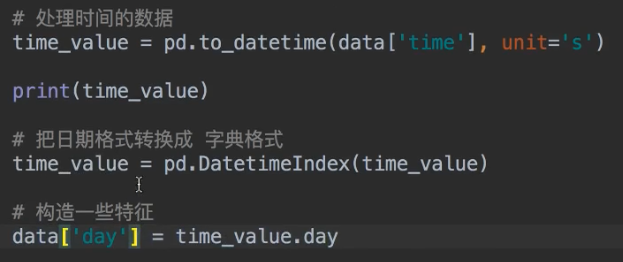
这里面的都可以取

