问题
如果有一组数据,如何确定他们来自哪个统计分布?
从数据分析的角度,并不想要通过严格的统计方法去找到这个分布,其实 Python 中有一个可以自动拟合数据分布的库 —— distfit 。这是一个python包,用于通过残差平方和(RSS)和拟合优度检验(GOF)对89个单变量分布进行概率密度拟合,并返回最佳分布。
distfit 简单又好用
# 安装pip install distfit
常见用法:.fit_transform():在经验数据 X 上拟合分布.summary:获得拟合数据并测试拟合优度的所有分布的分数。.predict():预测响应变量的概率.model:输出分布的最佳参数.plot():绘制最佳的拟合分布
示例
from distfit import distfitimport numpy as npX = np.random.normal(0, 2, [100,10])y = [-8,-6,0,1,2,3,4,5,6]dist = distfit(todf=True)dist.fit_transform(X)dist.plot()
输出用于拟合过程的函数列表,它使用最流行的 10 个发行版的列表进行扫描。
[distfit] >[norm ] [0.00 sec] [RSS: 0.0120713] [loc=-0.047 scale=1.984][distfit] >[expon ] [0.0 sec] [RSS: 0.4092169] [loc=-7.320 scale=7.273][distfit] >[pareto ] [0.06 sec] [RSS: 0.4098607] [loc=-98251992.546 scale=98251985.226][distfit] >[dweibull ] [0.01 sec] [RSS: 0.0229391] [loc=-0.046 scale=1.721][distfit] >[t ] [0.04 sec] [RSS: 0.0120717] [loc=-0.047 scale=1.984][distfit] >[genextreme] [0.05 sec] [RSS: 0.0107445] [loc=-0.755 scale=1.981][distfit] >[gamma ] [0.04 sec] [RSS: 0.0118907] [loc=-191.812 scale=0.021][distfit] >[lognorm ] [0.09 sec] [RSS: 0.0117103] [loc=-107.148 scale=107.084][distfit] >[beta ] [0.03 sec] [RSS: 0.0116300] [loc=-14.479 scale=28.973][distfit] >[uniform ] [0.0 sec] [RSS: 0.2545746] [loc=-7.320 scale=12.835][distfit] >[loggamma ] [0.04 sec] [RSS: 0.0123738] [loc=-360.941 scale=54.518]
当然,distfit 支持的分布还有很多: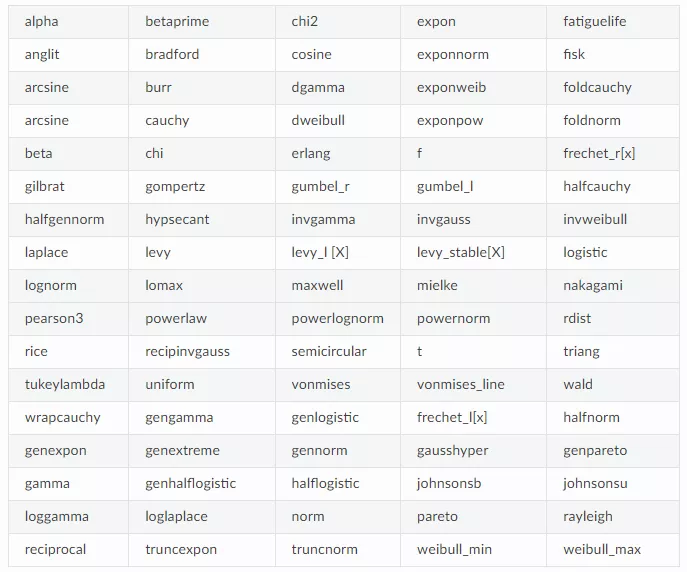
最后绘制最佳的拟合分布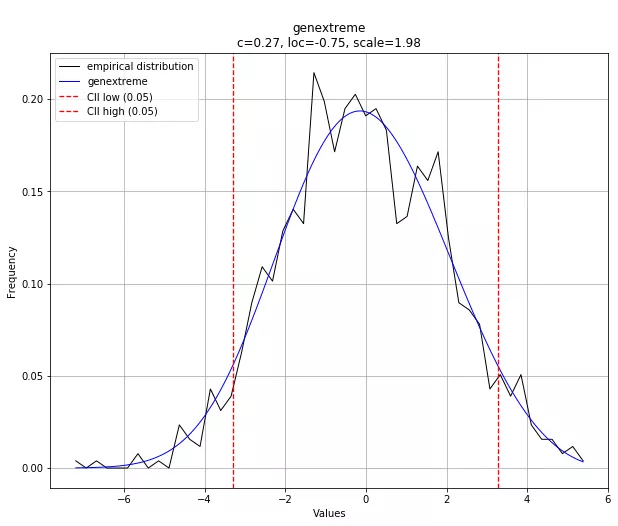
dist.summary 输出各分布的参数。
distr score ... scale arg0 genextreme 0.0107445 ... 1.9814 (0.27387377680364405,)1 beta 0.01163 ... 28.9726 (26.055079164665887, 26.248878389403494)2 lognorm 0.0117103 ... 107.084 (0.01848064379707136,)3 gamma 0.0118907 ... 0.0205321 (9339.777394183824,)4 norm 0.0120713 ... 1.98429 ()5 t 0.0120717 ... 1.98428 (1863131.339823592,)6 loggamma 0.0123738 ... 54.5178 (750.2645425001494,)7 dweibull 0.0229391 ... 1.72129 (1.2898970802235787,)8 uniform 0.254575 ... 12.8346 ()9 expon 0.409217 ... 7.27316 ()10 pareto 0.409861 ... 9.8252e+07 (13542571.060345018,)

若有收获,就点个赞吧
0 人点赞
