高维数据可视化—Hypertools
简 介
平时可以通过seaborn,matplotlib,plotly等工具包进行二维,三维数据等可视化,但是高维度数据的可视化一直是一大难点,如果能对高维数据进行可视化,可以更容易识别不同数据列之间的隐藏模式、关联性等。今天和大家分享一个有趣的高维数据可视化工具—Hypertools。
Hypertools是建立在matplotlib、sklearn 和 seaborn 之上的,Hypertools通过降低数据维度来对高维数据集进行可视化。
HyperTools的功能主要包括:
- 在2/3D 中绘制高维数据集的;
- 可以绘制静态图和动画图;
- 自定义绘图样式的简单API;
- 一组强大的数据操作工具,包括超对齐、k均值聚类、归一化等;
- 支持Numpy数组、Pandas DataFrame、文本或(混合)列表;
-
示例代码
代码摘自:https://towardsdatascience.com/visualizing-high-dimensional-data-f59eab85f08b
1、Basic Plot
```python
pip install hypertools
import hypertools as hyp %matplotlib inline
data loading
basic = hyp.load(‘weights_sample’) basic basic.plot(fmt=’.’)
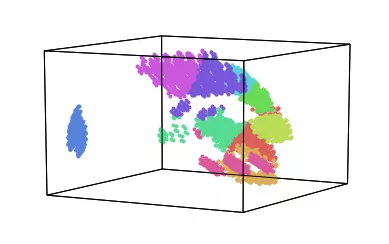
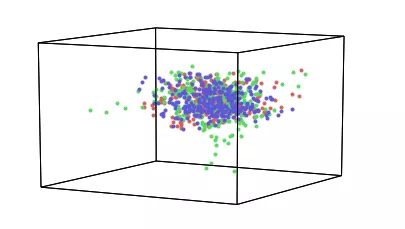<a name="xsoEA"></a>### 2、Cluster Plot```pythonclust = hyp.load('mushrooms')# Creating plotclust.plot(n_clusters=10)
3、Corpus Plots
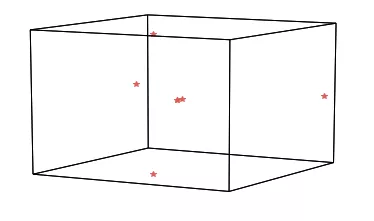
text = ['i am from India', 'India is in asia', 'Asia is the largest continent','There are 7 continents', 'Continents means earth surfaces ', 'Surfaces covers land area','land area is largest in asia']hyp.plot(text, '*', corpus=text)
4、UMAP
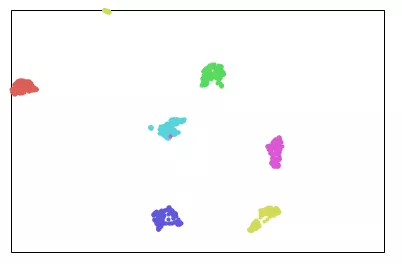
from sklearn import datasetsdata = datasets.load_digits(n_class=6)df = data.datahue = data.target.astype('str')hyp.plot(df, '.', reduce='UMAP', hue=hue, ndims=2)
5、Animated Plots
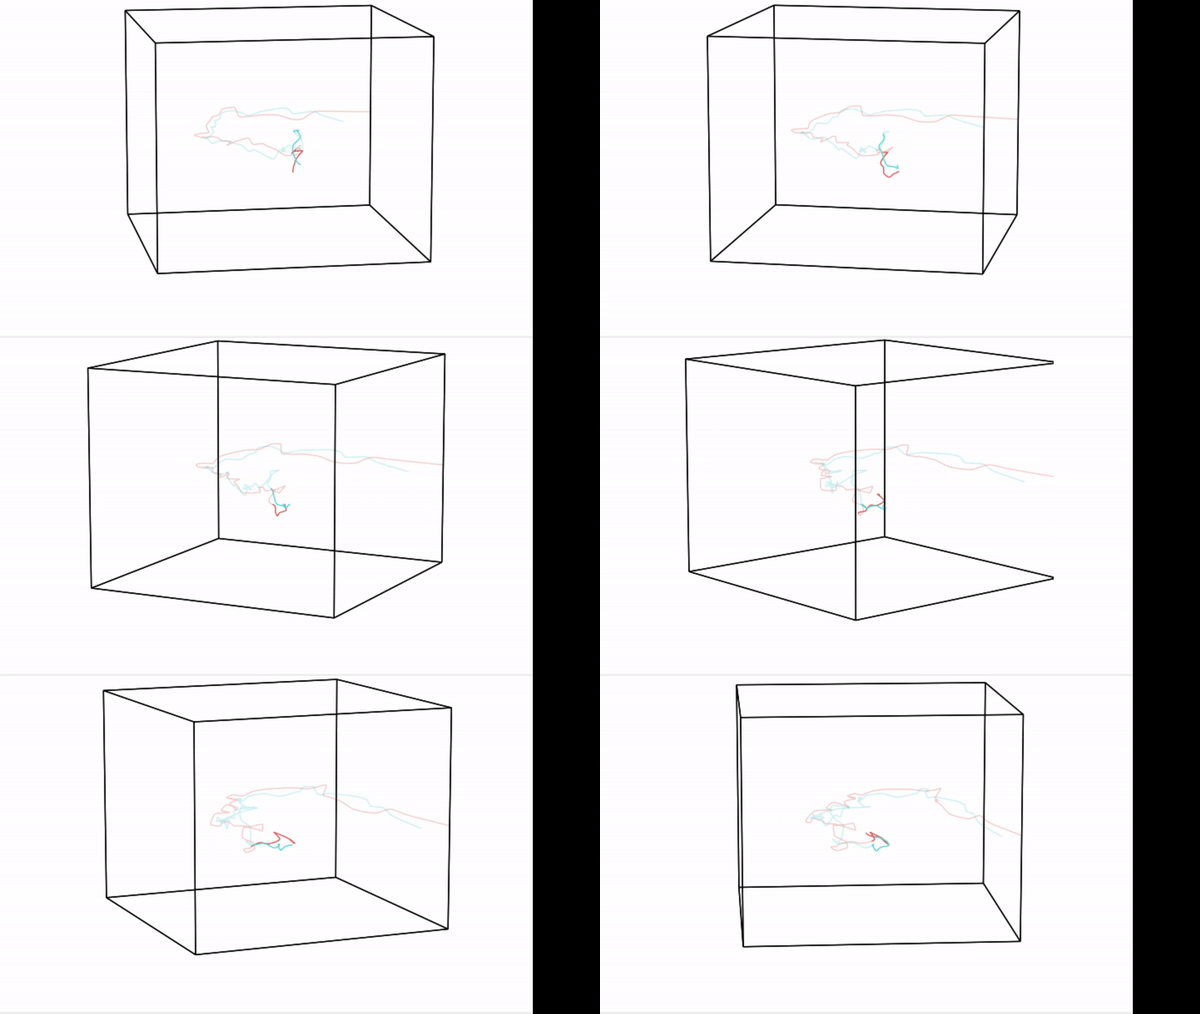
ani = hyp.load('weights_avg')ani.plot(animate=True, chemtrails=True)
