R-gghalves包将图表“合”起来
要想使多个图合理放置,做到既不能互相遮挡又不能更改大小、位置等属性,确实较为麻烦。而R-gghalves包则可以很好的解决这个问题,gghalves包可轻松绘制半面图,如将箱线图分半,这样就可以实现在箱线图旁绘制其他的图表类型。官网为:https://erocoar.github.io/gghalves/。接下来,简单介绍下R-gghalves的主要绘图函数:
geom_half_boxplot():绘制半箱线图geom_half_violin():绘制半小提琴图geom_half_point():绘制半点图
由于以上绘图函数和ggplot2中对应的geom_boxplot()、geom_violin()、geom_point()参数类似,这里不再过多赘述。需要注意的是上述三个绘图函数中有一个特殊参数-side用于显示哪一半图形,l代表左,r代表右,默认值为l。
R-gghalves包实例演示
「geom_half_point()」
在使用geom_half_point()函数绘制之前,先使用geom_point()绘制,以便大家更好理解:
point <- ggplot(iris, aes(x = Species, y = Sepal.Width)) +geom_point(shape=21,size=3,fill="#A593E0",colour="black",stroke=.8) +labs(title = "Example of <span style='color:#D20F26'>gghalves::geom_half_point function</span>",subtitle = "processed charts with <span style='color:#1A73E8'>geom_point()</span>",caption = "Visualization by <span style='color:#DD6449'>DataCharm</span>") +hrbrthemes::theme_ipsum(base_family = "Roboto Condensed") +theme(plot.title = element_markdown(hjust = 0.5,vjust = .5,color = "black",size = 20, margin = margin(t = 1, b = 12)),plot.subtitle = element_markdown(hjust = 0,vjust = .5,size=15),plot.caption = element_markdown(face = 'bold',size = 12))
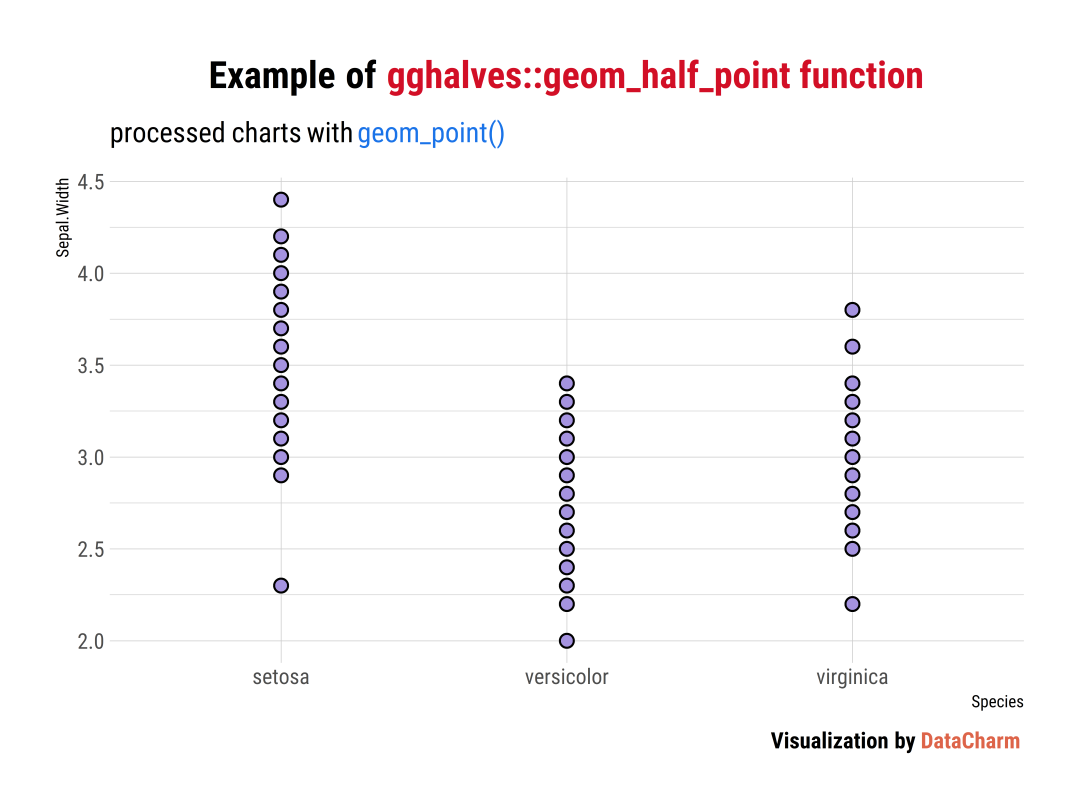
Example of geom_point()
接下来使用geom_half_point()绘制:
half_point <- ggplot(iris, aes(x = Species, y = Sepal.Width)) +geom_half_point(shape=21,size=3,fill="#A593E0",colour="black",stroke=.8,side = "l")
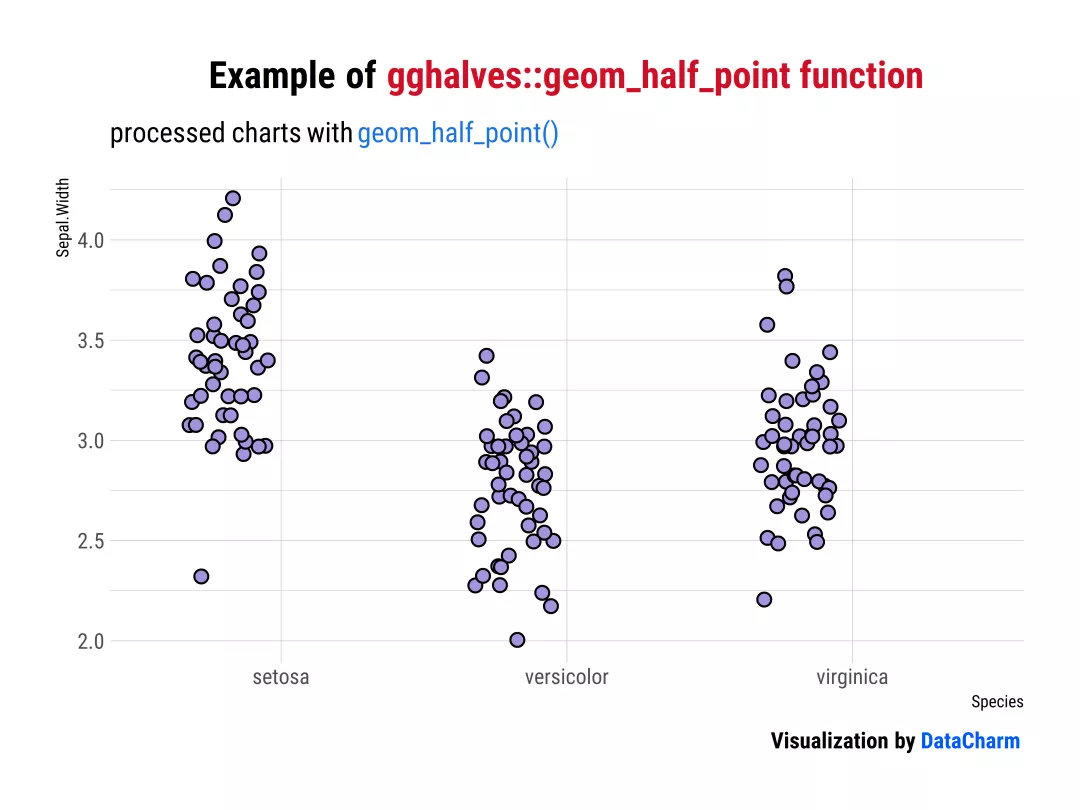
Example of geom_half_point
可以看出,geom_half_point()使点在水平或者垂直方向上进行抖动,而 side = "l" 的设置则使其左移。
此外,当对不同类别的数据点进行绘制时,则需要使用geom_half_point_panel(),这里和箱线图一同绘制:
ggplot(iris, aes(y = Sepal.Width)) +geom_boxplot(fill="#A593E0") +geom_half_point_panel(shape=21,size=2.5,colour="black",stroke=.8,aes(x = 0.5, fill = Species),transformation = ggbeeswarm:::position_quasirandom())
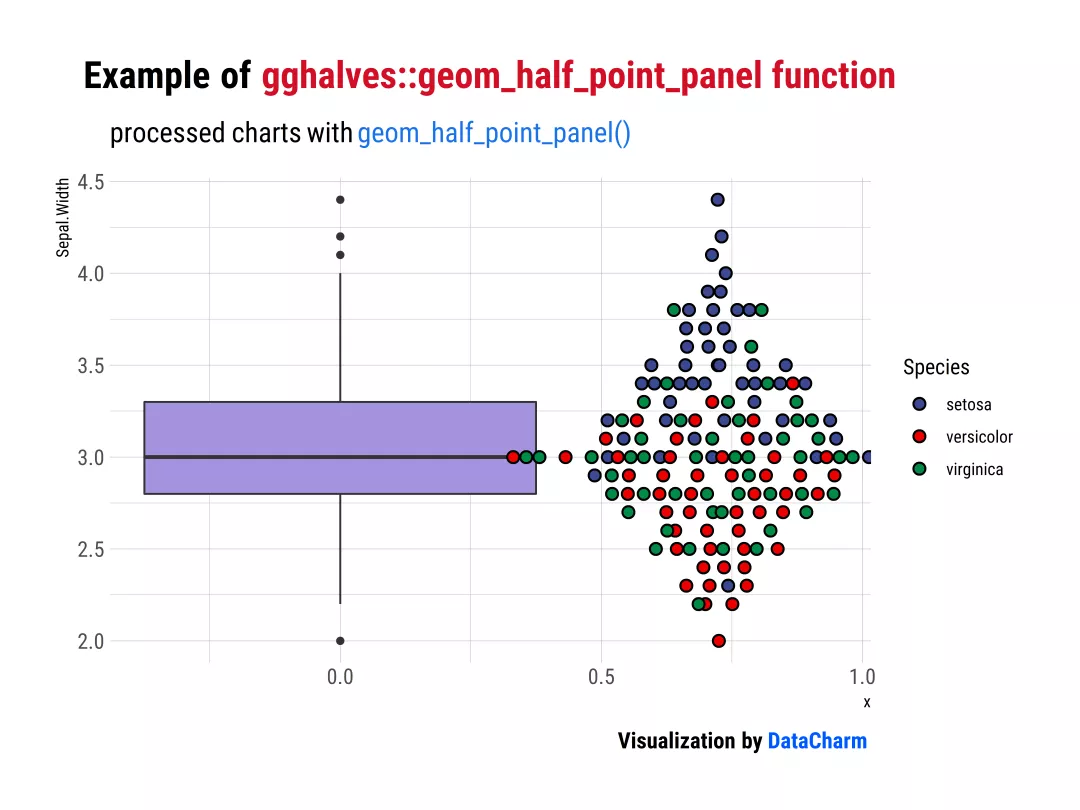
Example of geom_half_point_panel and geom_boxplot
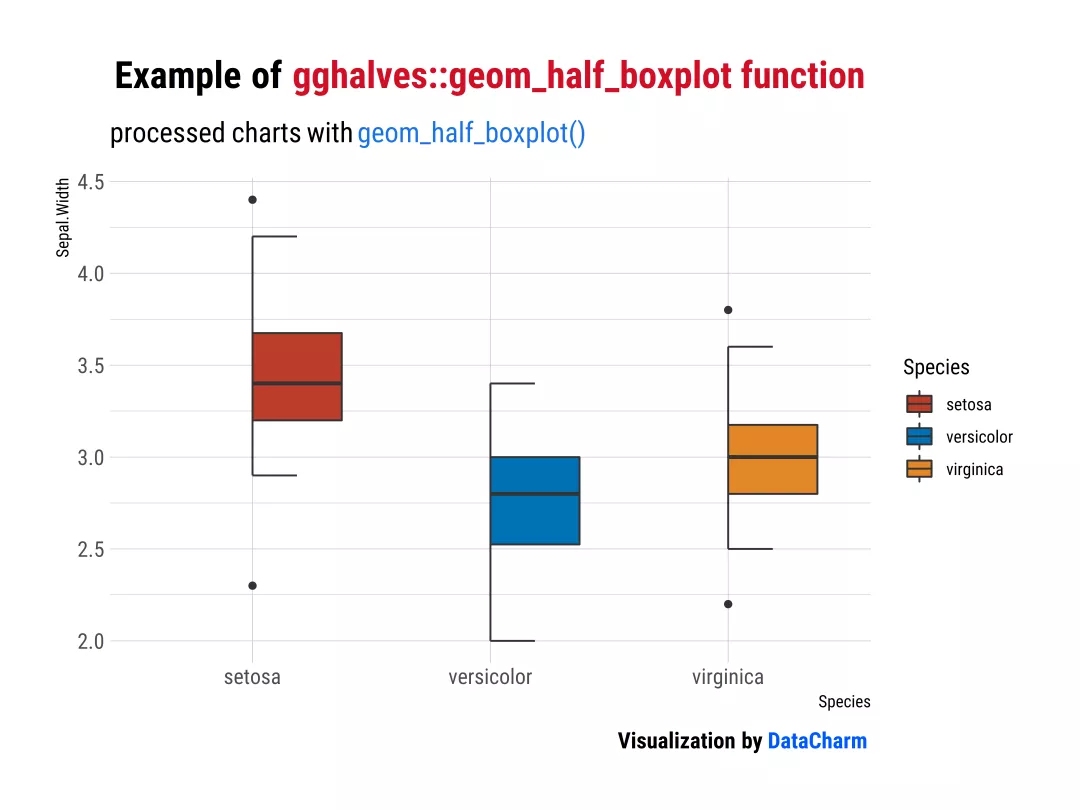
「geom_half_boxplot()」
还是一样,首先使用geom_boxplot()绘制:
gplot(iris, aes(x = Species, y = Sepal.Width,fill=Species)) +geom_boxplot() +ggsci::scale_fill_nejm()+labs(title = "Example of <span style='color:#D20F26'>gghalves::geom_half_boxplot function</span>",subtitle = "processed charts with <span style='color:#1A73E8'>geom_boxplot()</span>",caption = "Visualization by <span style='color:#0057FF'>DataCharm</span>") +hrbrthemes::theme_ipsum(base_family = "Roboto Condensed") +theme(plot.title = element_markdown(hjust = 0.5,vjust = .5,color = "black",size = 20, margin = margin(t = 1, b = 12)),plot.subtitle = element_markdown(hjust = 0,vjust = .5,size=15),plot.caption = element_markdown(face = 'bold',size = 12))
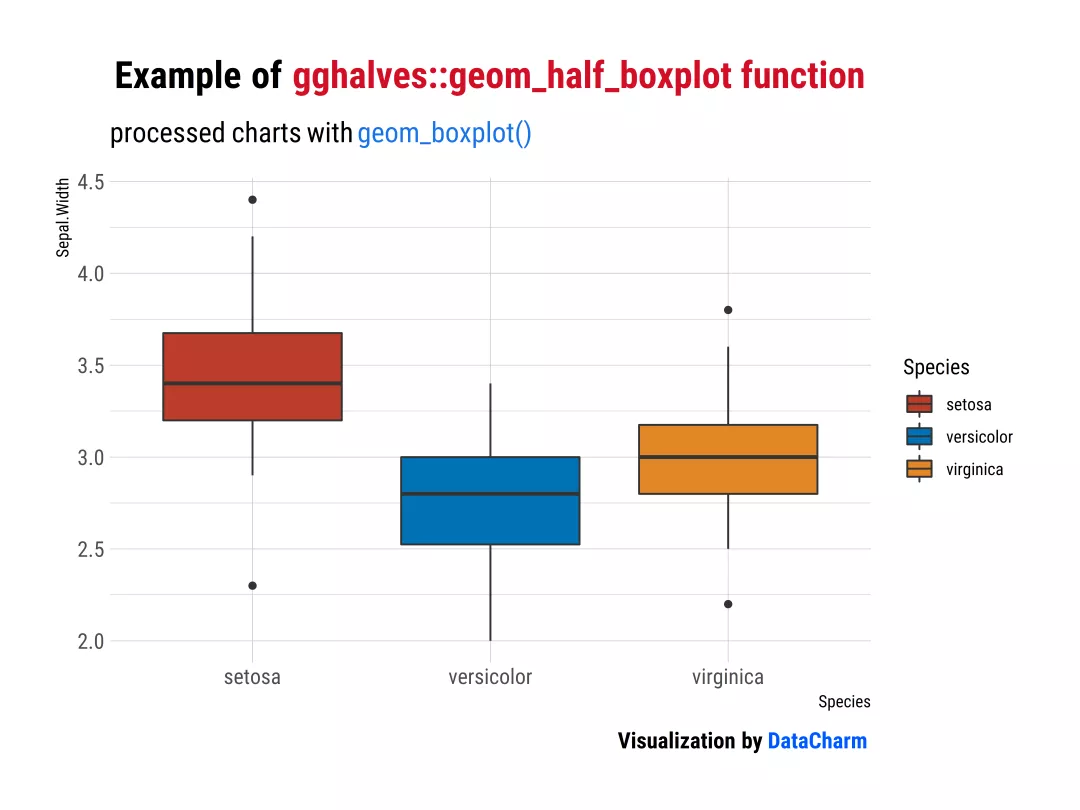
Example of geom_boxplotgeom_half_boxplot():
ggplot(iris, aes(x = Species, y = Sepal.Width,fill=Species)) +geom_half_boxplot(side = "r")
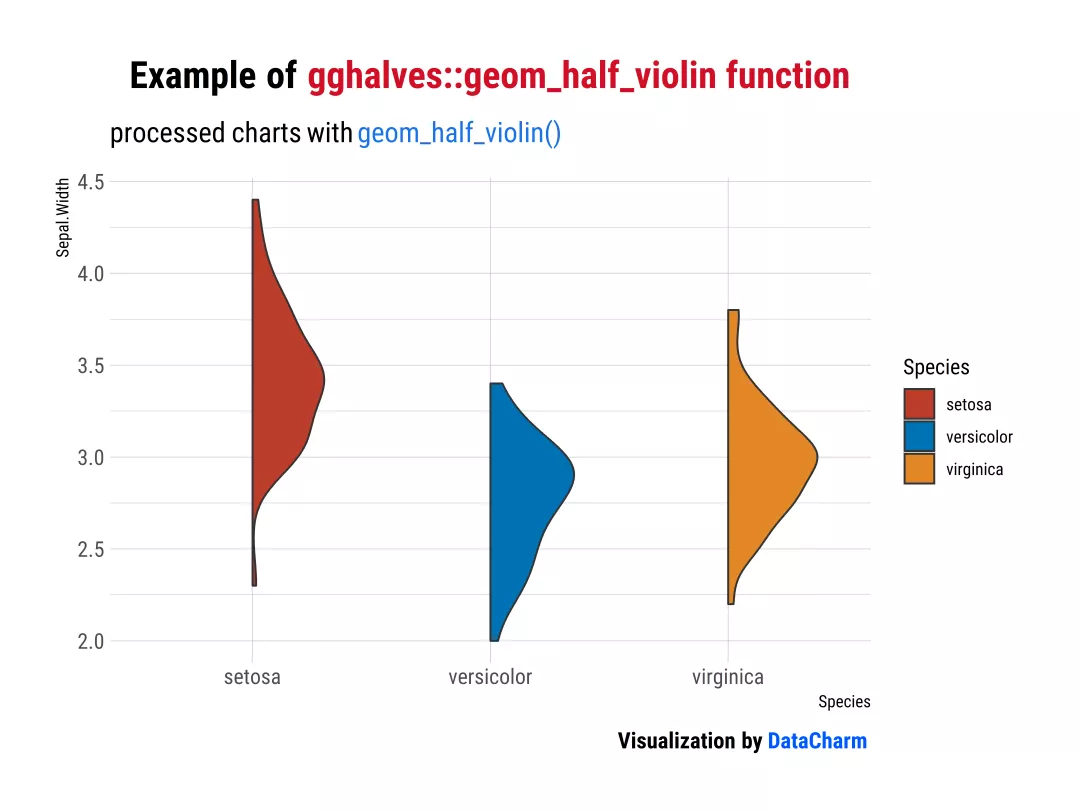
「geom_half_violin()」
这里直接绘制geom_half_violin()结果:
ggplot(iris, aes(x = Species, y = Sepal.Width,fill=Species)) +geom_half_violin(side="r") +ggsci::scale_fill_nejm() +labs(title = "Example of <span style='color:#D20F26'>gghalves::geom_half_violin function</span>",subtitle = "processed charts with <span style='color:#1A73E8'>geom_half_violin()</span>",caption = "Visualization by <span style='color:#0057FF'>DataCharm</span>") +hrbrthemes::theme_ipsum(base_family = "Roboto Condensed") +theme(plot.title = element_markdown(hjust = 0.5,vjust = .5,color = "black",size = 20, margin = margin(t = 1, b = 12)),plot.subtitle = element_markdown(hjust = 0,vjust = .5,size=15),plot.caption = element_markdown(face = 'bold',size = 12))
「geom_half_dotplot()」
ggplot(iris, aes(x = Species, y = Sepal.Width)) +geom_half_violin(data = iris,aes(fill=Species)) +geom_dotplot(shape=21,binaxis = "y", method="histodot", stackdir="up",fill="#A593E0",colour="black",stroke=1)+ggsci::scale_fill_nejm() +labs(title = "Example of <span style='color:#D20F26'>gghalves::geom_half_violin function</span>",subtitle = "processed charts with <span style='color:#1A73E8'>geom_violin()+geom_dotplot</span>",caption = "Visualization by <span style='color:#0057FF'>DataCharm</span>") +hrbrthemes::theme_ipsum(base_family = "Roboto Condensed") +theme(plot.title = element_markdown(hjust = 0.5,vjust = .5,color = "black",size = 20, margin = margin(t = 1, b = 12)),plot.subtitle = element_markdown(hjust = 0,vjust = .5,size=15),plot.caption = element_markdown(face = 'bold',size = 12))
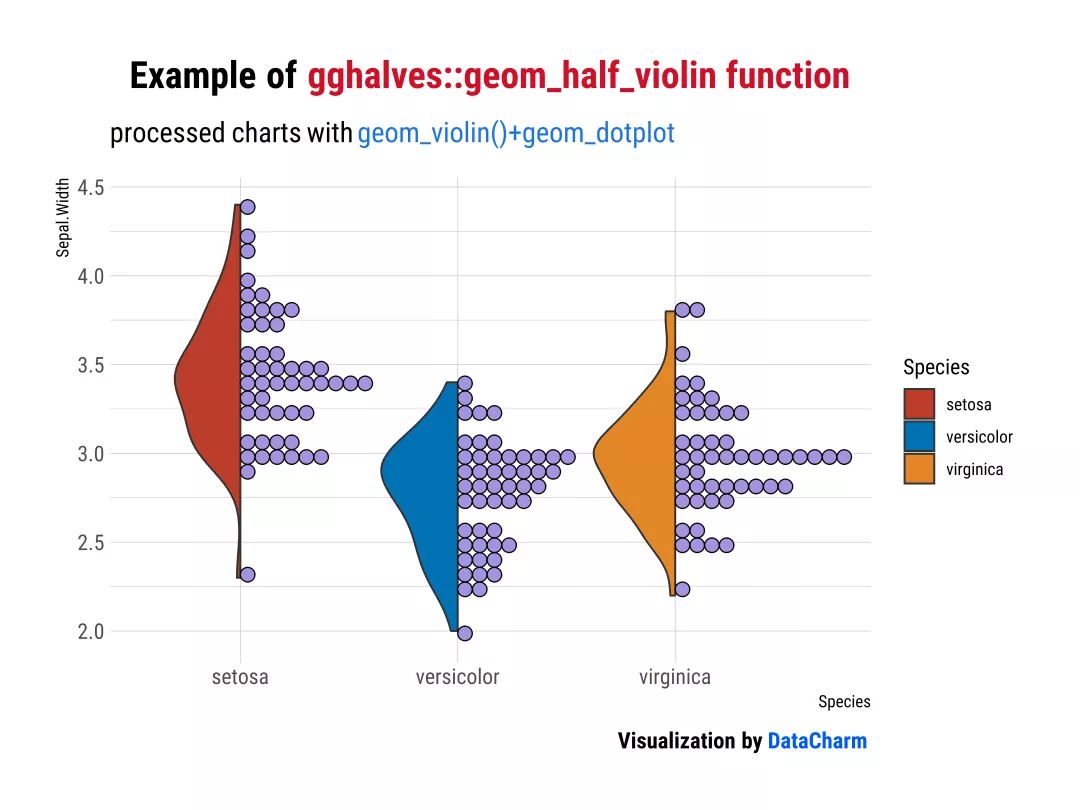
Example of geom_half_violin_dotplot()
当然,还可以这样:
ggplot(iris, aes(x = Species, y = Sepal.Width,fill=Species)) +geom_half_violin() +geom_dotplot(shape=21,binaxis = "y", method="histodot", stackdir="up",colour="black",stroke=1) +ggsci::scale_fill_jco()
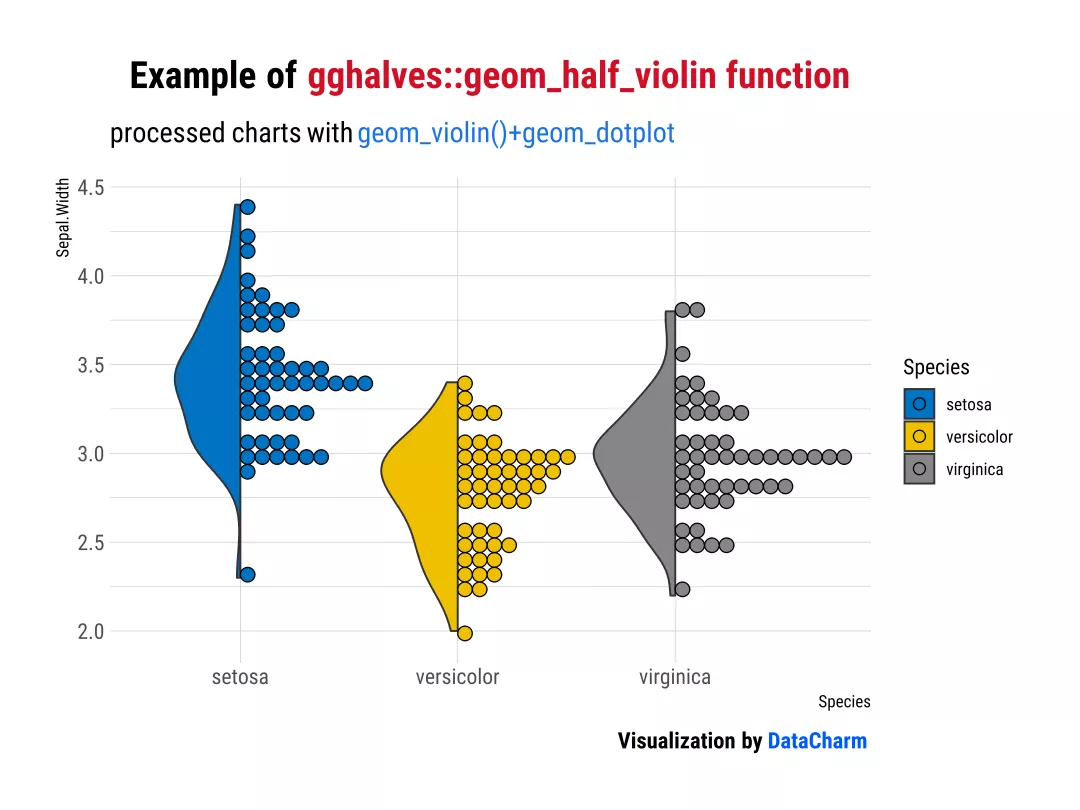
Example02 of geom_half_violin_dotplot()

若有收获,就点个赞吧
0 人点赞
