- LEC 2
- LEC 3
- LEC 4
- Chapter 9 Savings, Investment and Financial Sector
- Chapter 10 Stock markets and personal finance
- Chapter 12 Inflation and the quantity theory of money
- Chapter 13 AS-AD Model
- Chapter 15 - The Federal Reserce System
- Chapter 16 - Monetary Policy
- Chapter 17 - Federal Budget: Taxes and Spending
- Tariffs
- Wasted Resources
- Deadweight Loss
- Winner and Losers
- Child labor
- Chapter 20 - International Finance
- Purchasing power parity (PPP) theorem:
- Monetary Policy (related to Fed.)
- Fiscal Policy (related to Gov.)
- SUMMARY
- Chapter 11 - Unemployment and Labor Force Participation
LEC 2
GDP
- Gross domestic product (GDP) – the market value of all final** **goods and services produced within a country in a year.
- GDP per capita is GDP divided by a country’s population.
- Sale of used goods are not included
- The service of realtors, stock brokers, used car salemen are included because their services represent current economic activity.
- Only production that takes place within the borders of a country is included in GDP.
- Cars produced in Mexico by American firms are not included.
- Cars produced in the U.S. by Japanese firms are included.
- GNP (Gross National Product) The value of goods and services produced by U.S. residents no matter where they live.
Final Goods and Services
- Intermediate goods: sold to firms and then bundled or processed with other goods or services for sale at a later stage.
- Final goods: the finished goods sold to final users and then consumed or held in personal inventories.
ONLY FINAL GOODS ARE INCLUDED IN GDP
GDP Growth

Nominal GDP vs Real GDP
Nominal GDP: Nominal GDP is calculated using prices at the time of sale.
- GDP in 2018 is calculated using 2018 prices.
- GDP in 2017 is calculated using 2017 prices.
Nominal variables, such as nominal GDP, have not been adjusted for changes in prices.
Real variables, such as real GDP, have been adjusted for changes in prices.
GDP deflator
GDP deflator is a price index that can be used to measure inflation.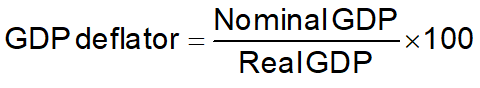

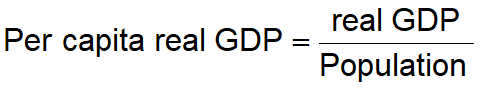
Per capita real GDP

Breaking Down GDP
- National Spending Approach: Add up all the components of spending.
GDP = Consumption + Investment+ Government + NX(Export - Import)
- Consumption spending (C) – sometimes referred to as spending by households.
- Investment Spending (I) – Private spending on tools, plant, and equipment used to produce future output.
- Government spending (G) -Includes all levels of government. -Does not include government transfers. E.g., unemployment insurance (UI) benefits do not count
- Factor Income Approach: Add up all the components of spending.
GDP = Wages + Rent + Interest + Profit
Exercise
LEC 3
Measuring Growth
Growth between t-1 and t, 单位是%, x100是方便理解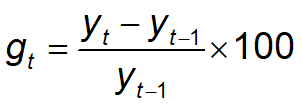
gt = growth rate of real GDP per capita
yt = real GDP per capita in time period t
The Rule of 70
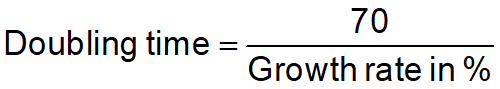
e.g. If real GDP per capita is growing at an annual growth rate of 3.5%, it will double in: 70/3.5 = 20 years
Key Facts about Economics
- GDP per capita varies enormously among countries
- Everyone used to be poor
- There are growth miracles and growth diasters
- Miracles: Japan, South Korea
- Diasters: Nigeria, Argentina
Causes of growth in GDP per capita
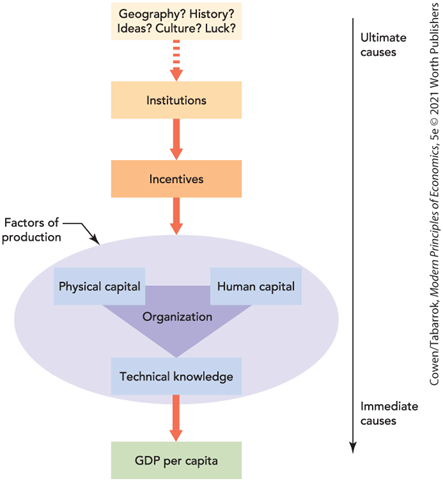
Physical capital:
The stock of tools that include machines, structures, and equipment.
Human capital:
The productive knowledge and skills that workers acquire through education, training, and experience.
Technological knowledge:
The knowledge about how the world works that is used to produce goods and services.
-> Diff. from human capital:
- Technology knowledge requires human capital combined with phsical capital to create ouptut
- Human capital is increased with education, while technological knowledge is increased with research and development.
Incentives and Insitutions
Institutions - the “rules of the game” that structure economic incentives.
- Property rights
- Honest government
- Political stability
- A dependable legal system
- Competitve and open markets
Growth type
- Catch-up growth: take advantages of ideas, techs or methods of management already existence.
- Cutting-edge growth: developing new ideas.
Solow Model
Y = F(A, K, eL)
A: ideas
K: Physical capital
eL: Human capital, or education x Labor
NOW, if A, e and L constant -> Y = F(K)
MPk: Marginal Product of capital
- The additional output resulting from using an additional unit of capital.
- As more capital is accumulated, the MPK gets smaller and smaller. (diminishing returns)
LEC 4

Conditional Convergence
Conditional Convergence: Among countries with similar steady state levels of output, poorer countries grow faster than richer countries.
Idea
The economics of ideas becomes the key to understanding growth on the cutting edge.
创新是经济发展原动力
Spillovers 溢出效应
Non-rivalrous - A good that two or people can consume at the same time.
Implication: Too few ideas are generated.
Conclusion: New ideas are the driving force behind long-run economic growth.
专利,政府投资都是为了保护new ideas
Chapter 9 Savings, Investment and Financial Sector
Important definitions
- Saving - income that is not spent on consumption goods
- Investment - purchase of new capital: tools, machinery, factories
(investment is not defined eby economists the same way a stockbroker defines investment)
SAVING IS WHAT NOT CONSUMED
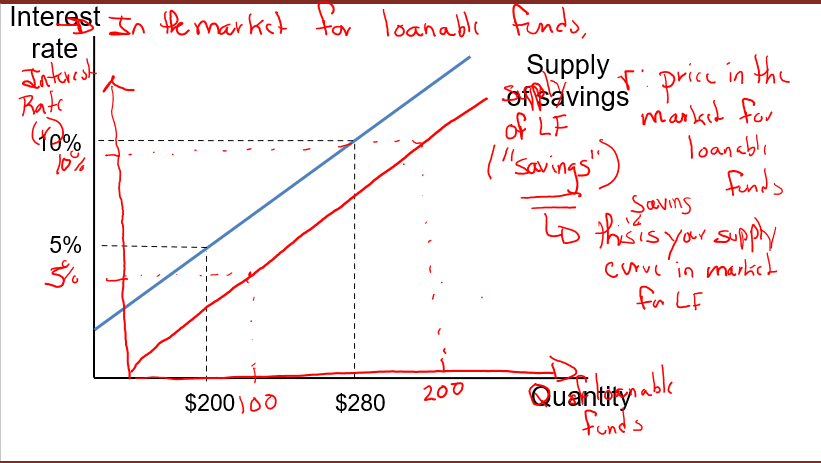
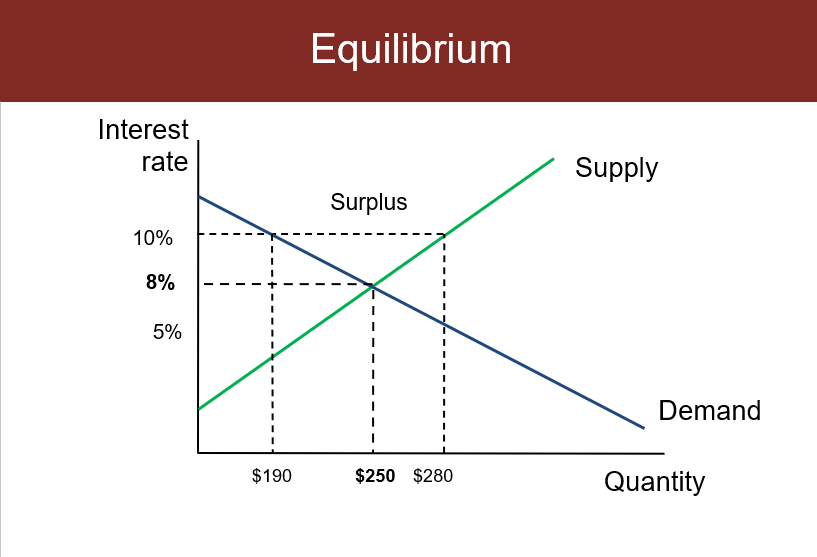
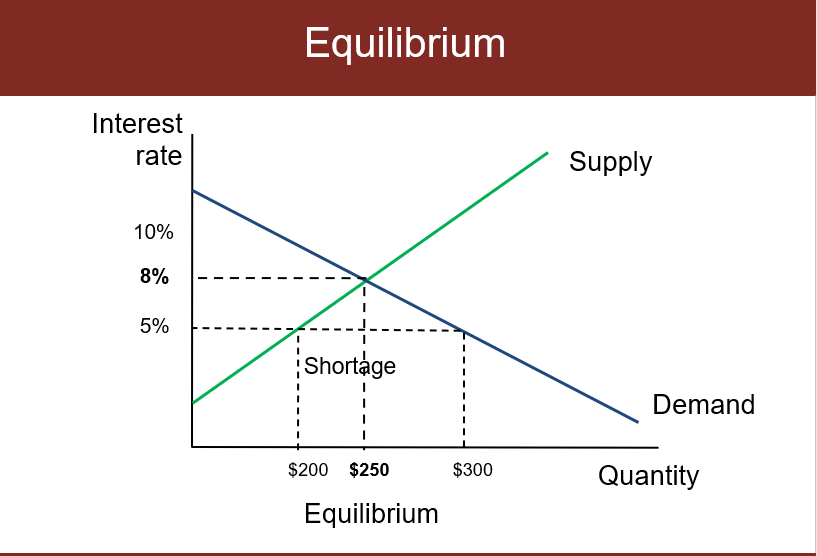
What determines the supply of loanable funds (savings)?
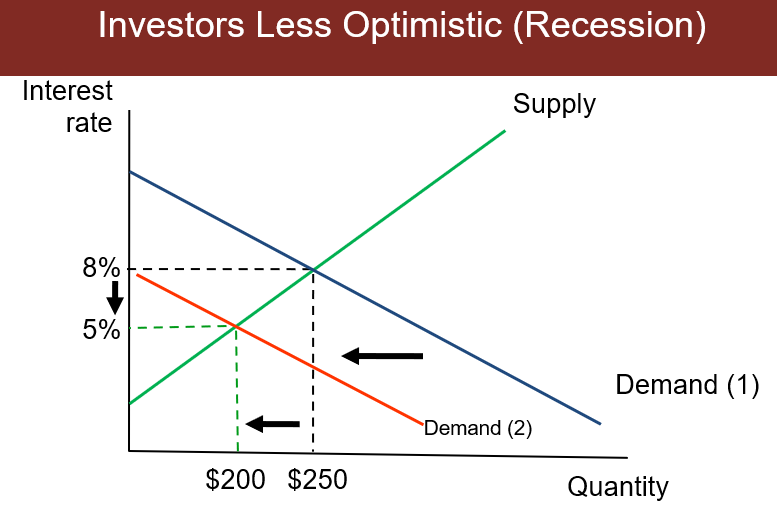
- Smoothing consumption
- people don’t want large declines in consumption
- Impatience
- anything with immediate costs and future benefits must overcome time preference, e.g. college education, crime is a reflection of impatience
- if people are less patient, then savings will be lower, vice-versa
- Market and psychological factors
- Interest rates
- if banks promise a higher interest ratem then people will save more
Banks
- Gather savings
- Reduce cost of mobilizing savings to productive uses
- spread risk
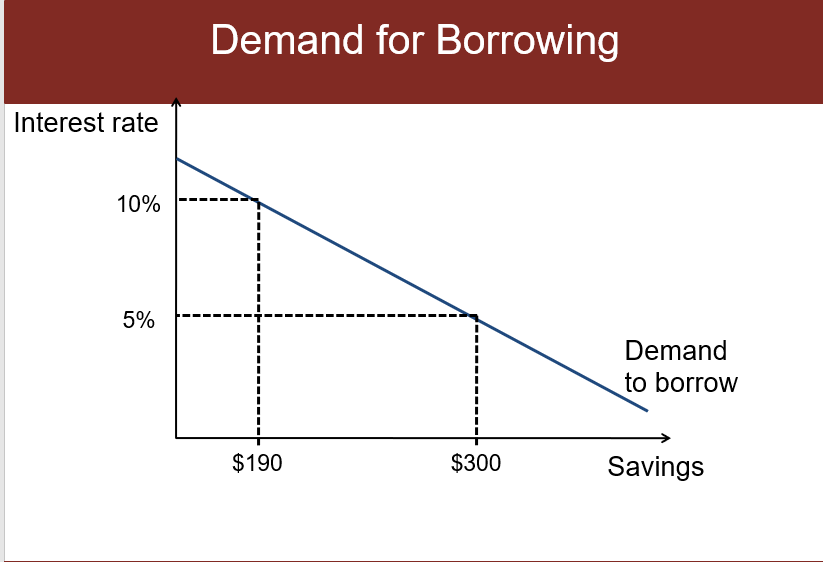
Bond Market
Bond - how much and when payment must be paid
- Lender: one who buys a bond
- borrower: one who issues a bond
TERMS:
- Maturity date - the date at which you receive the face value
- Face value - cash amount you receive at the maturity (amount of the final payment )
- coupon payment - amount that bond pays until maturity date (small payments at pre-determinaed intervals during the lif of the bond)
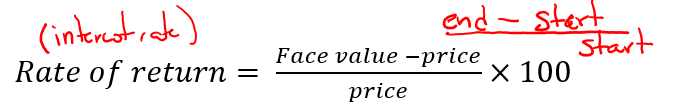
market price of a bond is inversely related to the interest rate -
IF bond price up, (FV - price) down, so interest down (assume Face value no change)
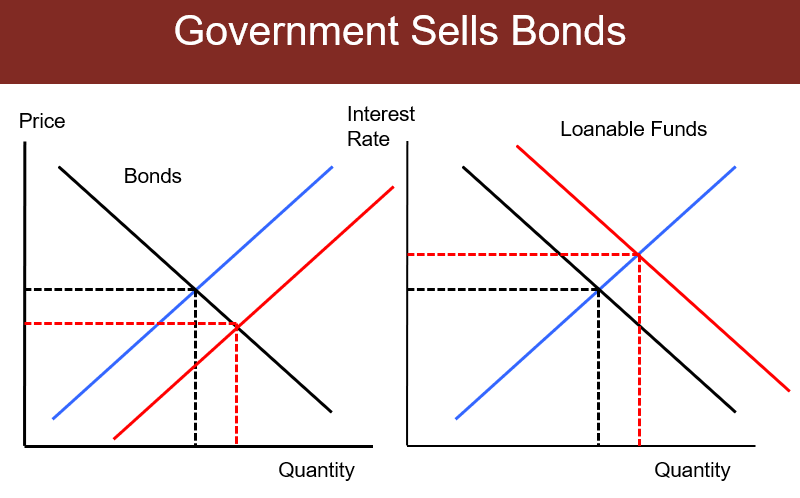
Government sells bonds
- governments borrow by issuing bonds
- governments borrowing can “crowd out“ private spending
- crowding out - decrease in private spending that occurs when government borrows more
- borrowing ↑ -> interest rate ↑ -> (Saving ↑, consumption ↓, investment ↓)
- private demand doesn’t shift
- higher interets means less private borrowing, and less consumption b/c people save more
Arbitrage
Arbitrage - the buying and selling of equally risky assets, ensures that equally risky assets earn equal return
Present and Future Value
Present Value (price) is the discounted value of a steam of payments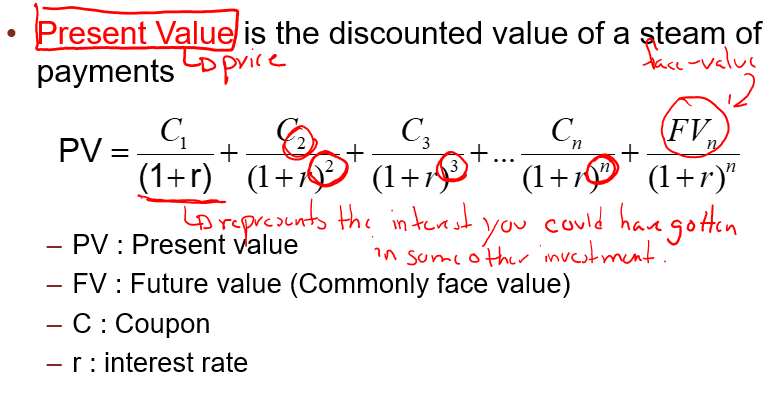
EXAMPLE:
What is the present value of a bond that pays $5 a year for 3 years, and has a face value of $10? 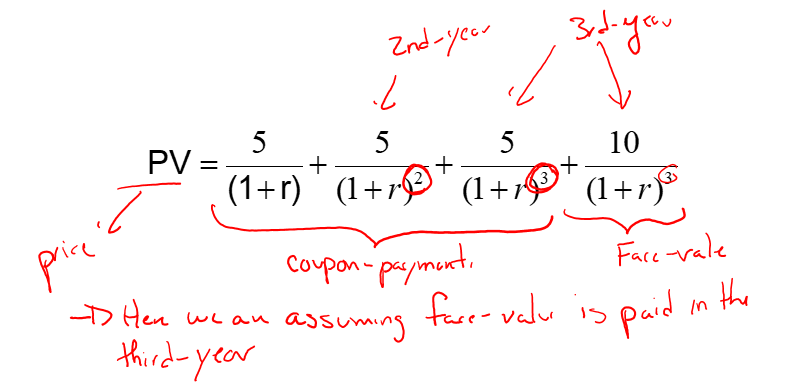
Stock Market
Stock market is a certificate of ownership in a corporation
IPO(initial public offering) - the first time a corporation sells stock to the public to raise capital
Interest rate control
Usury Lawas - create legal ceilings on interest rates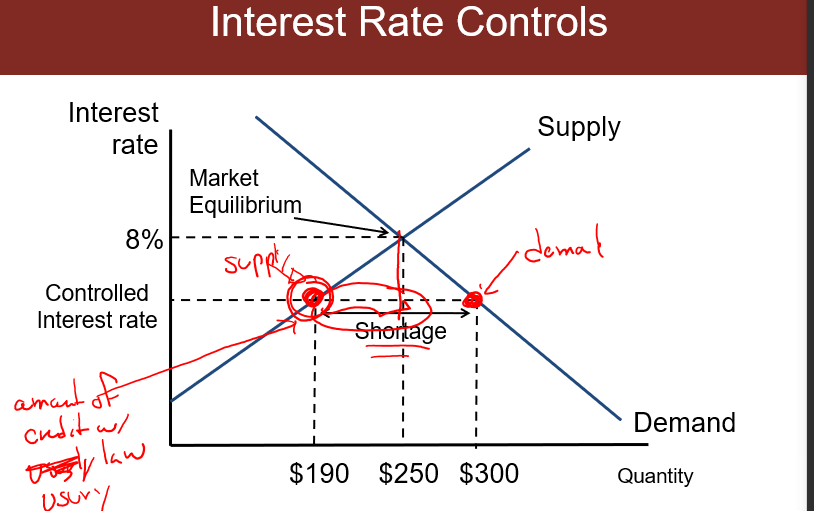
Leverage
Owner equity - the value of the asset minus the debt, E = V - D
Leverage ratio - the ratio of debt to quity, D/E (for every money you put in, how much you borrow)
Insolvency - a firm’s liabilities > assets
Securitization
bundiling loans together and selling the bundles as financial assets
Chapter 10 Stock markets and personal finance
Active investing - picking individual stocks, done my money mutual funds (NOT GOOD)
Passive investing - choosing a group of stocks that mimic a broad market index
The Efficient Markets Hypothesis
- prices of traded goods reflect all publicly available information. Secrets do not last very long in the stock market.
How to pick stocks:
- diversify - choose a large number of stocks
- Want to pick a stock that is negatively correlated with stock
- buy and hold - hold them for long run
- avoid high fees
- No free lunch principle - high return high risk
Bubbles
Occur when asset prices rise far higher and more rapidly than can be accounted for by the fundamental prospects of the company.
Chapter 12 Inflation and the quantity theory of money
Inflation
- an increase in the average level of prices
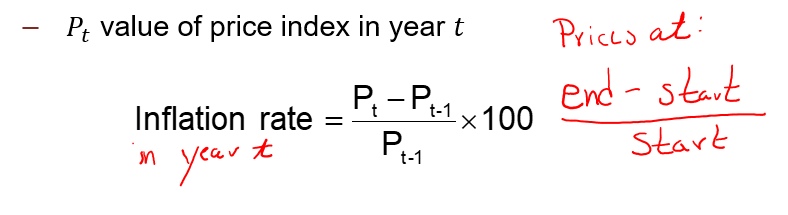
Price indices
- Consumer price index (CPI) - (a basket of goods weighted by price)
- def. measures the average price of goods bought by a typical American consumer
- referred to as the “cost of living index”
- higher priced items given more weight
- USING CPI to calculate Real prices - base prices * (CPI_1/CPI_0)
- Producer price index (PPI) - (Average price of producers)
- def. measures the average price received by producers
- includes intermediate goods as well as final goods
- used to calculate changes in the cost of inputs
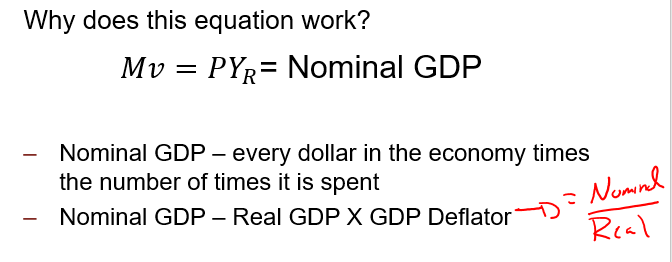
- GDP deflator
- GDP deflator t = Nominal GDPt / Real GDPt x 100
Quantity Theory of Money
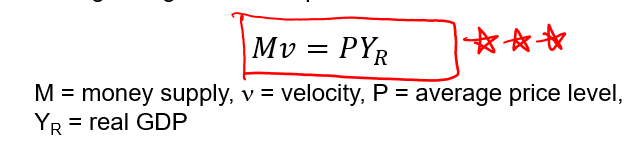
- Real GDP is stable compared to the prices
- volocity of money is stable compared to the money supply
THEREFORE -
inflatation is caused by the increase in the money supply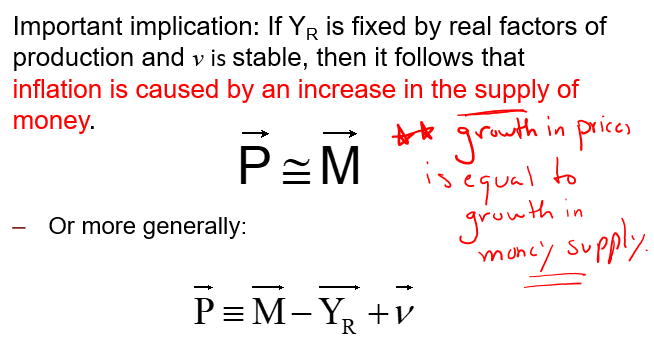
Cause of inflation
in long run, money does not increase GDP, money is neutral.
Monetizing the debt: print money to pay debt
- price confusion and money illusion -
- inflation makes price signals more difficult to interpret;
- people mistake changes in nominal prices for changes in real prices
- inflation redistributes wealth
- inflation is type of tax. It transfers wealth to the government
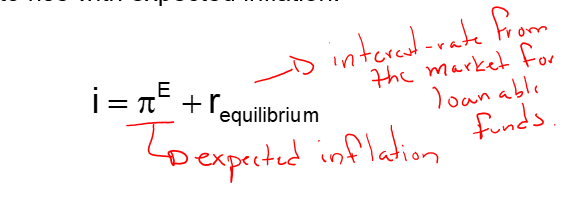
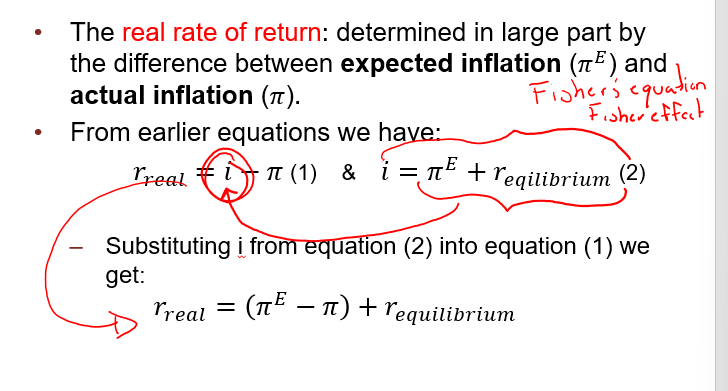
- Nominal rate of return - the rate of return does not account for inflation
Real rate of return - the nominal rate of return minus the inflation rate
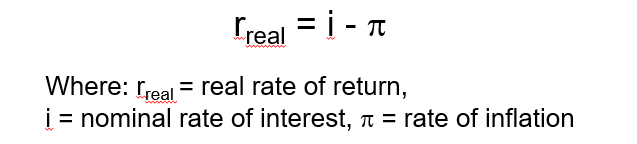
- Fisher effect - the tendency for nominal interest rates to rise with expected inflation
-
- inflation interacts with other taxes
- inflation is painful to stop
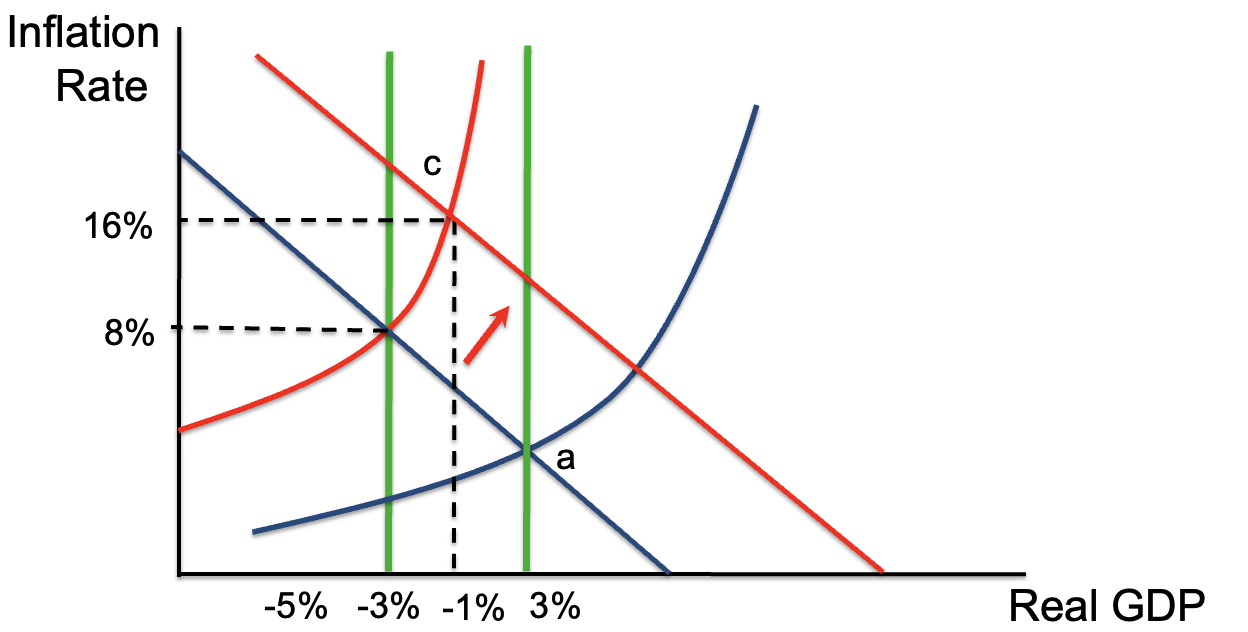
Chapter 13 AS-AD Model
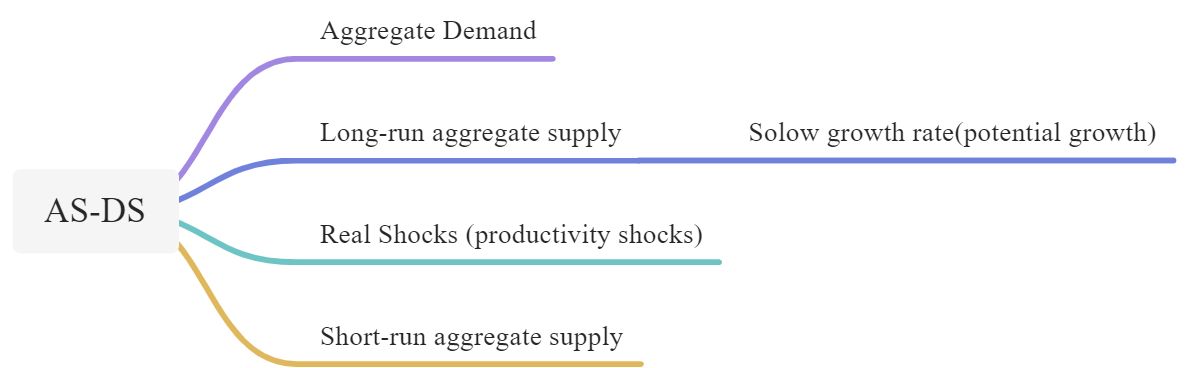
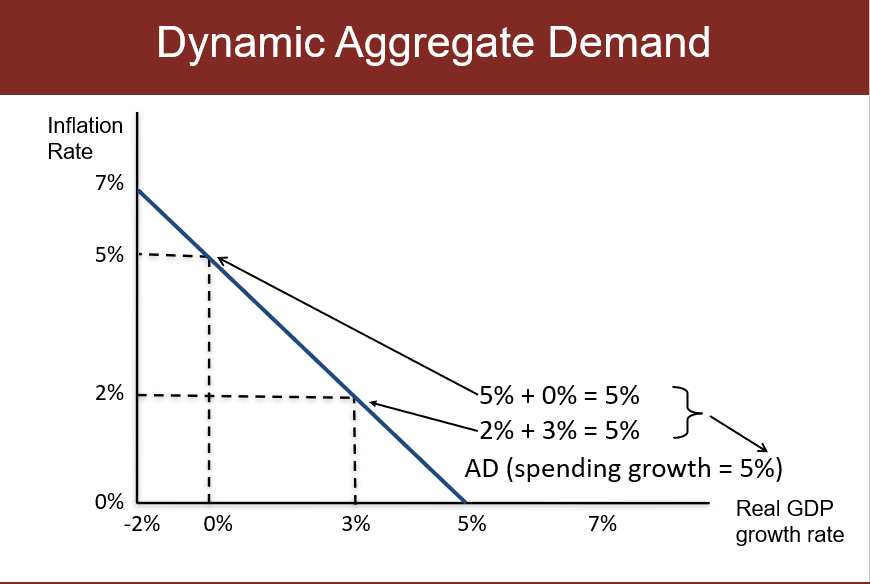
Aggregate demand curve
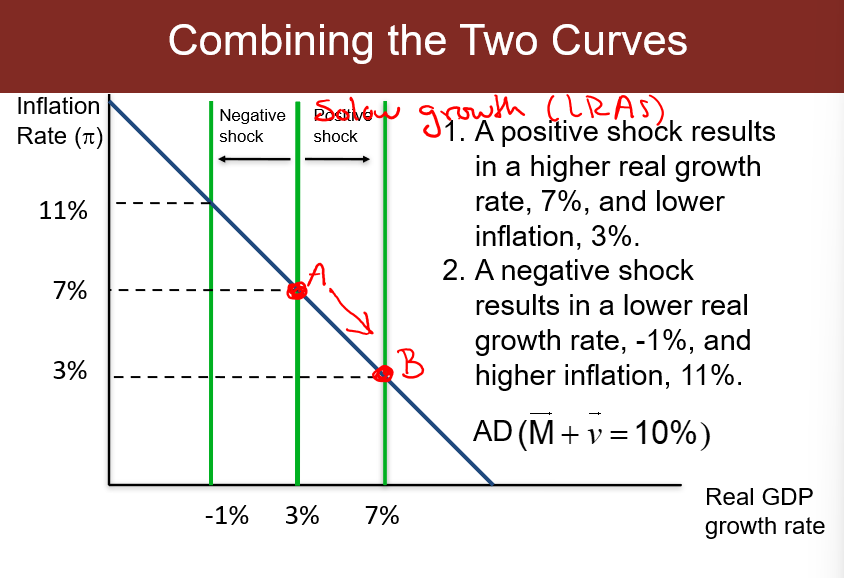
Shows all the combinations of inflation and real GDP growth that are consistent with a specified rate of spending growth:
- — (Spending growth = output growth(real GDP) + inflation)
Real shocks cause shifts in the LRAS curve; they don’t explain the slope of the SRAS curve.

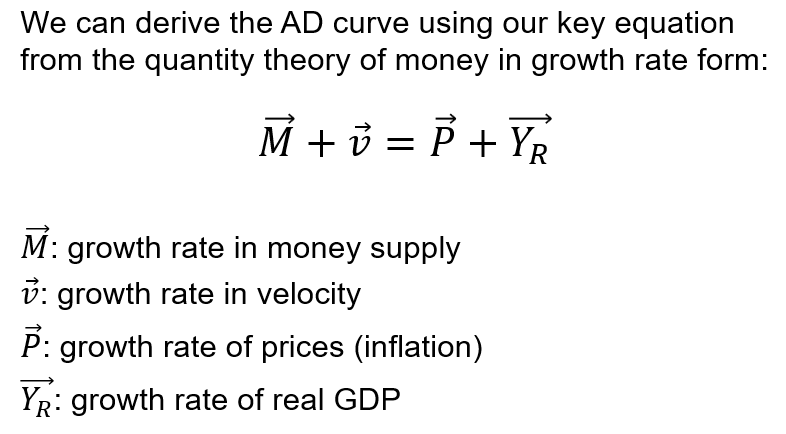
Changes in spending growth (M-> + V->) will shift the AD curve 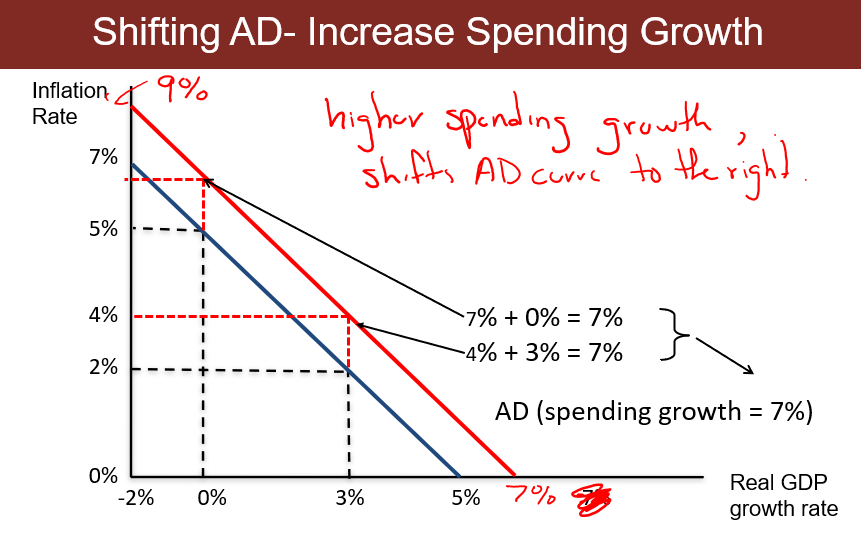
Solow Growth Curve (LRAS)
- AKA: “Long-Run Aggregate Supply curve”
important point: if markets are working well and prices are prefectly flexible, the economy will growth at the potential growth rate - *growth rate in normal times 自然增长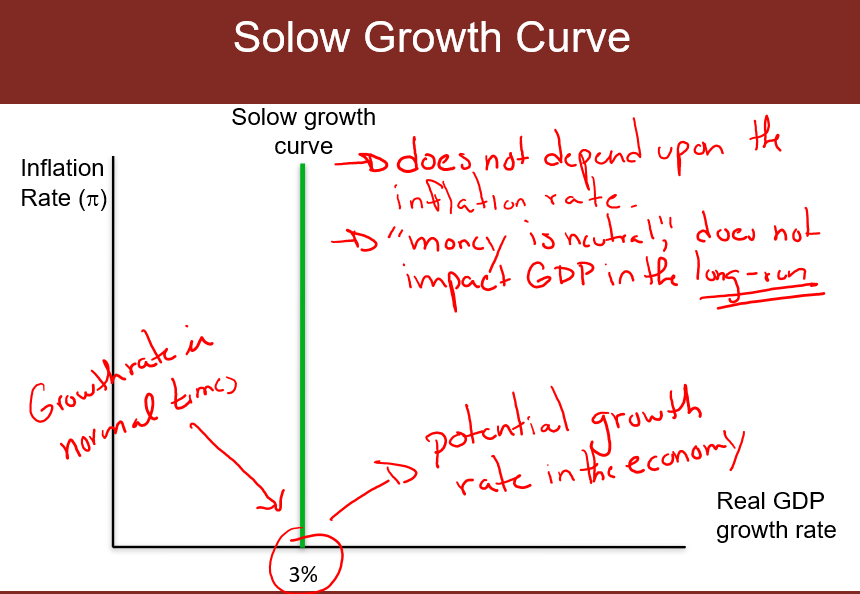
WHY is the Solow Growth Curve vertical?
- potential growth doese not depend on the inflation rate
- money is neutral
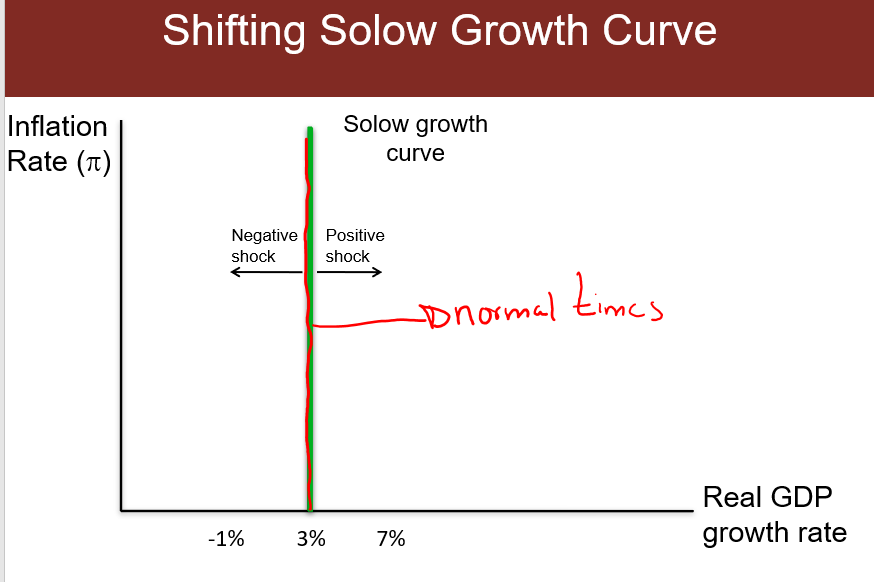
Real shock - shifting Solow growth curve
real shock - also called a productivity shock, is any shock that increases or decreases the potential growth rate.
- Positive real shock - shifts the Solow growth curve to the right -> higher real growth (interest)
- Negative real shock - shifts the Solow growth curve to the left -> lower real growth (COVID)

Short Run

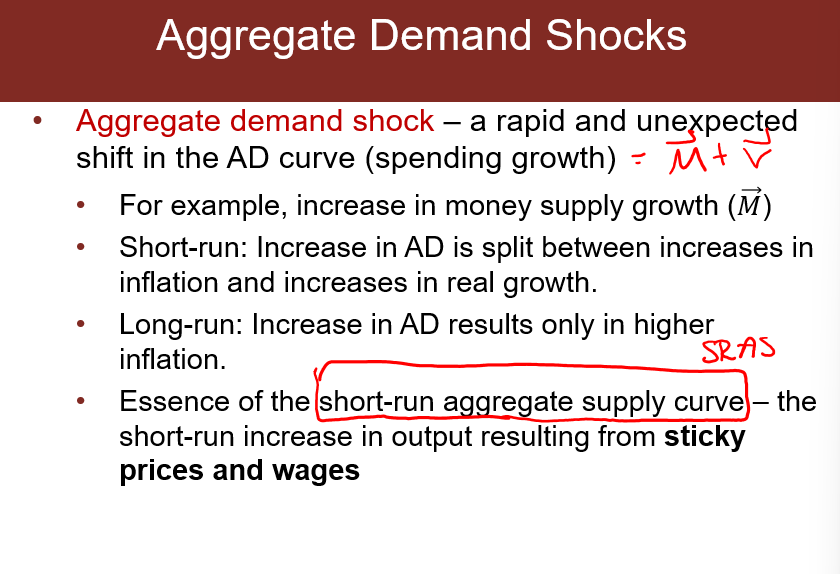
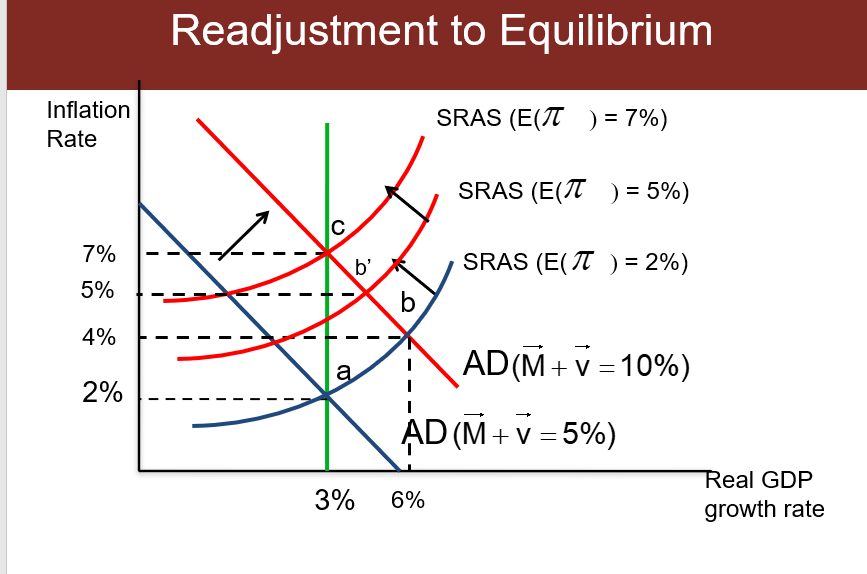
Why does the SRAS shift up?
–In the long-run, unexpected inflation becomes expected inflation.
–An increase in AD → higher expected inflation.
–Higher expected inflation causes producers and workers to raise prices and wages in order to hold real incomes and wages constant.
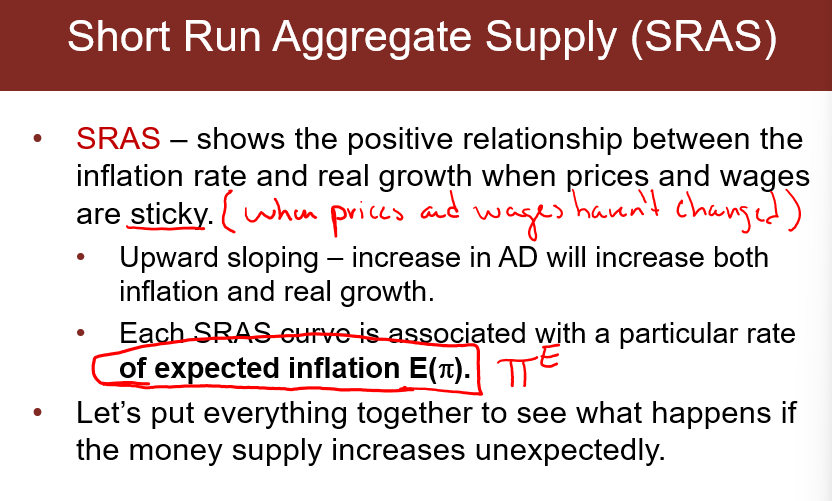
- SRAS is particular related with the E(pi)
–The SRAS shifts up so that the actual inflation rate equals the expected inflation rate.
Decrease - 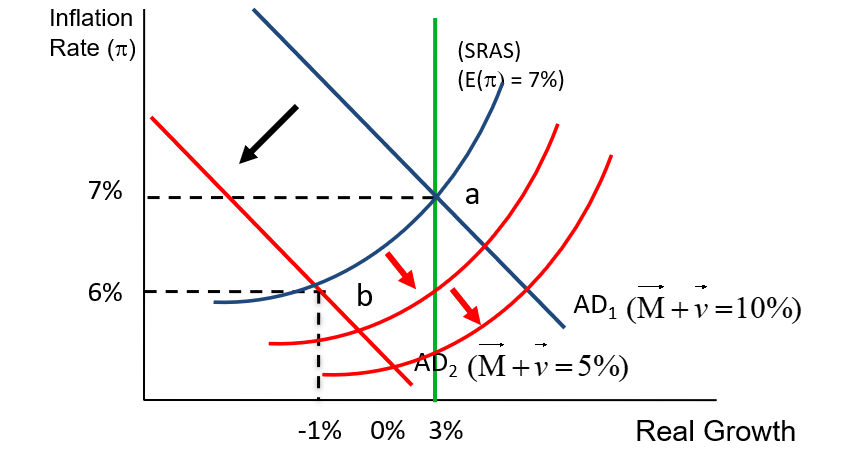

Money supply change and velocity change
- money supply change will cause a permanent change
- velocity change is temporoly and short run, so it will come back in the long-run


Chapter 15 - The Federal Reserce System
Def. The Central Bank of the United States
Two customers:
- The government’s bank
- It maintains the bank account of the U.S. Treasury
- It manages government borrowing
- The banker’s bank
- large private banks keep their own accounts
- banks acn borrorw from the Fed.
Most important function: regulate money supply
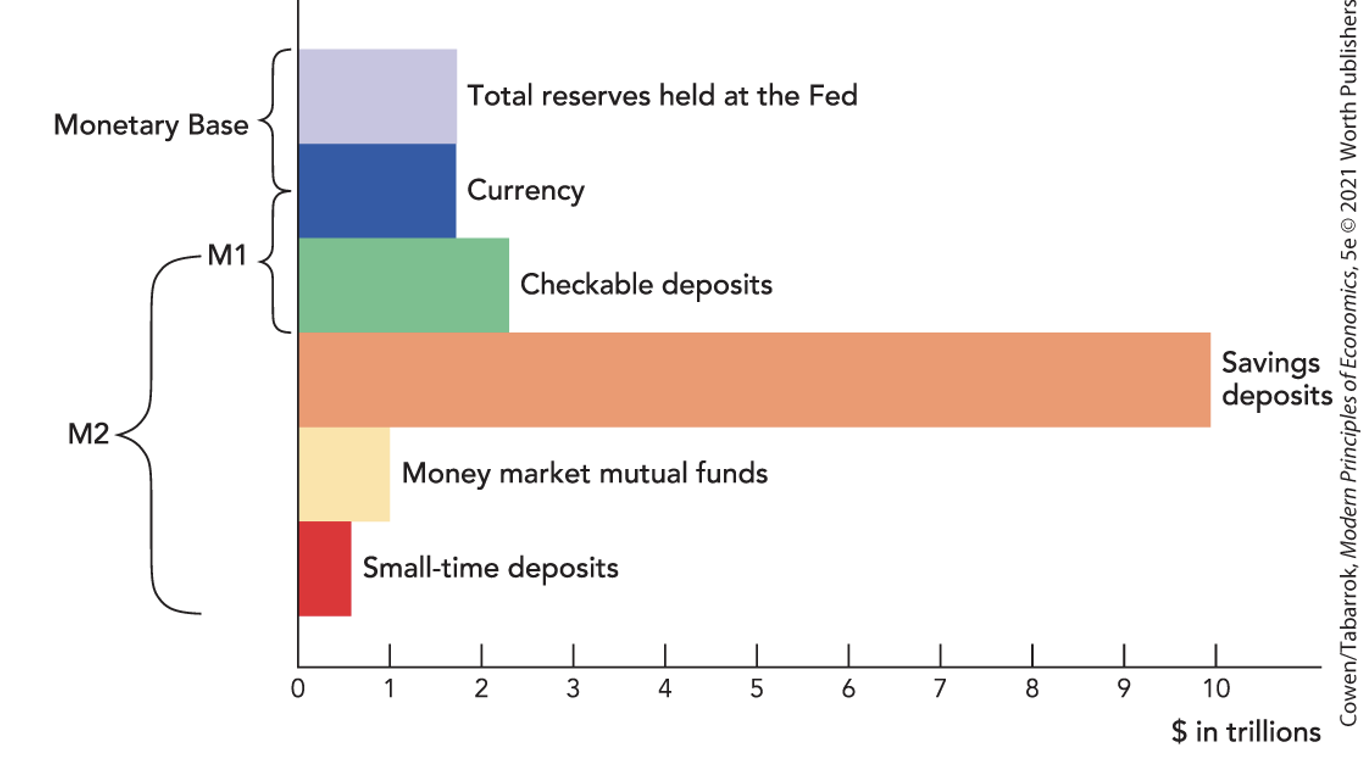
Total reserves - value of accounts banks have at Fed. reserve sys.
(M1, MB) Currency - conins and paper bills
(M1) Checkable deposits - deposits you can write checks on or access with a debit card
(M2 - checkable deposits ) Savings deposits, money market mutual funds, small-time deposits - not as liquid as the other means of payment, can be used to pay for goods but needs extra effort.
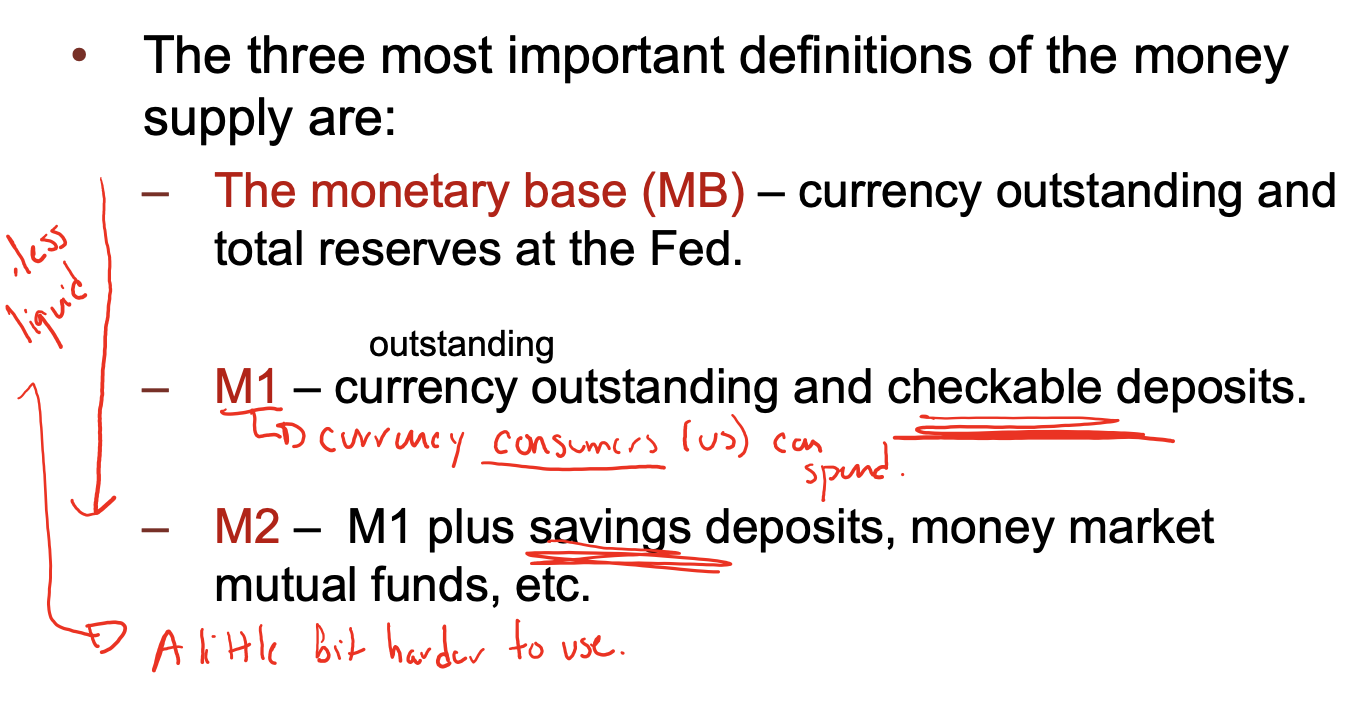

Difficulty of Central banking:
- Can only direct control over the monetary base
- but M1 and M2 have greate impack on AD
- Try to conrol over MB to influence M1 and M2
Fractional Reserve Banking
Def. banks hold only a fraction of deposits on reserve
Depends on:
- Reserve Ratio (RR) - the fraction of deposits held on reserve
- determined by how liquid banks wish to be
- Fed. sets a minimum RR
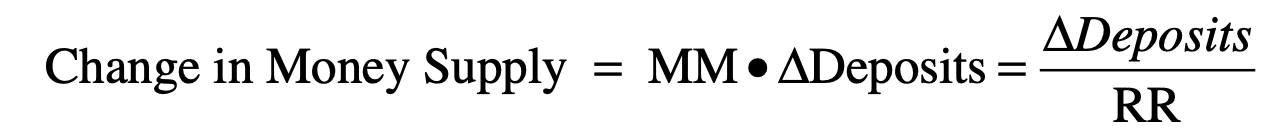
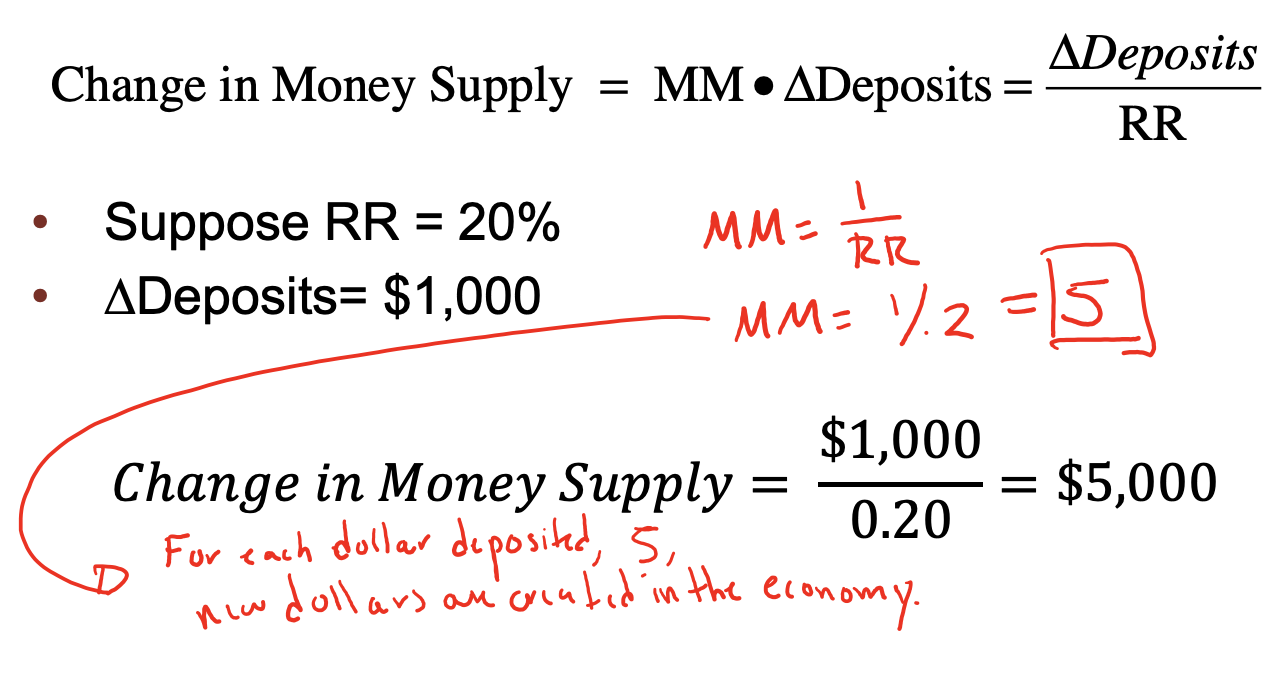
- Money multiplier (MM) - the amount the money supply expands with each dollar increase in reserves
How Fed controls the Money Supply
Three major tools:
- Open Market Operations - buying and sellling of US gov. bonds
- short-term bonds: Treasury bills(T-bills)
- if Fed. want to increase MS, they buy T-bills:
- seller reserves increase -> bank lonass increase -> MS increase
- Change in Money Supply = MM * delta(Deposits) = delta(Reserves) / RR
- when the banks are confident and eager to lend, MM will be higher(RR lower, bank keeps less)
- when banks are fearful and reluctant to lend, MM higher(RR higher, bank keeps more)
- OMO and interest rates: (bond price and interest rate negatively related)
- buying and selling gov. bonds will change interest rates
- Fed. buys bonds -> Demand for bonds increase -> price of bonds inrease -> interest rates decrease (capital outflow from country -> downward pressure on currency of the country -> money become cheaper)
- Fed. sells bonds -> supply of bonds increase -> prince of bonds decrease -> interest rates increase
- buying and selling gov. bonds will change interest rates
- The Fed. controls the real interest rate only in short-run
- Federal Funds rate: Fed. has greatest influence over the shotr tem interest rate - the overnight lending rate that banks charge each other. 银行互相借款
- The Fed. controls the Federal Funds rate through its control of the monetary base
- Discount rate lending and the term auction facility - fed. reserve ledning money to banks 银行向联邦借款
- Discount rate - the interest rate banks pay when they borrow directly from the Fed.
- Two financial problems banks faces:
- Insolvency - libilities > assets 破产
- liquidity crisis - many depositors want their money back at the same time, to avoid these crises, FDIC was set up
- Required reserves and payment of interst on reserves - changing the minimum RR for banks and other depository institutions; paying interest on any reserves held by banks at the Fed.
- Fed. decrease interest rate on reserves -> banks decrease reserves, and increase loans -> increase MS
- AD and Monetary Policy
- Fed. buys bonds -> MS increase, interest rates decrease -> spending(AD) increase
SUMMARY
- The Fed. has the most influence over real rates of interest in the short-run, but has no influence over long-run real rates of interet
Chapter 16 - Monetary Policy
Overshooting and Undershooting: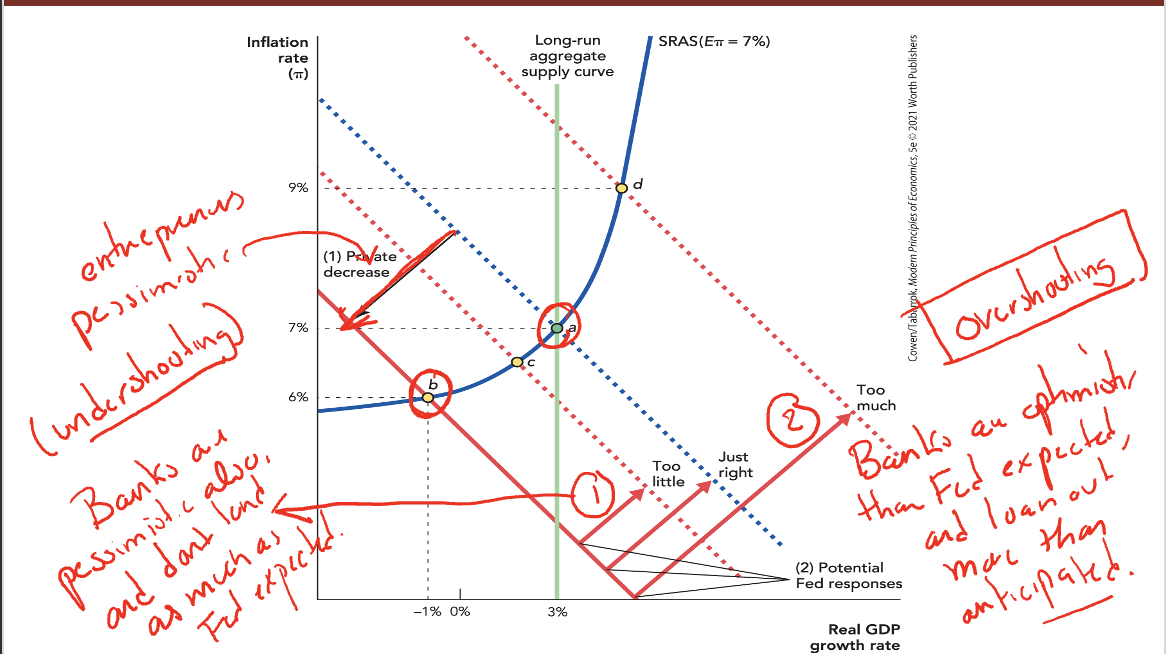
Rules vs. Decisions
Two positions
- Monetary policy should be governed by transparent rules
- Fed. not try to respond to every shock, but set target ranges for M1 and M2, eg. Milton Friedman’s rule: increase the money supply by 3% a year
- Fed. should have the discretion to do what they think best.
Market confidence - one of the Fed’s most powerful tools is its influence over expectations, not its influence over the money supply
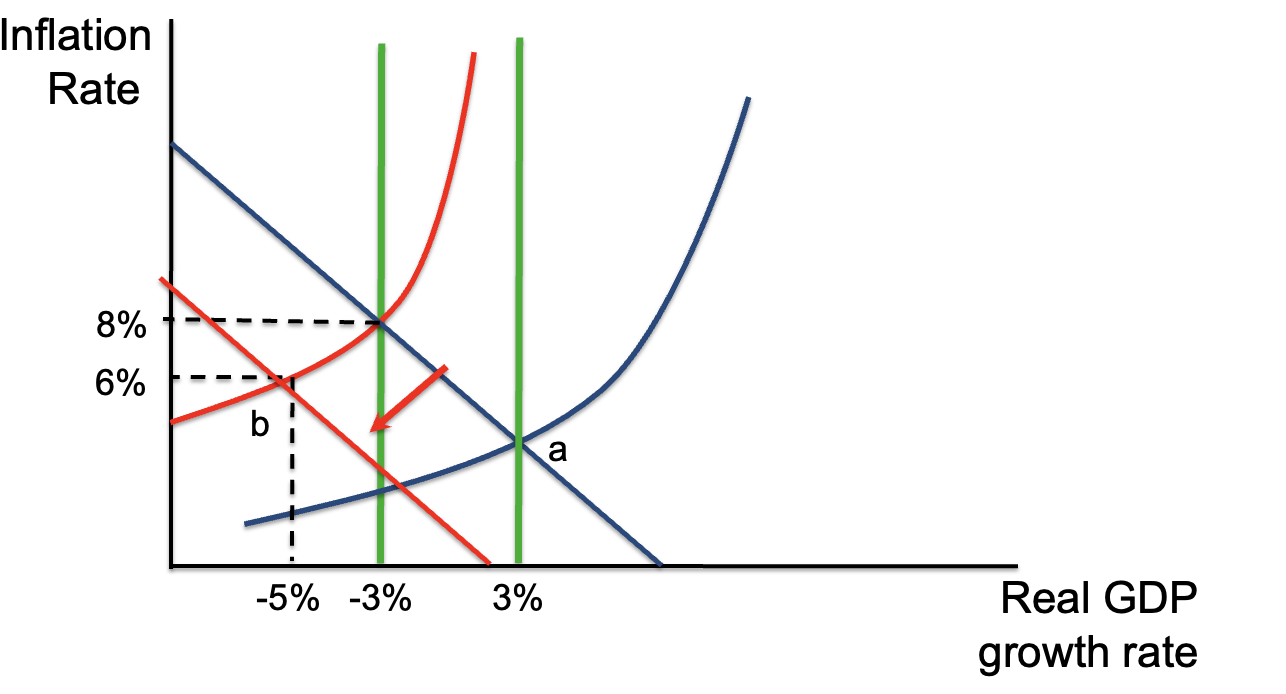
Negative Real Shocks
Monetary policy is less effective at dealing with a real shock
Dilemma:
- Decrease MS to deal with inflation -> real GDP fall and unemployment increase
- Increase MS to deal with the decrease in real growth -> inflation increase
Dealing with Bubbles
- few people expect
- not easy to know when a bubble is present
- monetary policy is a crude means of popping a bubble
SUMMARY
- Fed. has some influence over the growth rate of real GDP through its influence on the MS and thus AD
- getting it “just right” is not guaranteed
Chapter 17 - Federal Budget: Taxes and Spending
Tax revenues
Three sources account for more than 90% of the revenue
- individual income tax
- social security and medicare taxes
-
Individual income tax
Mariginal tax rate (MTR) - the percent paid in taxes on one extra dollar of income
- Average tax rate (ATR) - total average
- Alternative minimum tax - prevent the rich from not paying income taxes (select the higherest of two selections)
U.S. tax system is progressive:
people with higher incomes pay higher percentage
Flat tax - has a constant tax rate
- advantages: less complexity; lower compliance cost; greater incentive to save and invest
- disadvantafe: MTR for the bottom 80% of taxpayers would rise
Spending
2/3 spent on: social security, defense, medicare and medicaid
Social security
- cannot borrow from the account
- cannot make an early withdrawal even an emergency situation
-
Medicare
-
Medicaid
medical coverage for poor & disabled
National debt and deficits
Def. of National Debt held by the public - all federal debt held outside the U.S. govermment 向国外借的钱
Def. of Deficit - the annual difference between federal spending and revenues
Chapter 19 - International Trade
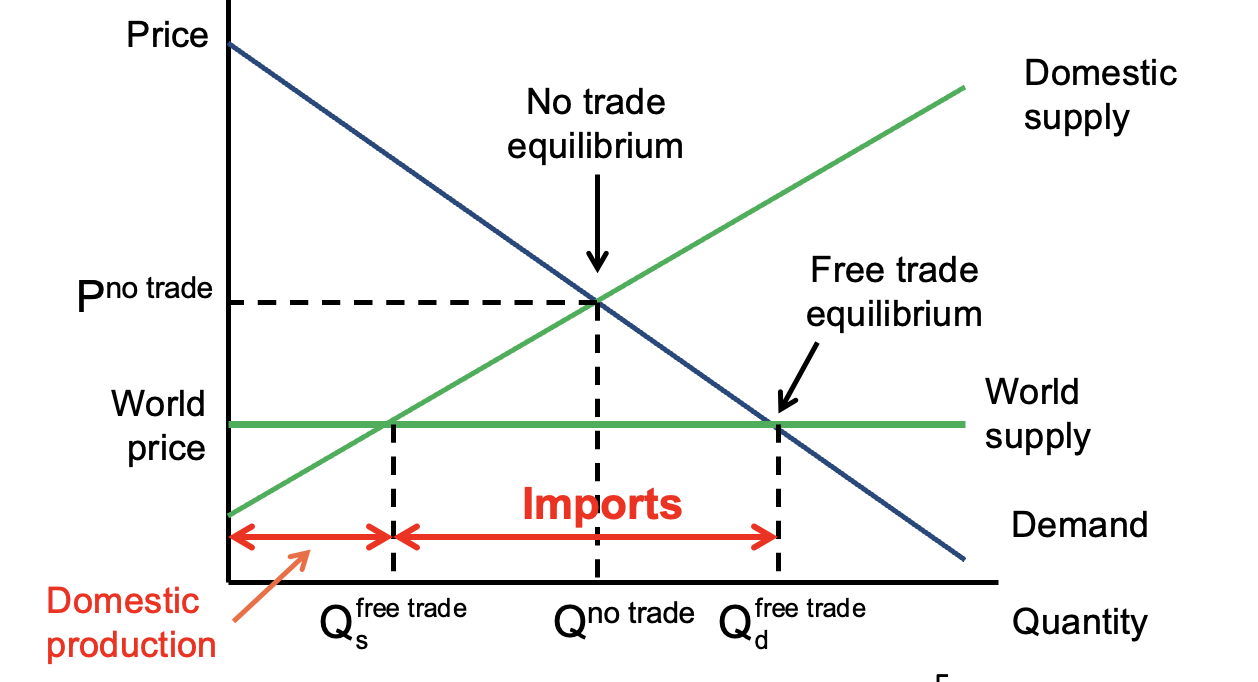
Protectionism - restraining trade through quotas, tariffs and other regulations
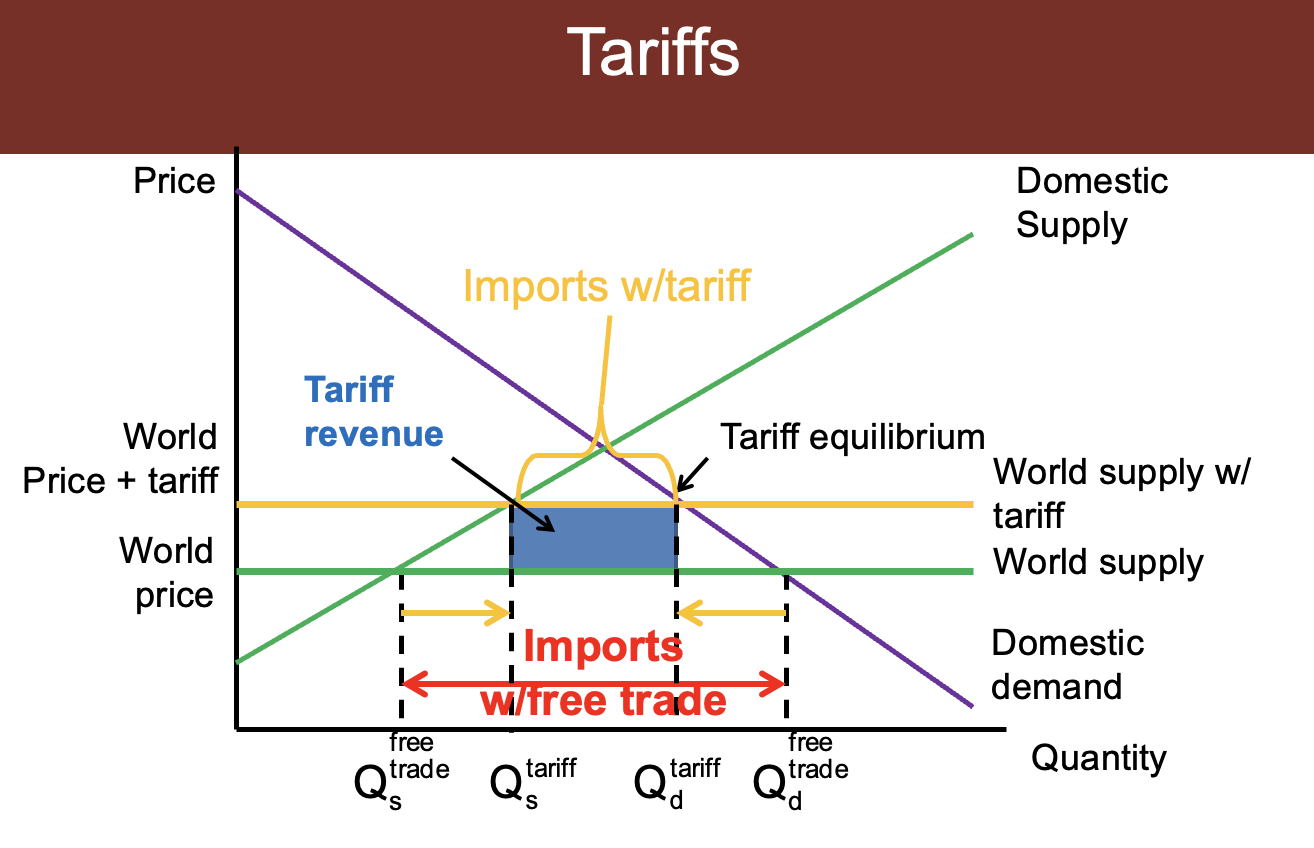
Tariffs
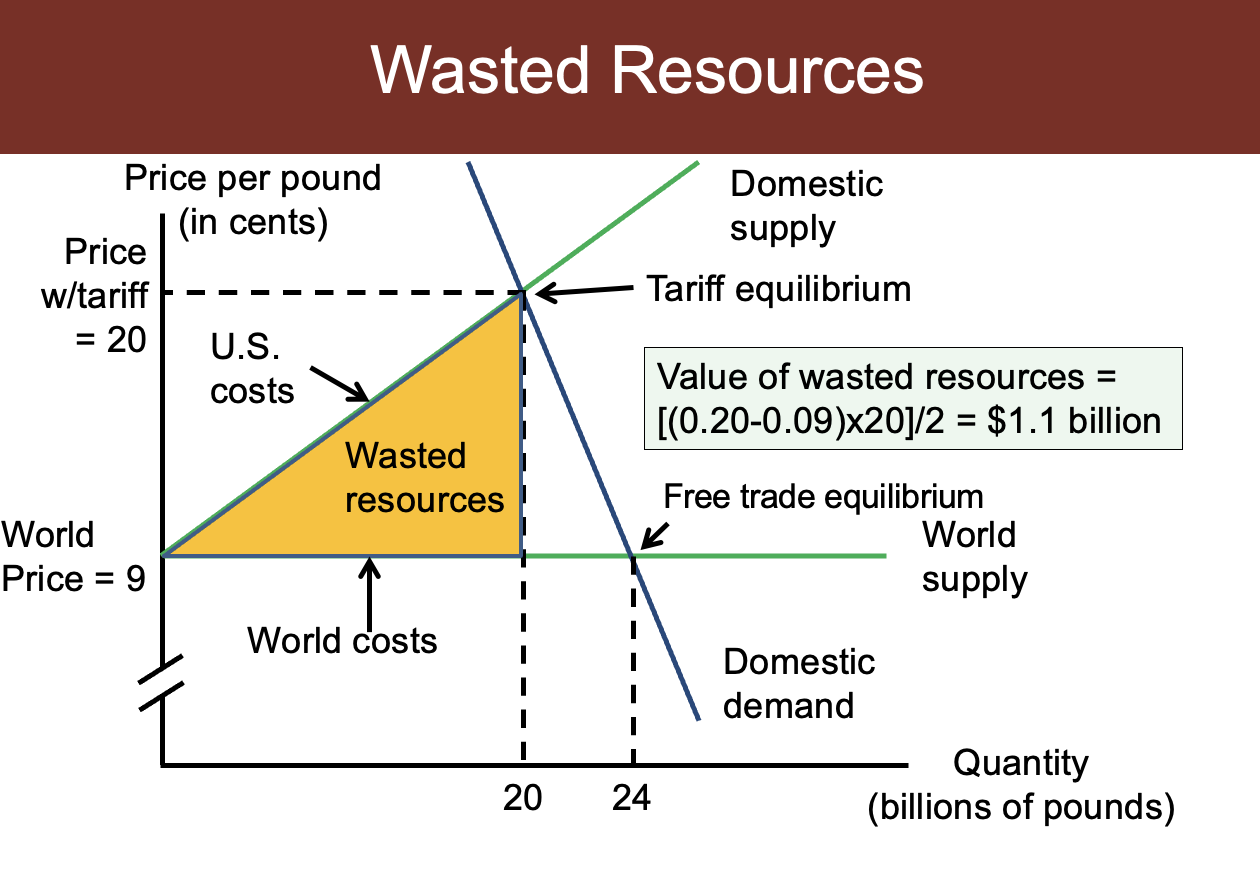
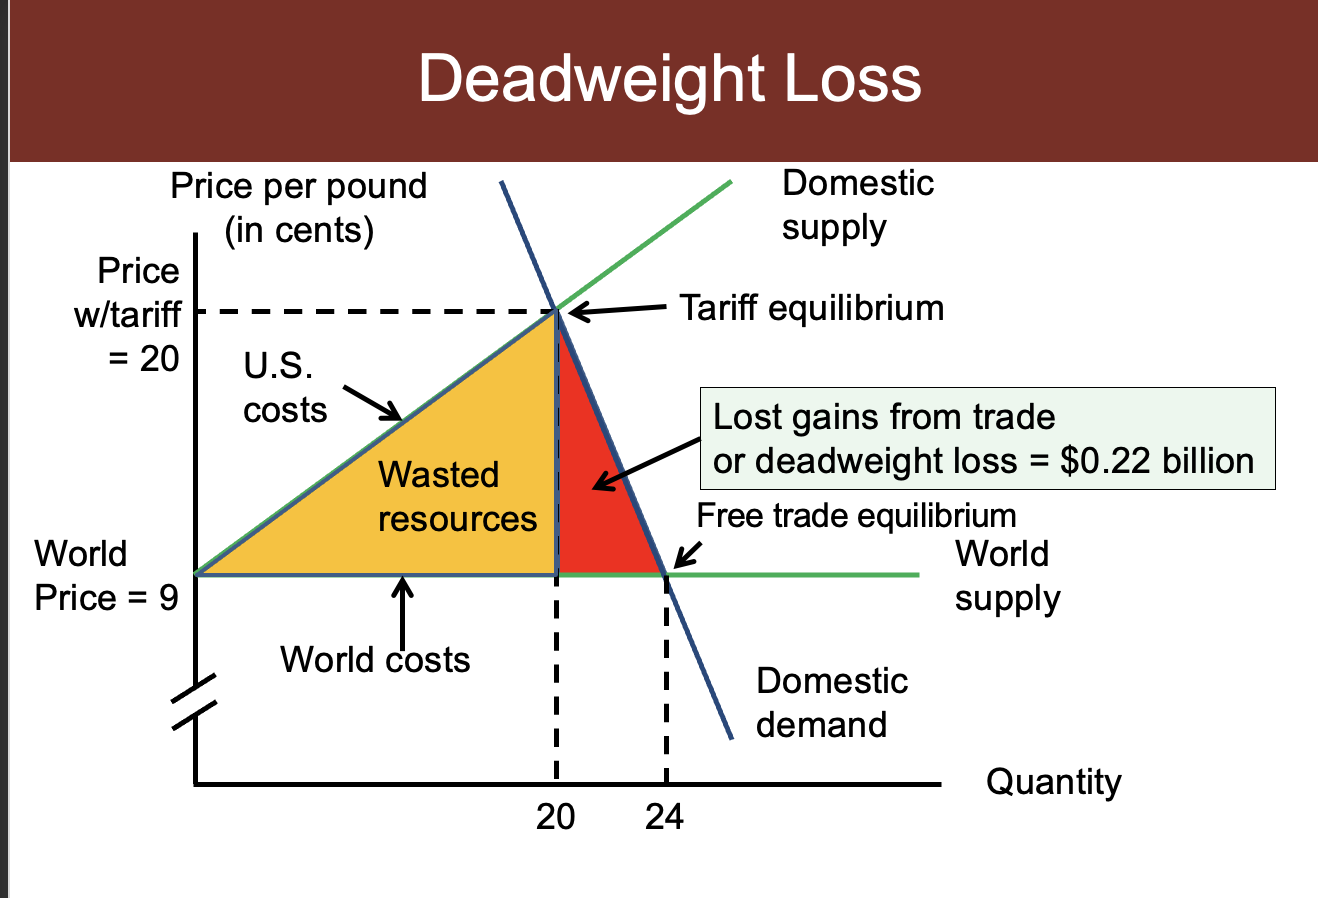
Wasted Resources
Deadweight Loss
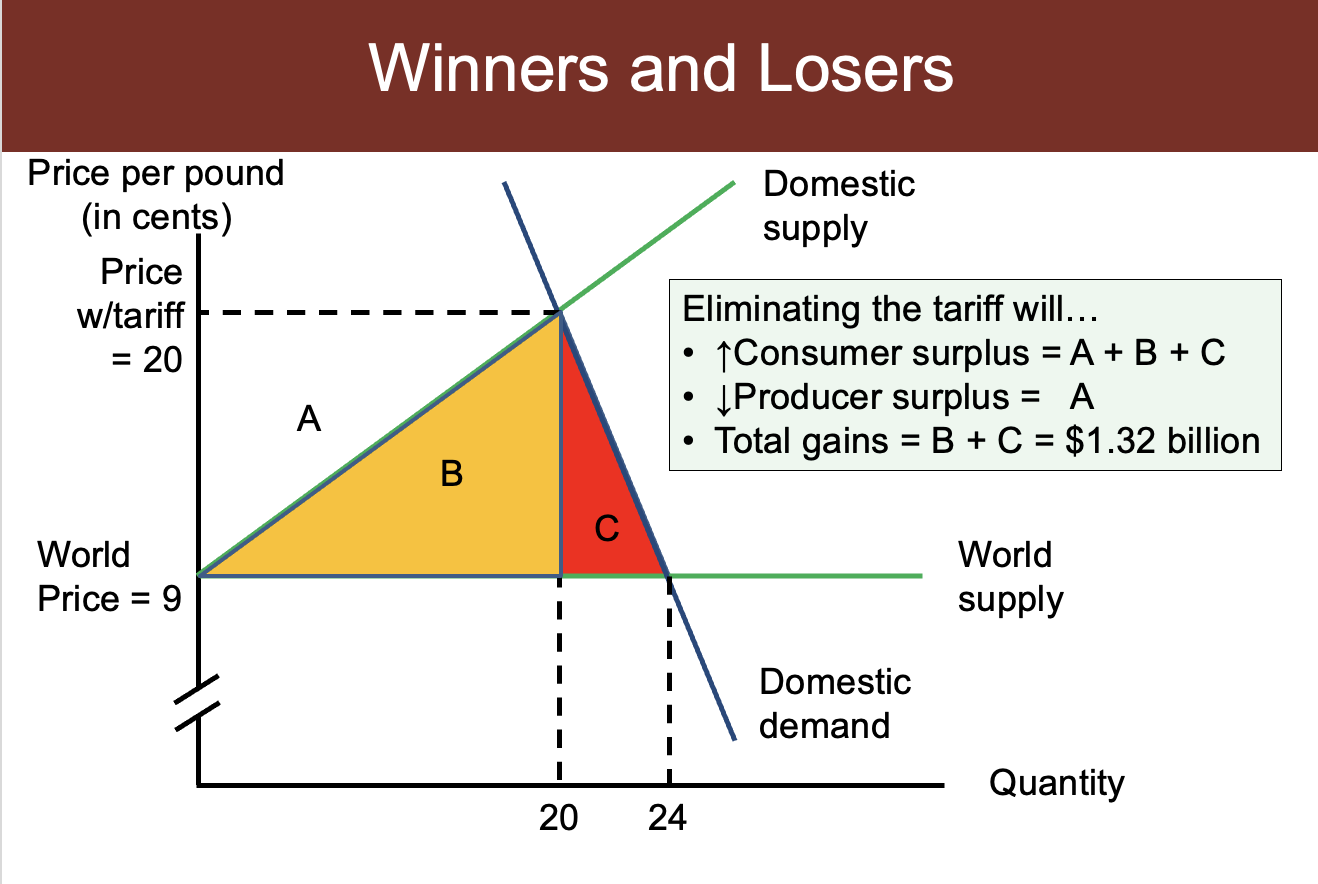
Winner and Losers
Child labor
The real cause of child labor is poverty, not trade
Chapter 20 - International Finance
Trade deficit - the value of a country’s imports exceeds the value of its exports
Trade surplus - the value of a country’s exports exceeds the value of its imports
Balance of Payments

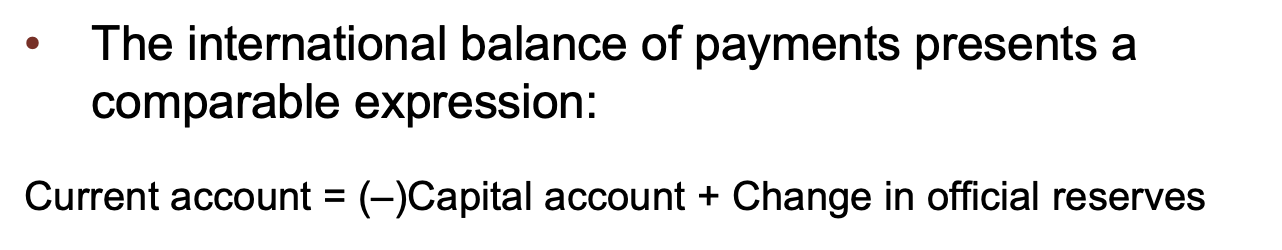
Current Account: measure transactions completed in the current period
- balance of trade (exports - improts of goods)
- net income on capital held abroad, including interest and dividends
net transfer payments, such as foreign aid
Capital Account: measures changes in foreign ownership of domestic assets
includes financial assets like stocks and bonds as well as physical assets
Capital account surplus: investment going into a country than coming out
includes foreign currencies, gold reserves, etc.
—
A trade deficit is typically balanced by a capital account surplus.
Two views:
- optimistic view focuses on capital account surplus
- investments would create more wealth and allow the US to pay off future obligations
- less optimistic: consume too much and save too little
- lower American living standards and bring higher taxes
=> BETTER to say: savings problem but not the trade restrictions
—
Exchange rates
Def.: the price of one currency in another currency
- An increase in the demand for a country’s exports tends to increase the value of its currency 出口越多,本国货币越值钱
- The more desirable a country is for foreign investment, the higher the value of that nation’s currency 这个国家越被投资者投资,这个国家货币越值钱
- Safe havens: demand can increase for foreign currency if local currency is deemed risky (civil war..)
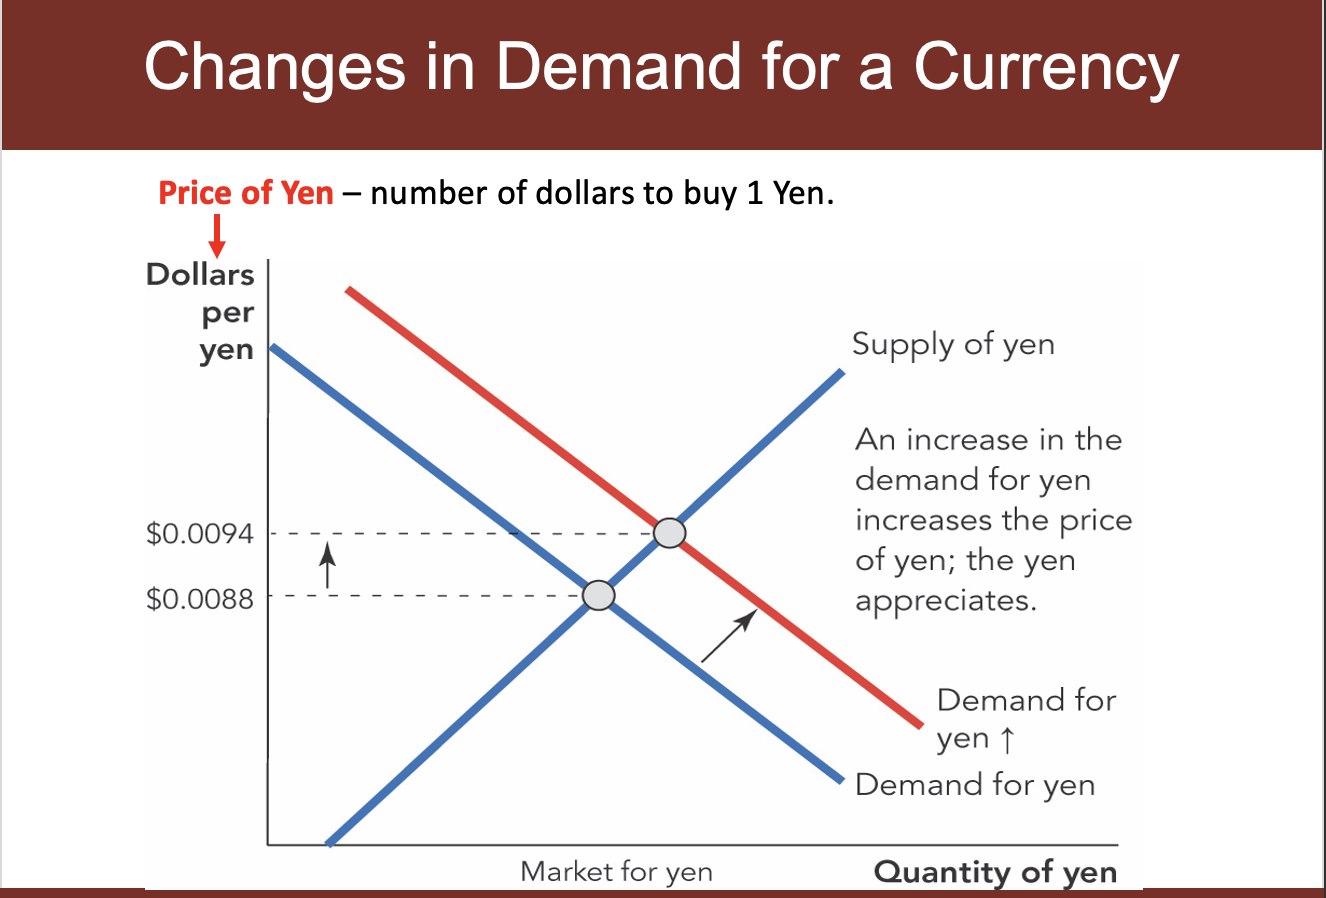
Appreciation:
An increase inthe price of one currency in terms of another currency, eg. When demand for Yen increase, Yen appreciates relatives to dollar
Depreciation:
Decrease.
Changes in Money Supply of a Currency
An increase in MS will causes the currency to lose value, or depreciate.
A tighter monetary policy will shift supply curve up and to the right and raise the value.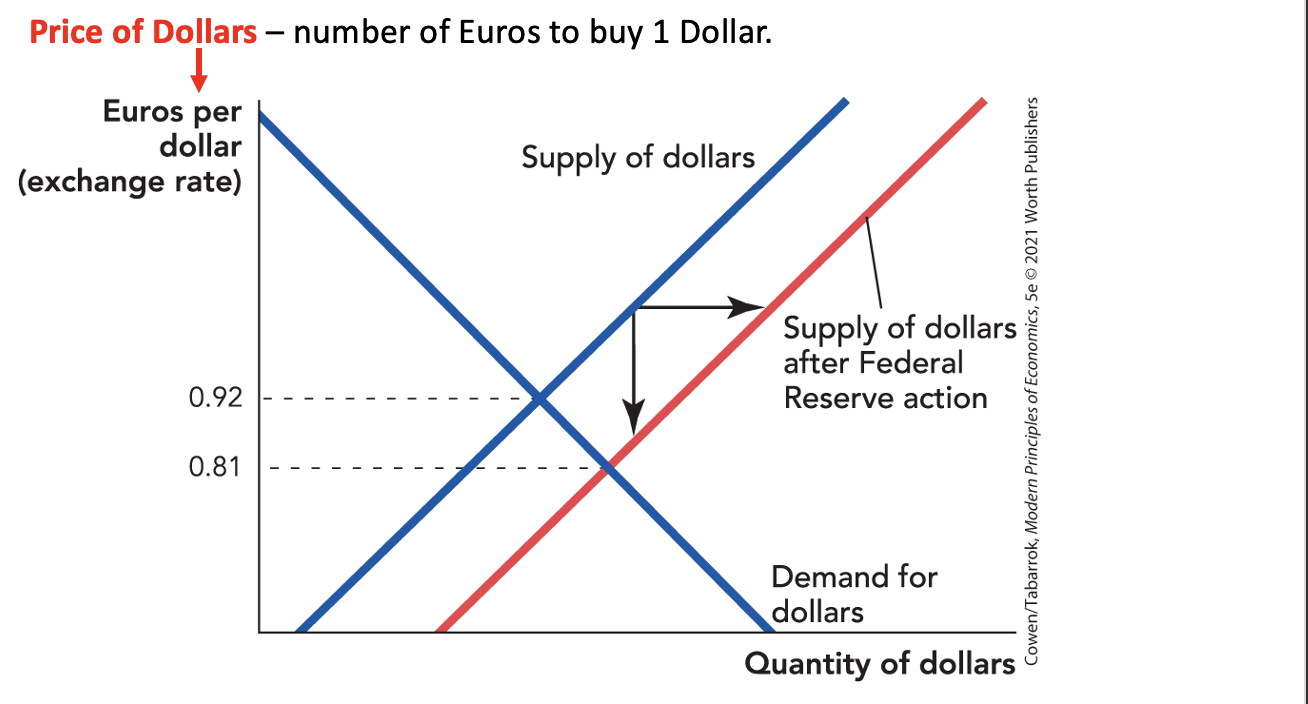
Nominal/Real Exchange Rates
Nominal exchange rate: the rate you exchange
Real exchange rate: the rate at which you can exchange the goods and services of one country for the goods and services of another.
Purchasing power parity (PPP) theorem:
货币购买力应该是相同的
Low of one price:
If trade were free, then identical goods should sell for about the same price throughout the world.
PPP is limited by:
- transportation costs
- some goods and services cannot be shipped
- Tarriffs and quotas
PPP also holds more tightly in the long run than in the short run.
Monetary Policy (related to Fed.)
Fed. buy bonds -> Demand for bonds increase -> Bond price increase -> interest rate decrease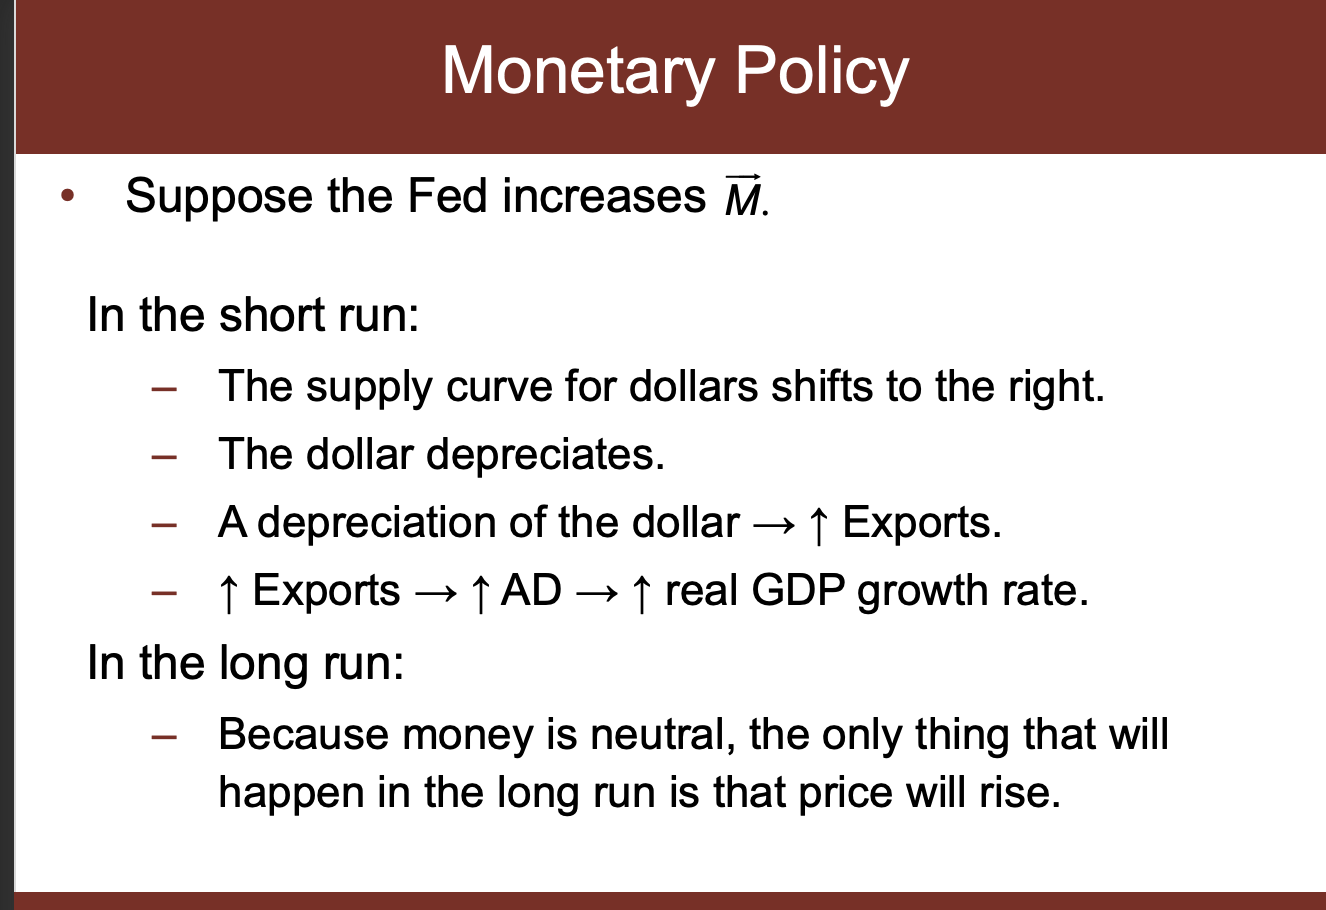
Fiscal Policy (related to Gov.)
Expansionary fiscal policy will raises domestic interest rates (because government will pays for greater spending by selling bonds, and shift demand of the bond to right in loanable funds market)
此处和Fed. 发钱不一样,Gov发钱直接导致Bond Supply 上升, 而Fed.上间接的,导致Bond demand上升
-> Then because of the policy, more foreigner will then want to invest in U.S.
-> greater demand to invest will cause an appreciation of the U.S. dollar, making exports more expensive
-> thus, a budget deficit can cause a trade deficit, which sometimes called “the twin deficits”
SUMMARY
- Both monetary and fiscal policies will affect the real exchange rate in the short run.
- In the long run, exchange rates are set according to purchasing power parity.
Chapter 11 - Unemployment and Labor Force Participation
Key Def.
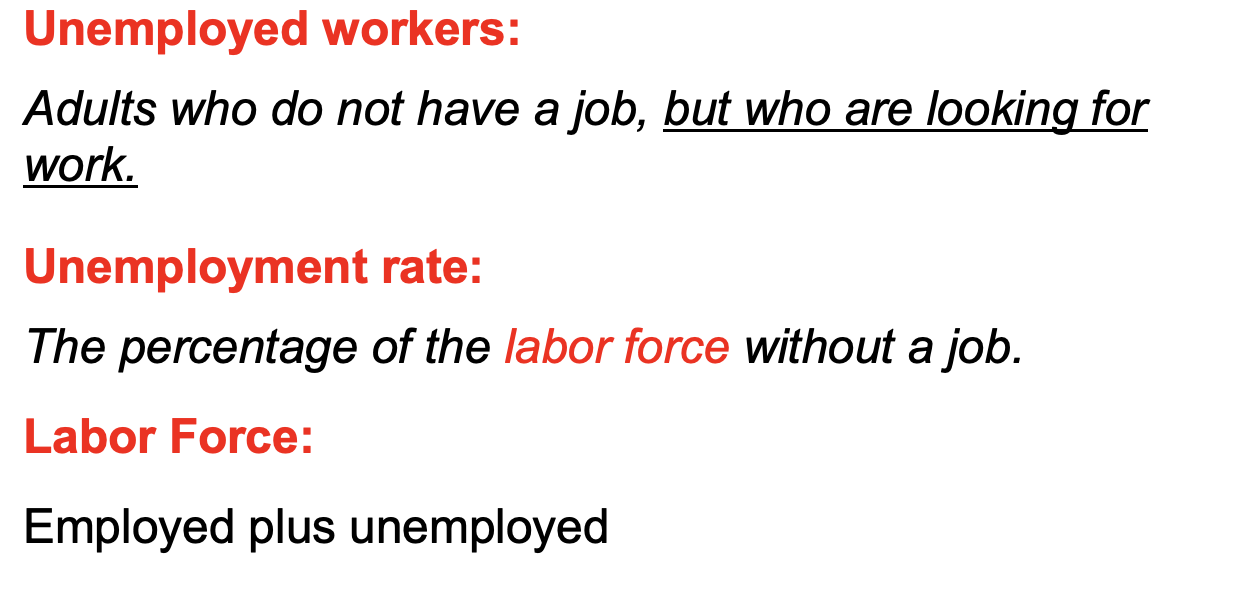
Unemployment
unemployment but willing to have a work, must meet following criteria:
- 16 years or older
- Not institutionalized (not in prison, etc.)
- a civilian(not in the army)
- looking for work
Unemployment also means that the economy is underforming
Frictional unemployment (slow with time)
short-term unemployment caused by the ordinary difficulties of matching employee to employer
- scarcity of information is one of the causes of frictional unemployment
- a large share of total unemployment cuz US econ is dynamic
Structural unemployment (slow with time)
persistent, long-term unemployment caused by long-lasting shocks or permanent features of an economy that make it more difficult for some workers to find job.
Cyclical unemployment (change dramatically)
unemployment correclated with the business cycle
- increase when: GDP fall, firms often lay off workers, which increase unemployment
- Idle label and idle capital hurt the econ’s ability to create more jobs
Natural unemployment rate
Structural + Frictional unemployment
—- END OF ECON 102 Fall 2021 —-

若有收获,就点个赞吧
0 人点赞
