Week 1
LEC 1 Introduction to Geospatial Technology
- Geographic Information System (GIS): a computer-based geospatial technology for storage, analysis, and management of location-based data.
- Remote Sensing (RS): a technology that is used to acquire imagery of the earth’s surface through the use of satellites or aircraft. The data collected by satellite devices are typically called satellite imagery, and data acquired by devices on aircraft are called aerial photos.
- Global Positioning System (GPS): a technology that acquires real-time location information from a series of satellites in Earth’s orbit.
Geospatial Technology applied in: Archeology, Environmental Monitoring, Forestry, Public health, Real Estate
Geography is not just “where things are” but the study of “why things are where they are.” Geography deals with the spatial characteristics of our planet and the spatial relationships and interactions of the people and features that populate it. The notion of “Geographic Information Science” has been acclaimed for years as the study of multiple concepts that surround the handling of spatial data, and today the use of geospatial technologies is tightly interwoven with the discipline of geography.
LEC 2 Geographic Information and Representation
Scientific method to approach the outside world includes four processes: obtain direct observations, decode observations to data, convert data to information, and generate knowledge from all kinds of information2.
Geographic Information: Location (43 N, 89 W), Time (12:oo pm on Sep. 7, 2020), Attribute (66 degrees Fahrenheit)
geographic attributes are specific statistics tied to geographic location. Examples include:
- Population density
- Tax rates
- Health data (e.g., lung cancer rate)
- Temperature, Air pressure
- Geographic vs. Spatial Information
Although sometimes ‘geographic’ and ‘spatial’ are used interchangeably, geographic information is technically different than spatial information.
- “Geographic” has to do with the Earth, its two-dimensional surface, or its three-dimensional atmosphere, oceans and sub-surface: An example of geographic data includes the depth of the frost line soil during the winter. The depth of the frost line is specifically in reference to the earth’s surface. Another example of geographic data is the altitude of planes in the atmosphere. The height of the plane in the atmosphere is in relation to the earth’s surface (sea level).
- “Spatial” has to do with any multi-dimensional frame of reference: Medical images referenced to the human body; Engineering drawings referenced to a mechanical object; Architectural drawings referenced to a building
Therefore, ‘geographic’ is a subset of ‘spatial’. All geographic (and spatial) information has an explicitly defined ‘where”.
- Map types
- Reference maps: depict locations -> Road maps, Google maps, Bing Map(_colorful, Cities are named, major transport routes: high way, Natural features: rivers, lakes…)_
- Thematic maps: depict spatially-referenced variables of interest ->Weather, population density, and geology maps
- Navigational maps: depict paths and routes -> Nautical charts, Aeronautical charts
- Persuasive maps: present a graphical argument
LEC 3-1 Geodetics and Geomatics
1. Coordinate Systems
Convert DMS to DD would be: D + M/60 + S/3600
Latitude: Latitude is the angular distance between the Equator and points to the north or south on the surface of the Earth
Longitude: Lines of longitude, called meridians, run perpendicular to lines of latitude, and all pass through both poles.
15 degrees of longitude = 1 hour time difference
Great circles and aviation: **the shortest distance between the two locations. It is formed by a plane slicing the Earth through the two points (Los Angeles and London) and through the center of the Earth.
2.ellipsoid: a mathematical figure approximating the shape of Earth where the major axis a (the equator) is larger than the minor axis b (the N-S pole)
3. Geodetic Datums: **reference base **
a reference base that defines the size and shape of the Earth in order to locate positions and places.
Datum is a reference surface or model of Earth
use something called a geodetic datum as a reference baseline for positions and mapping
Defined by: the ellipsoid, the coordinates of a base point, the direction north
4. Vertical Datums and Geoid 重力势, 海平面
geoid: a vertical datum and a hypothetical Earth surface that represents the mean sea level, assuming Earth’s surface is completely covered by water.
One of the most commonly used vertical datum is the Geoid. The geoid is a hypothetical Earth surface that represents the mean sea level (MSL). The MSL is often determined by averaging the level of water at a tide gauge over time.
LEC 3-2 Map Projections
Tissot’s Indicatrix: to show the degree of distortions
Categories of Map Projections
Projections classified by surface**
- Cylindrical 圆柱投影, 圆筒的切线处是最小失真处
- Conical 圆锥投影
- Conic projections are used in the U.S. and other large countries with a territory that stretches more in the east-west direction than in the north-south direction.
- Good for polor regions and aeronautical maps because it shows latitude in the form of a circle
- NOT Good for large areas
- Planer (Azimuthal) 平面投影
- Polar planar projection - the focus is located at one of the poles
- Equatorial planar projection - the focus is located at any point along the equator
- Oblique planar projection - the focus is located at neither a pole nor along the equator
- Gnomonic projection: “light source” at the Earth’s center (Figure 10b)
- Stereographic projection: “light source” located opposite the focus (Figure 10c)
- Orthographic projection: “light source” from an infinite distance away, also known as the “view from space” (Figure 10d)
Projections classified by geometric distortion:
- Conformal: preserves shape( angles are preserved)
- Equivalent: preserves _area: _Sinusoidal projections are often used in countries whose territory extends further in the north-south direction than the east-west direction.
- Equidistant: preserves distance
- Azimuthal or Zenithal: preserves direction: Distances measured from the center are true. Distortion of other properties increases away from the center point. 从极点看
- Azimuthal projections are used in applications where maintaining directional relationships are important, such as aeronautical and sea navigation charts
- Compromise: does not preserve area, shape, distance, or direction but minimizes distortion for all of these
- Robinson projection: Minimizes distortions
Conformal projections are typically used in:
- Topographic maps and cadastral (land parcel) maps
- Navigation charts (for plotting course bearings and wind direction)
- Civil engineering maps
- Military maps
- Weather maps (for showing the local direction in which weather systems are moving)
Use equal-area projections to show:
- Population density maps where the area should be preserved
- The spatial extent of a categorical feature (for example, land use maps)
- Quantitative attributes by area (for example, Gross Domestic Product by country)
- World political maps
A good projection minimizes distortion in your area of interest, for example:
- To map tropical regions, use a cylindrical projection
- To map the middle latitudes, use a conic projection
- To map a polar region, use an azimuthal projection
LEC 4-1 Coordinate System
UTM(Universal Transverse Mercator)
a two-dimensional cartesian coordinate system that records locations on the surface of the Earth. It divides the Earth into 60 zones, with each covering a six-degree band of longitude. It uses a secant transverse Mercator projection in each zone.
Format:
- The first six-digit integer is the easting x-coordinate in meters
- The second seven-digit integer is the northing y-coordinate in meters
- The third value is the zone number and hemisphere
For example, 305,900m E, 4,771,650m N, Zone 16 North
Limitations:
- Suitable for medium-scale mapping but not national-level
- Designed for areas with N-S extent, and thus not good for areas with a large E-W extent (good for areas that are taller than they are wide)
- Distortions are relatively small, but still may be too large for specific purposes like high-accuracy surveying.
- Distortions become especially problematic at high latitudes; this is part of why Canada, with giant swaths of Arctic territory, uses a Lambert Conformal Conic projection suited for mid- to high latitudes
- UTM coordinates will differ when different datums are used
- Zone boundaries follow meridians instead of political or natural boundaries. Thus, it usually takes more than one UTM zone to cover a state or country completely. For example, Wisconsin falls into Zones 15 and 16
SPC(St**ate Plane Coordinate**)
a set of 124 geographic zones or coordinate systems designed for specific regions of the U.S. Each state contains one or more state plane zones, the boundaries of which usually follow county lines.
- Lambert conformal conic projection is used for states of predominantly east-west extent. For example, Colorado is a Lambert state with three zones.
- Transverse Mercator projection is used for states of predominately north-source extent, such as Arizona and New Mexico.
For example, 2,164,600 ft E, 392,280 ft N, Wisconsin, south zone.
LEC 4-2 Map Scale
- Scale bar: a map element used to graphically represent the scale of a map. A scale bar is typically a line or a bar, segmented like a ruler and marked in units proportional to the map’s scale
A small scale map shows a large area with few details.
A large scale map shows a small area with more details
Week 2
LEC 5-1 GPS Basics
- The first satellite in the system was launched in 1978. The twenty-fourth GPS satellite was launched in 1993. The system was declared fully operational in April, 1995.
- GPS components
- Space segment: constellation of satellites for broadcasting positioning signals
- signals includes: 1) the position of the satellite, and 2) the precise time at which the signal was transmitted from the satellite.
- positioned in medium earth orbit at an altitude of 20,200 km; travel at 3.87 km/sec; every 12 hours(twice a day)
- 24 satellites in 6 orbital planes with 4 in each plane.
- The inclination angle of the orbital planes with respect to the equator is 55.
- Control segment: a set of ground stations for monitoring, tracking, and correcting those signals.
- five ground stations including the master station: Colorado Springs (where the master control station is located), Kwajalein, Diego Garcia, Ascension Island, and Hawaii.
- User segment: receive signals, e.g. smart phones
- GPS receiver has a clock and a processor to “decode” the satellite’s signals
- Space segment: constellation of satellites for broadcasting positioning signals
- GPS positioning
- Satellites send signals containing location and time to the GPS receiver.
- The GPS receiver searches and obtains signals from at least three satellites. The more satellites it finds, the higher accuracy it can achieve.
- The GPS receiver a) calculates its distance to the satellites, and b) determines its location using the method of trilateration.
Distance = time delay speed of light
e.g. Distance = t c = 3 x 180,000 miles per second = 540,000 miles
Trilateration:
In order to perform Trilateration, signals from at least 3 satellites are required.
However this only gives you the horizontal location of a point on the Earth’s surface, and this is called a 2D fix. Most of the time, a fourth satellite is used to improve the accuracy and help to provide a 3D fix, which includes elevation(vertical).
- Errors and Limitations of GPS
Satellite clocks - 1.5 to 3.6 meters
Atmospheric conditions (Ionosphere 电离层) - 5 to 7 meters
Atomospheric conditions (Troposphere 对流层) - 0.5 to 0.7 meters
Multipath - 0.6 to 1.2 meters
- Multi-path is the greatest source of error in **forests lands** and is the most difficult to combat- topography (hills and valleys), tall buildings, vehicles, cliffs, tree canopies, and other structures that obstruct the line of sight between the receiver and the satellites.
Selective Availability - elaminated by May 2000
- When SA was active, civilian GPS receivers could only get position accuracy within 100 meters.
Typically with an ordinary civilian receiver, like your smart phone, the accuracy of GPS would be about 15 meters (or less) in the horizontal direction.
- Minimize errors
- Differential GPS (DGPS): Reference station ——-ERROR CORRECTIONS————-> Navigator
- receiver is picking up the usual four satellite signals plus an additional correction from a nearby base station
LEC 5-2 GPS Application
GPS has five basic functions: navigation, location, timing, mapping, and tracking
Atomic clock 原子钟: a timekeeping device that uses an atom’s electronic transition frequency in the microwave, optical, or ultraviolet region of the electromagnetic spectrum as a frequency standard for its timekeeping element.
LEC 6-1 Aerial Photography
Photos are taken along straight flight lines with 60% to 80% overlap, that is each individual photo overlaps its neighbor by 60-80%.
Typically more than one flight line is required to cover the area to be mapped, and adjacent flight lines get a 20%-30% side overlap to ensure no gaps in the coverage.
Mosaicking: merge individual images into a large-scale aerial photo._
Aerial Photograph Categories
- based on photo color
- Panchromatic photo: meaning “all-colors”, capture electromagnetic energy in the 300 to 700 micrometer (nm) wavelength, including all visible portions of light. Grayscale (that is, they are black and white aerial photos) 灰色照片
- True color photo: similar to the photos you take with camera or phone. capture three major wavelength of visible light - red, green, and blue; red -> red, green -> green, and blue -> blue.
- Color infrared (CIR) photo (false color image): NIR -> red, green -> blue, red - > green; The use of near-infrared energy helps to highlight vegetation
comparison:
Color infrared photos (CIR): Red tones in color infrared aerial photographs are always associated with live vegetation and the lightness or intensity of the red color can tell you a lot about the vegetation itself. Dead vegetation will appear as various shades of tan, while vivid, healthy green canopies appear bright red. Color infrared photographs are typically used to help differentiate vegetation types
Panchromatic photographs are sensitive to light of all visible colors. They generally reflect how bright the surface is. Therefore, healthy deciduous(落叶) vegetation is typically light (nearly white), roads are dark, and water bodies are usually black.
- based on photo geometry
- Vertical aerial photo
- Oblique aerial photo
- low oblique: detailed; low-altitude aerial photos; from 300-1,000 feet above the ground, at a 5-30 degree angle
- hight oblique: image scale is much smaller; from 8,000-13,000 feet above the ground from an airplane, at a 30-60 degree angle
- Orthophotos
- Relief displacement: On vertical air photos, a tendency to “bend” outward from the center point toward the edges of the photo - this effect is called relief displacement. The geometric center of the photo is called THE principal point.
- Orthophotos are vertical aerial photographs which have been geometrically “corrected”; An orthophoto is a uniform-scale photograph; An orthophoto can also serve as a base map onto which other map information can be overlaid.
NOTES: Orthophotos and some satellite imageries have been geometrically “corrected”, and therefore have uniform scales. However, while you may be able to see roads on these image, they are not labeled as roads. You must interpret what you see on an image because it is not labeled for you. Therefore, they are NOT maps.
LEC 6-2 Image Interpretation
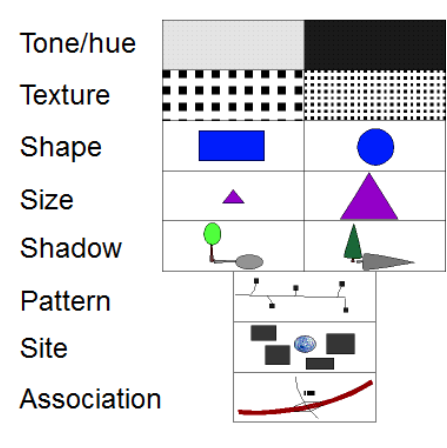
Tone/Color: In black and white near-infrared images, water is black and healthy vegetation is white to light gray.
Example:
- Houses: pattern (regularly-spaced), association 房屋: 格局(有规律的间隔) ,联想
- Walkways leading to houses: size, shape and association 通往住宅的人行道: 大小、形状和联系
- Cars in parking lot: pattern, shape, association 停车场车辆: 模式、形状、联想
- Parking spaces in parking lot: association, shape 停车场停车位: 组合、形状
- Factory building on west side of photo: size (large buildings), association (large parking lot) 厂房西侧照片: 大小(大型建筑物) ,协会(大型停车场)
- Trees: shape, texture, shadow 树木: 形状,纹理,阴影
LEC 7-1 Satellite Remote Sensing Fundamentals
Orbit types**: geostationary orbit, polar orbit, and sun-synchronous orbit.
The advantages of remote sensing:
- It is capable of rapidly acquiring up-to-date information over a large geographical area.
- It provides frequent and repetitive looks of the same area.
- It is cheap with less labor input.
- It provides data from remote and inaccessible regions, like deep inside deserts.
- The observations of remote sensing are objective.
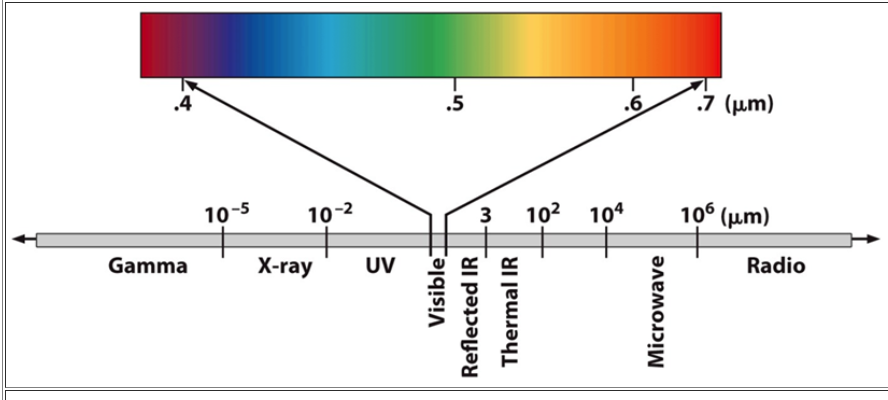
Near IR radiation: Near IR is particularly sensitive to green vegetation. Green leaves reflect most of the near infrared radiation they receive from the sun. Therefore, most remote sensors on satellites can measure near infrared radiation, which lets them monitor the health of forests, crops, and other vegetation.
The thermal/far IR: “ Objects that have a temperature above absolute zero (-273 C) emit far IR radiation. Therefore, all features in the landscape, such as vegetation, soil, rock, water, and people, emit thermal infrared radiation. In this way, remote sensing can detect forest fires, snow, and urban areas by measuring their heat.
Microwave: In remote sensing, microwave radiation is used to measure water and ozone content in the atmosphere, to sense soil moisture, and to map sea ice and pollutants such as oil slicks.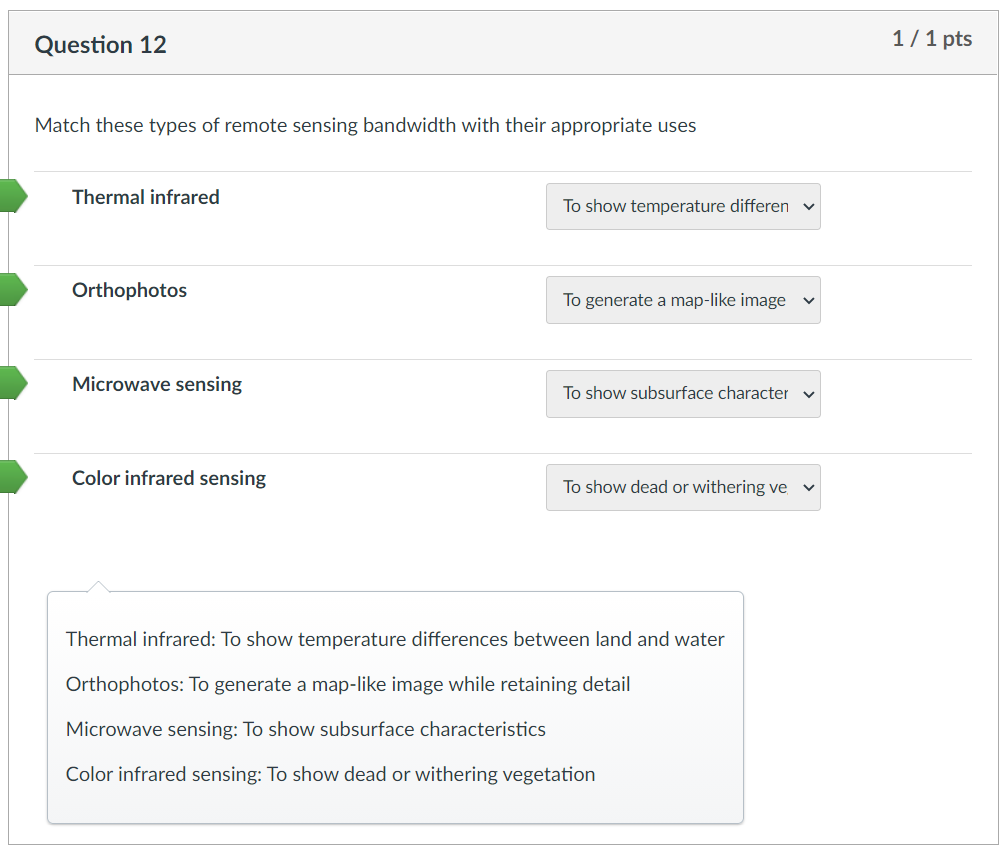
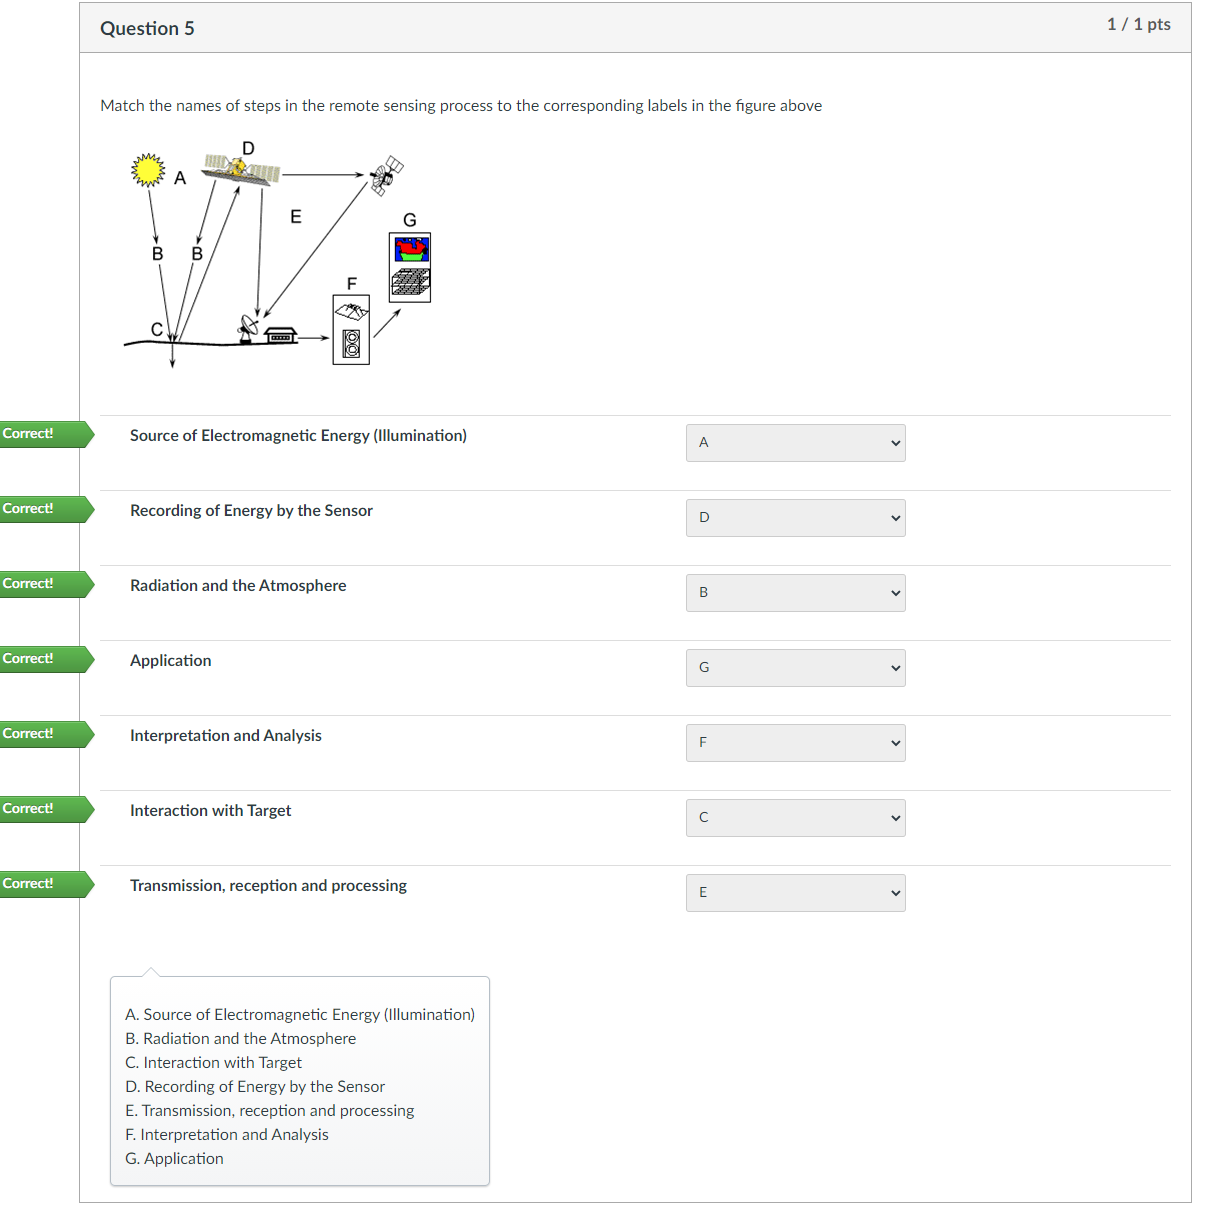
Interaction with Target: transmittance, absorption, reflection
e.g.
Trees:
A chemical compound in leaves called chlorophyll strongly absorbs radiation in the red and blue wavelengths of visible light, but reflects green wavelengths. Hence leaves appear “greenest” in the summer, when chlorophyll content is at its maximum. In fall, there is less chlorophyll in the leaves, so there is less absorption and more reflection of the red wavelengths, making the leaves appear red or yellow (yellow is a combination of red and green wavelengths).
Near infrared wavelengths also interact with leaves. The cell structure of healthy leaves enhances the reflection of near infrared radiation. Green and infrared energy is reflected by leaves, while the red and blue energy is absorbed.
Water:
Water always looks dark in remote sensing images. Longer wavelength (i.e. red and infrared) radiation is absorbed more by water than shorter visible wavelengths. Thus water typically looks blue or blue-green due to stronger reflectance at these short wavelengths, and darker if viewed at red or near infrared wavelengths.
Spectral signature 光谱特征: the properties of an object as described by its absorption and reflection properties at different wavelengths. Vegetaion reflects most of the near infrared radiation.
A typical color composite: (like in near infrared aerial photos) is to display the near infrared band in the red channel, the green band in the blue channel, and the red band in the green channel.
LEC 7-2 Remote Sensing Application
Resolution:
- Spatial resolution
- Temporal resolution: Temporal resolution is the revisit period of a satellite sensor for a specific location
Spectral resolution 光谱分辨率
- High spectral resolution: ~200 bands
- Medium spectral resolution: 3~15 bands
Low spectral resolution: ~3 bands
Panchromatic sensor: a sensor measuring the visible portion of the spectrum and treating the entire 0.4 to 0.7 micrometer range as a single band.
- Multi spectral sensor: a sensor that measures several broad bands. For example, we can divide the visible and near-infrared portions of the spectrum into four bands: blue, green, red and a near-infrared band.
- Hyperspectral sensor: a sensor that measures many narrow contiguous bands. A hyperspectral sensor can sense over 200 bands.
Trade-off: 不能占完所有的优点
Week 3
LEC 8-1 Intro to GIS
Geospatial technologies include three major components: GPS, RS, and GIS.
GPS: A system of satellites which can provide precise (100 meter to sub-centimeter) locations on the earth’s surface.
RS: Use of satellites or aircraft to capture information about Earth’s surface.
GIS: Software systems with the capability for input, storage, manipulation/analysis, and output/display of geographic (spatial) information.
- GIS: emphasizes technology and tools for the management and analysis of spatial information.
- GIScience: a new interdisciplinary field built around the use and theory of GIS, which studies the underlying conceptual and fundamental issues arising from the use of GIS and related technologies, such as: spatial analysis, map projections, accuracy, and scientific visualization.
- GIStudies: understand the social, legal and ethical issues associated with the application of GI Systems and GI Science.
GIS is built upon knowledge from geography, cartography, computer science, and mathematics
GIS Components: A GIS has six components: hardware, software, procedures, data, people, and network.
At the very center of this diagram is the NETWORK
Finally, a GIS is useless without the PEOPLE who design, program, maintain, and use it.
Among the six components of a GIS, which do you think is the most expensive? It’s data**.
GIS Workflow
First, we collect and edit spatial data.
Second, we visualize/display the data and perform spatial/statistical analysis to understand phenomena and patterns.
Third, we design and produce maps as reported results for decision makers.
The decisions made will produce effects in the real world. Therefore we collect the feedback and restart the loop to further improve our decisions and policies.
LEC 8-2 Geospatial Data
Geospatial Data:
- Spatial data: Spatial data indicates the location of geographic features, which is usually expressed with geographic coordinates.
- Attribute data(non-spatial data): describes the properties of geographic features. Examples are statistics, text, images, sound, etc., all of which can serve as descriptive information to tell us what a feature is
Spatial data:
- vector data model: with Points, Lines and Polygons;
- discrete data: locations of restaurants, streets, and house parcels
- raster data model: by evenly spaced grid cells (or pixels);
- aerial photos and remote sensing images are raster data.
- continuous data: elevation, air temperature, population.
- attribute table: a table to store attribute data, where each row represents a feature and each column represents a different attribute of the feature
Week 4
LEC 12 Thematic Maps I - Qualitative and Quantitative Data
Geospatial Data
- Based on how the data is organized in digital format
- vector or raster data
- we typically use the vector data model to represent discrete data, such as locations of restaurants, streets, and house parcels, and use the raster data model to represent continuous data,
- vector or raster data
- Based on what kind of geographic phenomena the data represents:
- countinuous or discrete data:
- Discrete data represents discrete phenomena with distinct boundaries. A district, houses, towns, agricultural fields, rivers, highways are good examples of discrete phenomena;
- Continuous data represent continuous phenomena which have no defined borders, but a smooth transition from one value to another.Examples of continuous surfaces are elevation, aspect, slope, the radiation levels from a nuclear plant, and the salt concentration from a salt marsh as it moves inland.
- point, line, area, or volume data
- countinuous or discrete data:
- Based on how the data defines or describes the geographic phenomena
- qualitative(expressed by means of a natural language description)
- Examples include land cover types, soil types, language and religion, and major in college.
- quantitative data
- Such data can be quantified and verified. Examples include population density and annual rainfall. Figure 3 shows the percent of population in poverty of each county in the U.S., which is expressed as a quantity.
- qualitative(expressed by means of a natural language description)
Based on levels of measurement
- nominal (qualitative 定性) 名义上的, gender, religion. college major, sport number
- ordinal (quantitative 数量的) 比大小
- interval (quantitative 数量的):
- has an arbitrary zero point
- ratio data (quantitative 数量的)
the zero point is not arbitrary. Therefore ratio-level data have all the properties of interval-level data, but in addition, it also has a natural zero value.
LEC 13 Thematic Maps I - Qualitative and Quantitative Data
LEC 14 Thematic Maps III - Qualitative and Quantitative Data
Visual variables:
size
pattern texture
color lightness 明度
color saturation 色彩饱和度, to show subtle visual variations

若有收获,就点个赞吧
0 人点赞
