Permetheus简介
prometheus server 是Prometheus组件中的核心部分,负责实现对监控数据的获取,存储以及查询。
exporter简单说是采集端,通过http服务的形式保留一个url地址,prometheus server通过访问该exporter提供的endpoint端点,即可获取到需要采集的监控数据。
AlertManager
在prometheus中,支持基于PromQL常见告警规则,如果满足定义的规则,则会产生一条告警信息,进入AlertManager进行处理。可以集成邮件,微信或者通过webhook自定义报警。
Pushgateway
由于Prometheus数据采集采用pull方式进行设置的,内置必须保证prometheus server和对应的exporter必须通信,当网络情况无法直接满足时,可以使用pushgateway来进行中转,可以通过pushgateway将内部网络数据主动push到gateway里面去,而prometheus采用pull方式拉取pushgateway中数据。
总结
prometheus负责从pushgateway和job在红采集数据,存储到后端storatge中,可以通过PromQL进行查询,推送alerts信息到AlertManager。AlertManager根据不同的路由规则进行报警通知。
Prometheus部署
官网下载官网
tar -zxf prometheus-2.35.0-rc0.linux-amd64.tar.gzmv prometheus-2.35.0-rc0.linux-amd64 /usr/local/prometheusmkdir /usr/local/prometheus/datacd /usr/local/prometheus./promtool check config prometheus.yml #拍错工具vim /usr/lib/systemd/system/prometheus.service #创建配置文件[Unit]Description=https : //prometheus.io[Service]Restart=on-failureExecStart=/usr/local/prometheus/prometheus \--storage.tsdb.path=/usr/local/prometheus/data \--config.file=/usr/local/prometheus/prometheus.yml[Install]WantedBy=multi-user.targetsystemctl start prometheussystemctl status prometheus或者netstat -ntlp #查看是否启动ntpdate pool.ntp.org #配置时间同步

Prometheus配置文件介绍
cd /usr/local/prometheusvim prometheus.yml
global: 全局配置文件
- scrape_interval: 15s #间隔采集
- evaluation_interval: 15s #抓取超时间隔
alerting: 报警模块
rule_file: 配置规则,用来根据规则推送报警信息
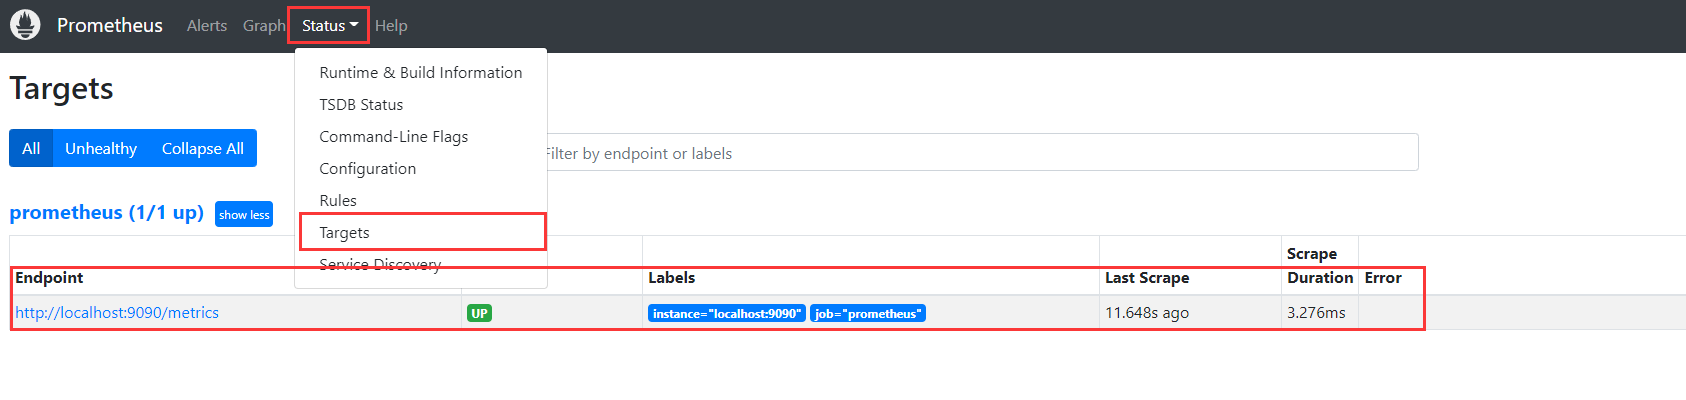
scrape_configs: 指定抓取配置,数据采集通过此片段配置
static_configs: 静态指定服务job
PromQL
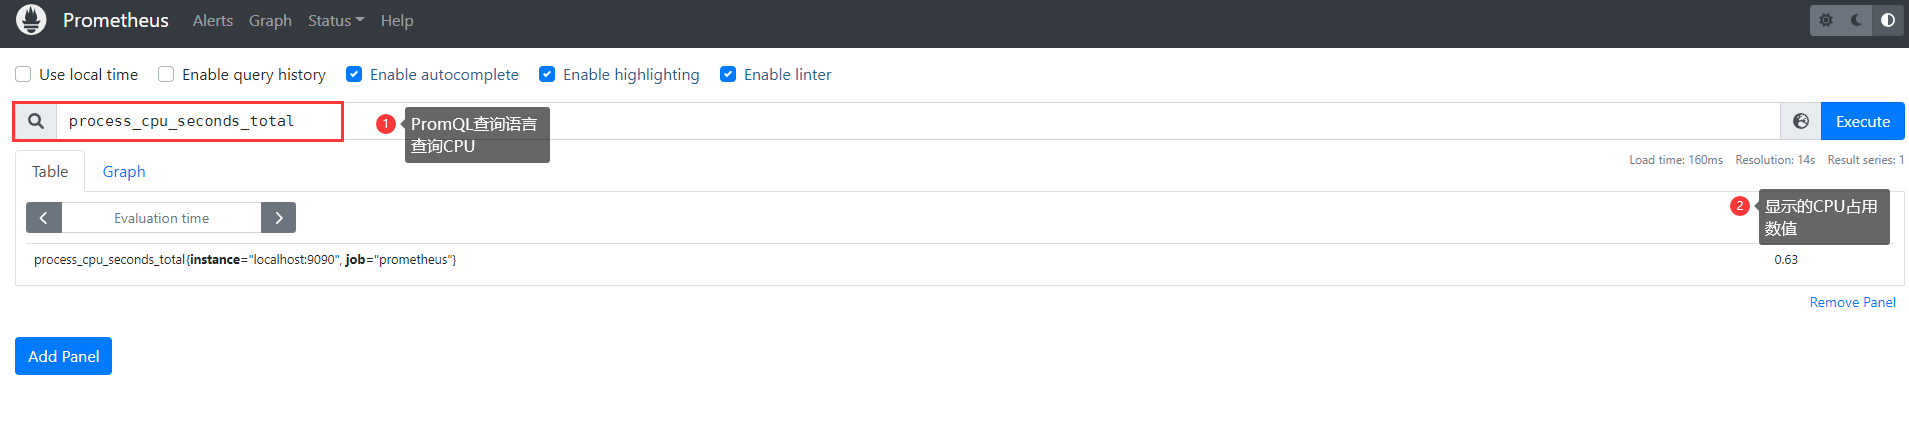
Prometheus提供了一种名为PromQL (Prometheus查询语言)的函数式查询语言,允许用户实时选择和聚合时间序列数据。表达式的结果既可以显示为图形,也可以在 Prometheus的表达式浏览器中作为表格数据查看,或者通过HTTP API由外部系统使用。
主机监控
搭建node节点
tar -zxf node_exporter-1.3.1.linux-amd64.tar.gzmv node_exporter-1.3.1.linux-amd64 /usr/local/node_exportervim /usr/lib/systemd/system/node_exporter.service[Unit]Description=Prometheus node_exporter[Service]User=nobodyExecStart=/usr/local/node_exporter/node_exporter --log.level=errorExecStop=/usr/bin/killall node_exporter[Install]WantedBy=default.targetsystemctl restart node_exporter
添加到prometheus监控中
vim /usr/local/prometheus/prometheus.yml# 额外添加- job_name: "host_monitor"static_configs:- targets: ["localhost:9100"]systemctl restart prometheus# 如果想要添加其他服务器的监控 可以通过上面配置添加 比如:- job_name: "node01"static_configs:- targets: ["192.168.218.133:9100"]# 本质上就是安装包后,会新开一个api接口,prometheus去对接接口就完成了监控。
此时就多一个节点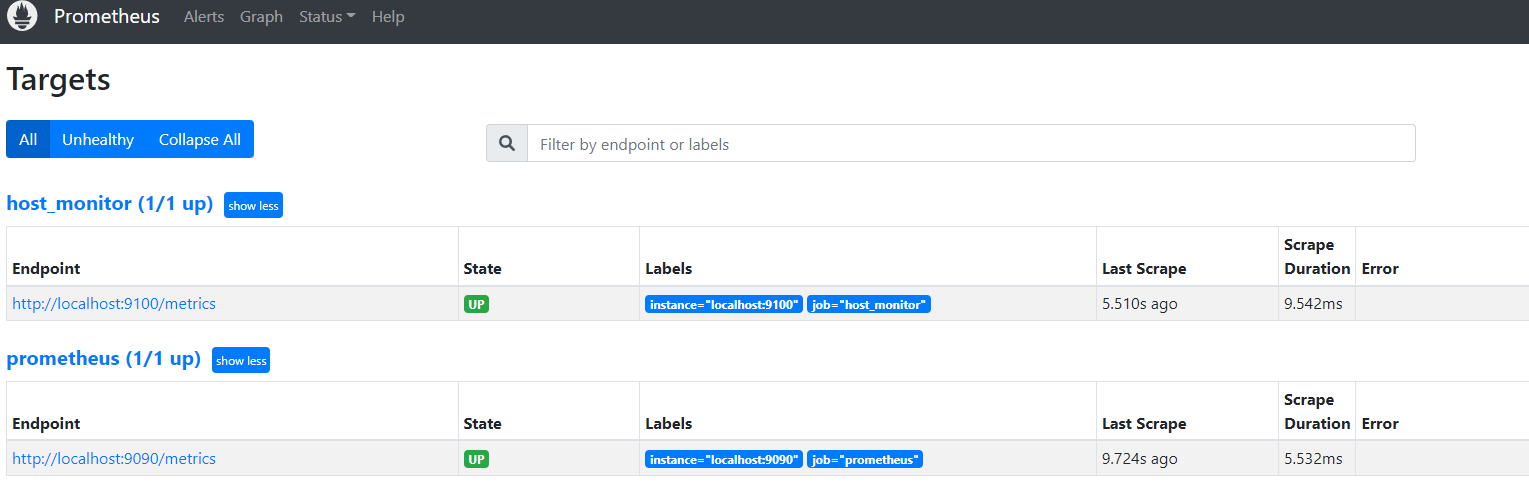
此时就显示了更多数据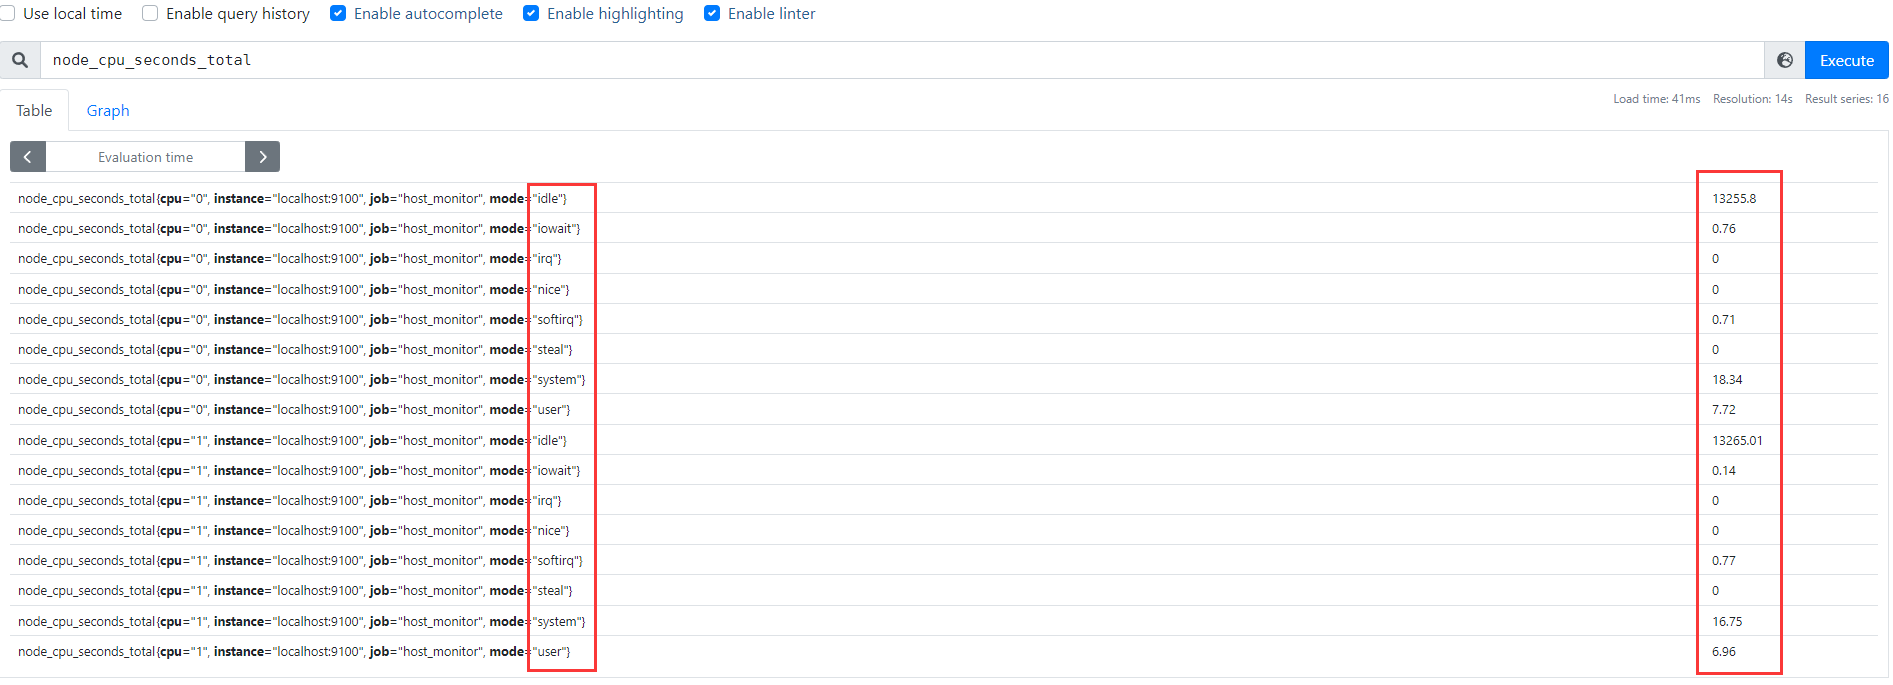
#带标签的查询node_cpu_seconds_total #查询全部node_cpu_seconds_total{mode="idle"} #单个标签查询node_cpu_seconds_total{mode="user",cpu="0"} #多个标签查询100 - (avg(irate(node_cpu_seconds_total{mode="idle"}[5m]))by (instance) * 100) #查询5分钟cpu的使用率100 - (node_memory_MemFree_bytes+node_memory_Cached_bytes+node_memory_Buffers_bytes) / node_memory_MemTotal_bytes * 100 #查看内存使用率100 - (((node_filesystem_size_bytes{fstype=~"xfs|ext4"}-node_filesystem_free_bytes{fstype=~"xfs|ext4"})/node_filesystem_size_bytes{fstype=~"xfs|ext4"}) * 100)#查看磁盘使用率
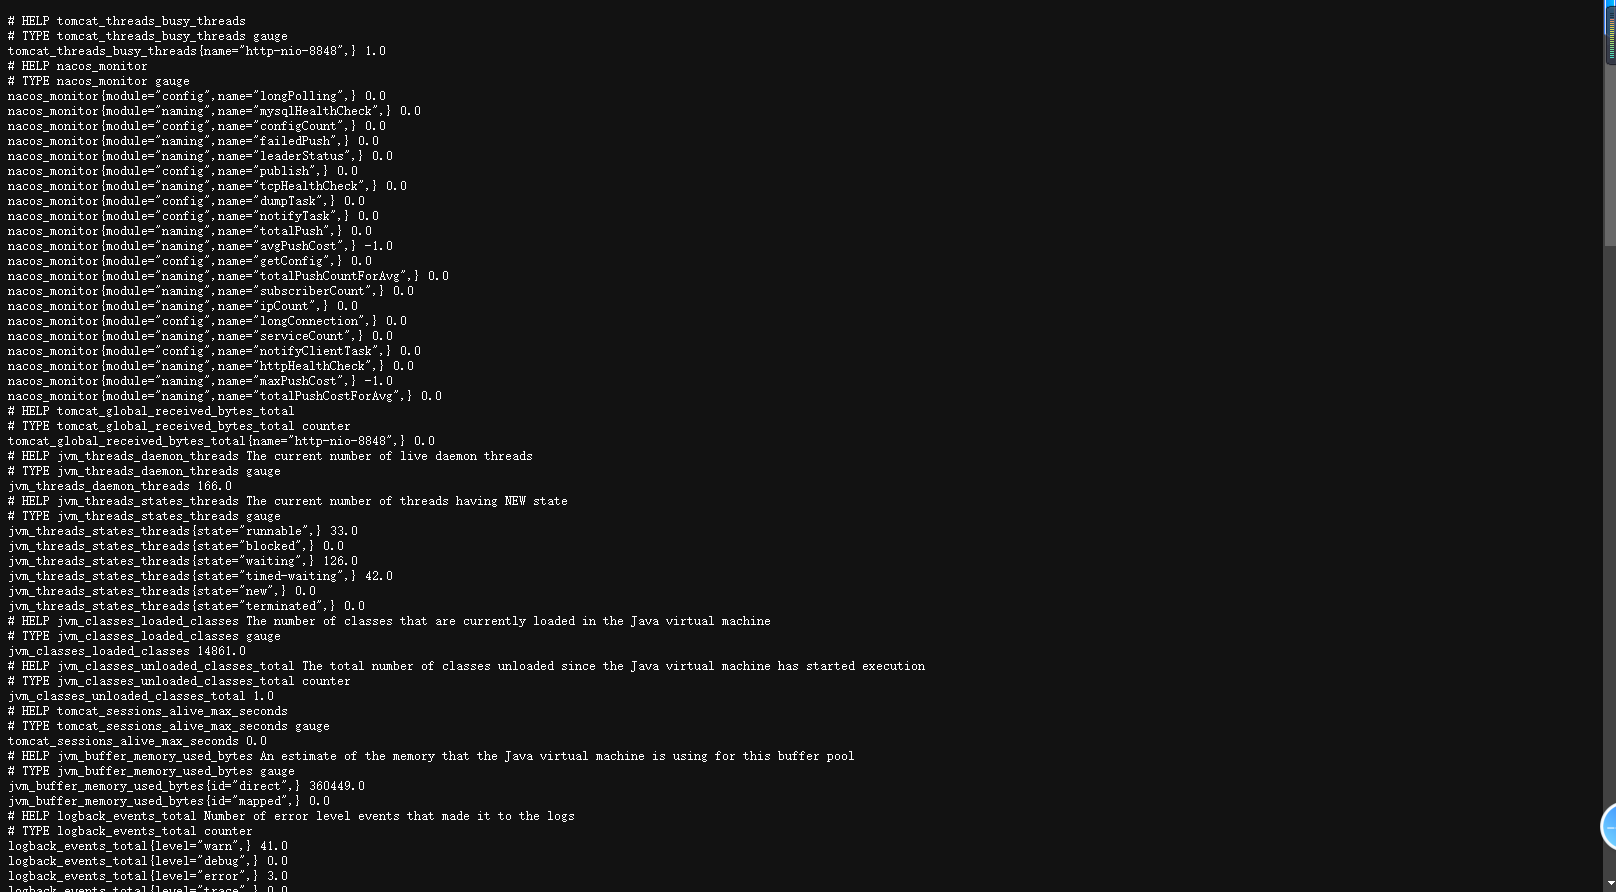
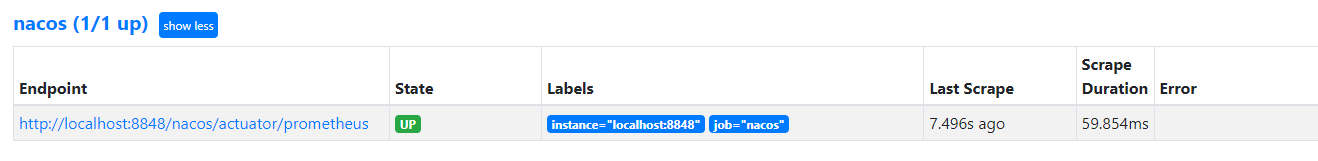
监控Nacos
# 暴露metrics数据vim conf/application.propertiesmanagement.endpoints.web.exposure.include=*# linux & macvim prometheus.yml- job_name: "nacos"metrics_path: '/nacos/actuator/prometheus' # nacos的metrics路径static_configs:- targets: ["localhost:8848"]

若有收获,就点个赞吧
0 人点赞
