简介
定期收集操作系统或应用服务的指标数据
存储到Elasticsearch中,进行实时分析
Metricbeat有2部分组成
一部分是Module,另一部分为Metricset。
- Module
收集的对象,如:mysql、redis、nginx、操作系统等;
- Metricset
收集指标的集合,如:cpu、memory、network等;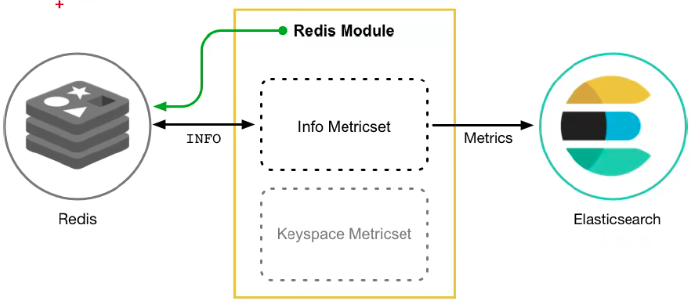
支持输出的类型有
- ElasticSearch
- LogStash
- Kafka
- Redis
- File
- Console
- Cloud
metricbeat也有很多module,需要收集哪个module的信息,即启动该module即可,命令与Filebeat类似
## 查module列表./metricbeat modules list## 启用module./metricbeat modules enable 模块名## 禁用module./metricbeat modules disable 模块名
系统监控指标
默认的model就开了系统监控指标
vim metricbeat.yml
添加如下内容
metricbeat.config.modules:path: ${path.config}/modules.d/*.ymlreload.enabled: falsesetup.template.settings:index.number_of_shards: 1index.codec: best_compressionsetup.kibana:output.elasticsearch:hosts: [""127.0.0.1:9200"]processors:- add_host_metadata: ~- add_cloud_metadata: ~
默认会指定的配置文件,就是在
${path.config}/modules.d/*.yml
也就是 system.yml文件,我们也可以自行开启其它的收集
启动
在配置完成后,我们通过如下命令启动即可./metricbeat -e
在ELasticsearch中可以看到,系统的一些指标数据已经写入进去了: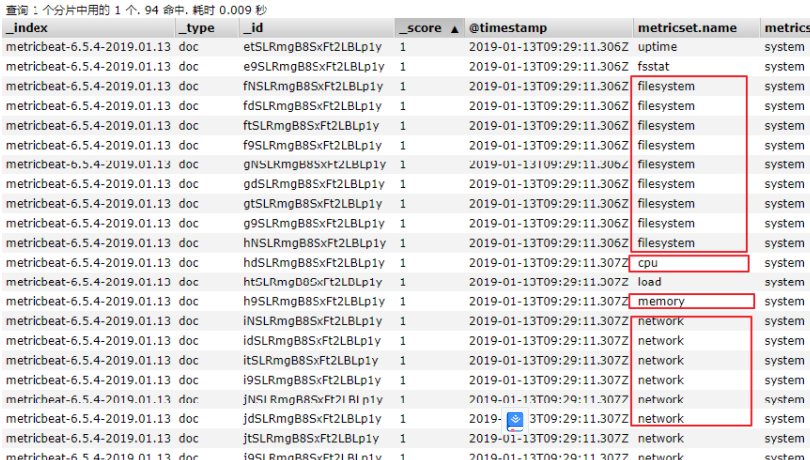
system module配置
- module: systemperiod: 10s # 采集的频率,每10秒采集一次metricsets: # 采集的内容- cpu- load- memory- network- process- process_summary
Metricbeat Module
Metricbeat Module的用法和我们之前学的filebeat的用法差不多
#查看列表./metricbeat modules list
能够看到对应的列表
Enabled:system #默认启用Disabled:aerospikeapachecephcouchbasedockerdropwizardelasticsearchenvoyproxyetcdgolanggraphitehaproxyhttpjolokiakafkakibanakuberneteskvmlogstashmemcachedmongodbmuninmysqlnginxphp_fpmpostgresqlprometheusrabbitmqredistraefikuwsgivspherewindows
Nginx Module
开启Nginx Module
在nginx中,需要开启状态查询,才能查询到指标数据。
#重新编译nginx./configure --prefix=/usr/local/nginx --with-http_stub_status_modulemakemake install./nginx -V #查询版本信息nginx version: nginx/1.11.6built by gcc 4.4.7 20120313 (Red Hat 4.4.7-23) (GCC)configure arguments: --prefix=/usr/local/nginx --with-http_stub_status_module#配置nginxvim nginx.conflocation /nginx-status {stub_status on;access_log off;}# 重启nginx./nginx -s reload
测试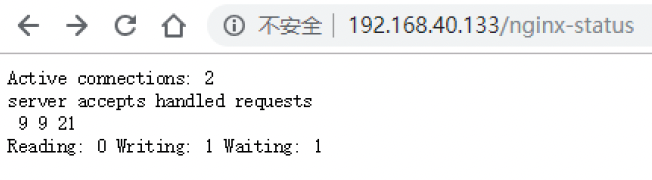
结果说明:
- Active connections:正在处理的活动连接数
- server accepts handled requests
- 第一个 server 表示Nginx启动到现在共处理了9个连接
- 第二个 accepts 表示Nginx启动到现在共成功创建 9 次握手
- 第三个 handled requests 表示总共处理了 21 次请求
- 请求丢失数 = 握手数 - 连接数 ,可以看出目前为止没有丢失请求
- Reading: 0 Writing: 1 Waiting: 1
- Reading:Nginx 读取到客户端的 Header 信息数
- Writing:Nginx 返回给客户端 Header 信息数
- Waiting:Nginx 已经处理完正在等候下一次请求指令的驻留链接(开启keep-alive的情况下,这个值等于 Active - (Reading+Writing))
配置nginx的module
#启用redis module./metricbeat modules enable nginx#修改redis module配置vim modules.d/nginx.yml
然后修改下面的信息
# Module: nginx# Docs: https://www.elastic.co/guide/en/beats/metricbeat/6.5/metricbeat-modulenginx.html- module: nginx#metricsets:# - stubstatusperiod: 10s# Nginx hostshosts: ["http://127.0.0.1"]# Path to server status. Default server-statusserver_status_path: "nginx-status"#username: "user"#password: "secret"
修改完成后,启动nginx
#启动./metricbeat -e
测试
可以看到,nginx的指标数据已经写入到了Elasticsearch

若有收获,就点个赞吧
0 人点赞
