Profile API 性能分析
平时开发的过程中我们可能需要对一些查询操作进行优化,而优化之前的工作就是要对操作的性能进行分析,而ES提供了Profile API来帮助用户进行性能分析。它让用户了解如何在较低的级别执行搜索请求,这样用户就可以理解为什么某些请求比较慢,并采取措施改进它们。
需要注意的是Profile API不测量网络延迟、搜索资源获取阶段、请求在队列中花费的时间或在协调节点上合并碎片响应时花费的时间。
需要注意的是开启性能分析会给查询带来非常大的性能开销。所以不要尝试将一个开启了性能分析的请求和为开启性能分析的请求比对时间效率。
开启性能分析
需要开启性能分析,只需要在原有请求中设置”profile”: true。而当查询嵌套的内容比较多的时候返回的性能分析内容会非常冗长,所以可以在请求URI后面设置?human=true获取比较清晰的结构。
性能分析结构
下面依旧是使用之前kibana创建的kibana_sample_data_ecommerce做测试。下面是一个简单的查询请求。
GET /kibana_sample_data_ecommerce/_search?human=true{"profile": true,"_source": false,"query": {"match": {"category": "Women's Shoes"}}}
返回内容
性能分析的相关报告在profile对象内。
{"took": 11,"timed_out": false,"_shards": {......},"hits": {......},"profile": {"shards": [{"id": "[tMhvMfVrTnGguu5QJ-1j-Q][kibana_sample_data_ecommerce][0]","searches": [{"query": [{"type": "BooleanQuery","description": "category:women's category:shoes","time": "14.6ms","time_in_nanos": 14642543,"breakdown": {"set_min_competitive_score_count": 0,"match_count": 3372,"shallow_advance_count": 0,"set_min_competitive_score": 0,"next_doc": 12574965,"match": 182802,"next_doc_count": 3378,"score_count": 3372,"compute_max_score_count": 0,"compute_max_score": 0,"advance": 0,"advance_count": 0,"score": 558388,"build_scorer_count": 12,"create_weight": 161677,"shallow_advance": 0,"create_weight_count": 1,"build_scorer": 1154576},"children": [{"type": "TermQuery","description": "category:women's","time": "1.3ms","time_in_nanos": 1326026,"breakdown": {"set_min_competitive_score_count": 0,"match_count": 0,"shallow_advance_count": 50,"set_min_competitive_score": 0,"next_doc": 0,"match": 0,"next_doc_count": 0,"score_count": 2466,"compute_max_score_count": 50,"compute_max_score": 248144,"advance": 312952,"advance_count": 2472,"score": 201148,"build_scorer_count": 18,"create_weight": 82500,"shallow_advance": 82773,"create_weight_count": 1,"build_scorer": 393452}},{"type": "TermQuery","description": "category:shoes","time": "1ms","time_in_nanos": 1089732,"breakdown": {"set_min_competitive_score_count": 0,"match_count": 0,"shallow_advance_count": 48,"set_min_competitive_score": 0,"next_doc": 0,"match": 0,"next_doc_count": 0,"score_count": 2080,"compute_max_score_count": 48,"compute_max_score": 183654,"advance": 454098,"advance_count": 2086,"score": 164281,"build_scorer_count": 18,"create_weight": 36149,"shallow_advance": 79552,"create_weight_count": 1,"build_scorer": 167717}}]}],"rewrite_time": 12723,"collector": [{"name": "CancellableCollector","reason": "search_cancelled","time": "1.1ms","time_in_nanos": 1112587,"children": [{"name": "SimpleTopScoreDocCollector","reason": "search_top_hits","time": "739.7micros","time_in_nanos": 739707}]}]}],"aggregations": []}]}}
上面是一个非常简单的查询并不存在聚合内容,返回的分析报告相对也是比较简单的。
参数解析
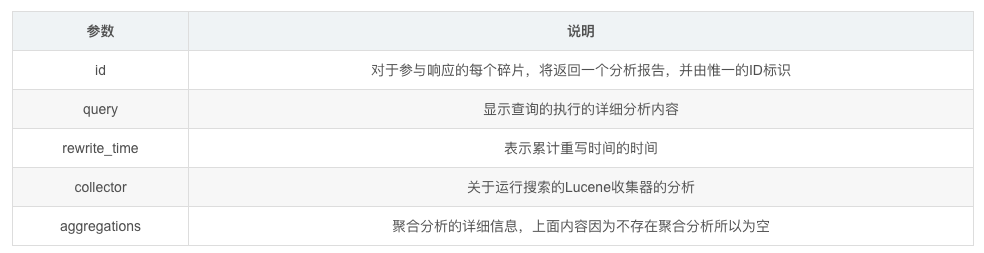
shards
因为针对一个索引的搜索可能涉及一个或者多个碎片。所以分析报告中shards是一个对象数组,每个分片都列出其ID,用来标识不同的分片。ID的命名格式节点ID+索引名称+分片索引
query
其是对基础Lucene索引执行的查询。用户提交的大多数搜索请求都只针对Lucene索引执行一次搜索。但是偶尔会执行多个搜索,比如包含一个全局聚合(需要为全局上下文执行第二个“match_all”查询)。
查询分析
query部分包含Lucene在特定碎片上执行查询树的详细时间。这个查询树的结构会类似于最初请求数据时候的查询结构。其会在description字段中提供类似的解释。下面看下上面例子的分析报告
"query" : [{"type" : "BooleanQuery","description" : "category:women's category:shoes","time" : "3.5ms","time_in_nanos" : 3540328,"breakdown" : {......},"children" : [{"type": "TermQuery","description": "category:women's","time": "1.3ms","time_in_nanos": 1326026,"breakdown": {"set_min_competitive_score_count": 0,"match_count": 0,"shallow_advance_count": 50,"set_min_competitive_score": 0,"next_doc": 0,"match": 0,"next_doc_count": 0,"score_count": 2466,"compute_max_score_count": 50,"compute_max_score": 248144,"advance": 312952,"advance_count": 2472,"score": 201148,"build_scorer_count": 18,"create_weight": 82500,"shallow_advance": 82773,"create_weight_count": 1,"build_scorer": 393452}},{"type": "TermQuery","description": "category:shoes","time": "1ms","time_in_nanos": 1089732,"breakdown": {......}}]}],
上面的查询条件被Lucene重写为一个带有两个子句,type字段显示Lucene类名,description字段显示了查询的Lucene解释文本,用于帮助区分查询的各个部分。time_in_nanos字段显示整个查询的花费(注意计时是以纳秒为单位列出的)。然后子数组列出可能存在的所有子查询。
breakdown
细分组件列出了底层Lucene执行的详细时间统计
"breakdown" : {"set_min_competitive_score_count": 0,"match_count": 0,"shallow_advance_count": 50,"set_min_competitive_score": 0,"next_doc": 0,"match": 0,"next_doc_count": 0,"score_count": 2466,"compute_max_score_count": 50,"compute_max_score": 248144,"advance": 312952,"advance_count": 2472,"score": 201148,"build_scorer_count": 18,"create_weight": 82500,"shallow_advance": 82773,"create_weight_count": 1,"build_scorer": 393452},

collector
Lucene为查询定义了一个收集器(Collector),负责协调遍历、评分以及匹配文档的收集。
"collector": [{"name": "CancellableCollector","reason": "search_cancelled","time": "1.1ms","time_in_nanos": 1112587,"children": [{"name": "SimpleTopScoreDocCollector","reason": "search_top_hits","time": "739.7micros","time_in_nanos": 739707}]}]
collector收集器
reason字段尝试给出收集器类名的简单英文描述。而目前官方网站列出的收集器包含下面内容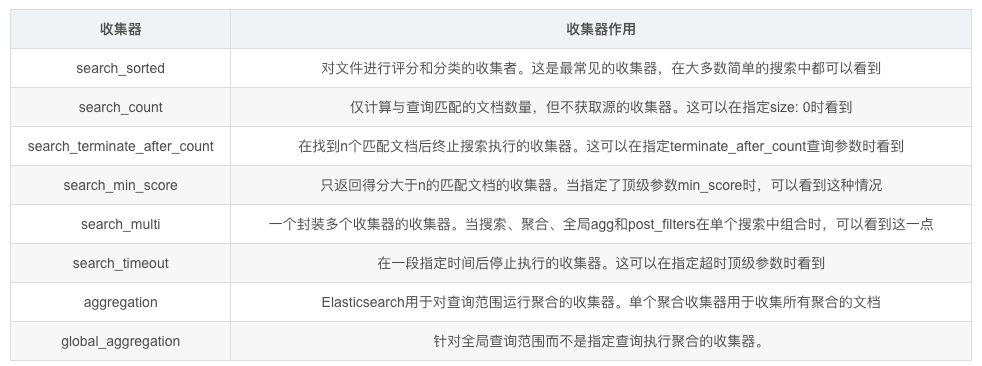
search_top_hits以及search_cancelled
关于这两个官方案例使用的收集器,在其文档中并没有说明,而我查询了stackoverflow也没有发现相关内容。后来我在lucene文档中查到了org.apache.lucene.search.TopDocsCollector类似的收集器类,主要是返回指定top数的文档。
rewrite_time(重写时间)
Lucene中的所有查询都要经历一次或者多次“重写”过程。这个过程将一直持续下去,直到查询停止变化。这个过程允许Lucene执行优化,例如删除冗余子句,替换一个查询以获得更有效的执行路径等等。这个值是包含所有被重写查询的总时间。
aggregations Section 聚合性能分析
使用聚合的查询时,其聚合内容的分析存在于aggregations对象中,其嵌套结构类似于查询请求时的嵌套结构。使用聚合的性能分析可以查看查询中聚合内容消耗资源的详情。
现在再次发出请求,此请求除了包含query还覆盖了aggs聚合以及嵌套聚合。
GET /kibana_sample_data_ecommerce/_search{"profile": true,"query": {"term": {"currency": {"value": "EUR"}}},"aggs": {"week": {"terms": {"field": "day_of_week"}},"gender_agg": {"global": {},"aggs": {"gender": {"terms": {"field": "customer_gender"}}}}},"post_filter": {"match": {"message": "some"}}}
最后返回的性能信息的聚合部分如下面的内容
{"profile": {"shards": [{"id": "[tMhvMfVrTnGguu5QJ-1j-Q][kibana_sample_data_ecommerce][0]","aggregations": [{"type": "LowCardinality","description": "week","time_in_nanos": 1121184,"breakdown": {"reduce": 0,"build_aggregation": 129073,"build_aggregation_count": 1,"initialize": 3620,"initialize_count": 1,"reduce_count": 0,"collect": 983814,"collect_count": 4675}},{"type": "GlobalAggregator","description": "gender_agg","time_in_nanos": 8733554,"breakdown": {"reduce": 0,"build_aggregation": 34655,"build_aggregation_count": 1,"initialize": 12318,"initialize_count": 1,"reduce_count": 0,"collect": 8681904,"collect_count": 4675},"children": [{"type": "GlobalOrdinalsStringTermsAggregator","description": "gender","time_in_nanos": 6729126,"breakdown": {"reduce": 0,"build_aggregation": 29463,"build_aggregation_count": 1,"initialize": 3148,"initialize_count": 1,"reduce_count": 0,"collect": 6691838,"collect_count": 4675}}]}]}]}}
可以看到上面week聚合部分使用了LowCardinality,在同一层级上gender_agg使用的是GlobalAggregator。在time_in_nanos中详细给出了每个聚合所消耗的时间。
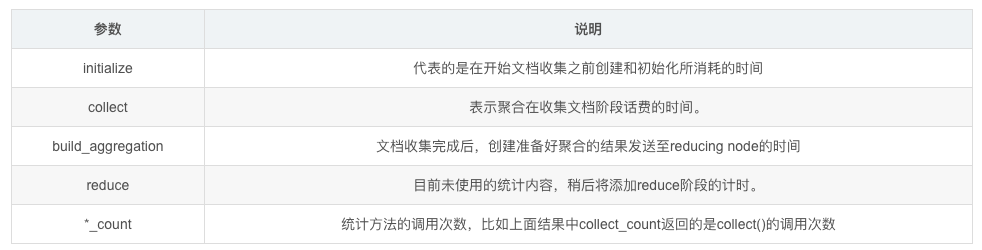
时间分析(Timing Breakdown)
Timing Breakdown对象内的数据分析了底层Lucene执行的详细时间消耗。以week的时间分析为例子。
"breakdown": {
    "reduce": 0,
    "build_aggregation": 129073,
    "build_aggregation_count": 1,
    "initialize": 3620,
    "initialize_count": 1,
    "reduce_count": 0,
    "collect": 983814,
    "collect_count": 4675
}
Profiling使用时需要注意的内容
使用时需要注意
使用性能分析API会给搜索执行引入了较大的开销。所以除非需要调试,其不应该在生产环境中被启用。
一些简单方法如collect, advance,next_doc开销可能更大,因为这些方法是在循环中调用的。
因为分析带来的额外消耗,所以不应该将启用性能分析和未启用性能分析的查询进行比较。
Profiling存在的局限
- 性能分析不能获取搜索数据获取以及网络开销
- 性能分析也不考虑在队列中花费的时间、合并协调节点上的shard响应,或诸如构建全局序数之类的额外工作
- 性能分析目前无法应用于搜索建议(suggestions),高亮搜索(highlighting)
- 目前reduce阶段无法使用性能分析统计结果
- 性能分析是个实验性的功能

若有收获,就点个赞吧
0 人点赞
