安装
./bin/elasticserch-plugin install x-pack //ps:如果搭建了集群必须每台集群上都安装。./bin/kibana-plugin install x-packlogstash-plugin install x-pack
不需要账号密码
# 不需要账号密码验证xpack.security.enabled: false
需要账号密码
xpack.security.enabled: true # 这条配置表示开启xpack认证机制xpack.security.transport.ssl.enabled: truecluster.initial_master_nodes: ["10.3.7.7"]
- xpack.security.enabled:表示开启xpack认证机制。
- xpack.security.transport.ssl.enabled:这条如果不配,es将起不来,会报如下错误:Transport SSL must be enabled if security is enabled on a [basic] license. Please set [xpack.security.transport.ssl.enabled] to [true] or disable security by setting [xpack.security.enabled] to [false]
配置完成,记得创建配置中涉及到的目录并授权,然后启动es。启动成功之后,再次访问es,就需要基于用户来访问了,但是在这之前,需要先给对应的用户创建密码才行。
添加密码
ES中内置了几个管理其他集成组件的账号即:apm_system, beats_system, elastic, kibana, logstash_system, remote_monitoring_user,使用之前,首先需要添加一下密码。
$ /usr/share/elasticsearch/bin/elasticsearch-setup-passwords interactiveInitiating the setup of passwords for reserved users elastic,apm_system,kibana,logstash_system,beats_system,remote_monitoring_user.You will be prompted to enter passwords as the process progresses.Please confirm that you would like to continue [y/N]yEnter password for [elastic]:Reenter password for [elastic]:Enter password for [apm_system]:Reenter password for [apm_system]:Enter password for [kibana]:Reenter password for [kibana]:Enter password for [logstash_system]:Reenter password for [logstash_system]:Enter password for [beats_system]:Reenter password for [beats_system]:Enter password for [remote_monitoring_user]:Reenter password for [remote_monitoring_user]:Changed password for user [apm_system]Changed password for user [kibana]Changed password for user [logstash_system]Changed password for user [beats_system]Changed password for user [remote_monitoring_user]Changed password for user [elastic]
- interactive:给用户一一设置密码。
- auto:自动生成密码。
如果这个地方报如下错误:
Failed to determine the health of the cluster running at http://10.3.7.7:9200Unexpected response code [503] from calling GET http://10.3.7.7:9200/_cluster/health?prettyCause: master_not_discovered_exceptionIt is recommended that you resolve the issues with your cluster before running elasticsearch-setup-passwords.It is very likely that the password changes will fail when run against an unhealthy cluster.Do you want to continue with the password setup process [y/N]y
可能是有脏数据导致,此时可以停掉es,删除 data 数据目录,然后重新启动在进行操作。
配置完毕之后,可以通过如下方式访问es服务:
curl -XGET -u elastic 'localhost:9200/_xpack/security/user?pretty'curl 127.0.0.1:9200 -u elastic
配置kibana
开启了安全认证之后,kibana连接es以及访问es都需要认证。
变更kibana的配置,一共有两种方法,一种明文的,一种密文的。
明文配置
server.port: 5601server.host: "0.0.0.0"server.name: "es-node1"elasticsearch.hosts: ["http://10.3.0.42:9200"]kibana.index: ".kibana"i18n.locale: "zh-CN"elasticsearch.username: "kibana"elasticsearch.password: "kibana_passwd"xpack.reporting.encryptionKey: "a_random_string"xpack.security.encryptionKey: "something_at_least_32_characters"
- elasticsearch.username:连接es的用户名。
- elasticsearch.password:连接es的密码。
- xpack.reporting.encryptionKey:如果不添加这条配置,将会报错 Generating a random key for xpack.reporting.encryptionKey. To prevent pending reports from failing on restart, please set xpack.reporting.encryptionKey in kibana.yml。
- xpack.security.encryptionKey:如果不配置这条,将会报错 Generating a random key for xpack.security.encryptionKey. To prevent sessions from being invalidated on restart, please set xpack.security.encryptionKey in kibana.yml
密文配置
当然肯定推荐使用这种密文的方式进行认证,认证之前,需要首先将用户名密码保存到内置的ketstore里。
/usr/share/kibana/bin/kibana-keystore --allow-root create/usr/share/kibana/bin/kibana-keystore --allow-root add elasticsearch.username/usr/share/kibana/bin/kibana-keystore --allow-root add elasticsearch.password
原封不动执行如上三条命令,用户名的时候输入kibana,密码写入对应密码,接着调整kibana的配置:
server.port: 5601server.host: "0.0.0.0"server.name: "es-node1"elasticsearch.hosts: ["http://10.3.0.42:9200"]kibana.index: ".kibana"i18n.locale: "zh-CN"xpack.reporting.encryptionKey: "a_random_string"xpack.security.encryptionKey: "something_at_least_32_characters"
然后重启kibana即可访问,访问的时候使用elastic的用户密码登入,将是全局管理权限,如果需要创建kibana的只读用户,则可以通过管理—用户—新建用户,对用户进行角色授权即可。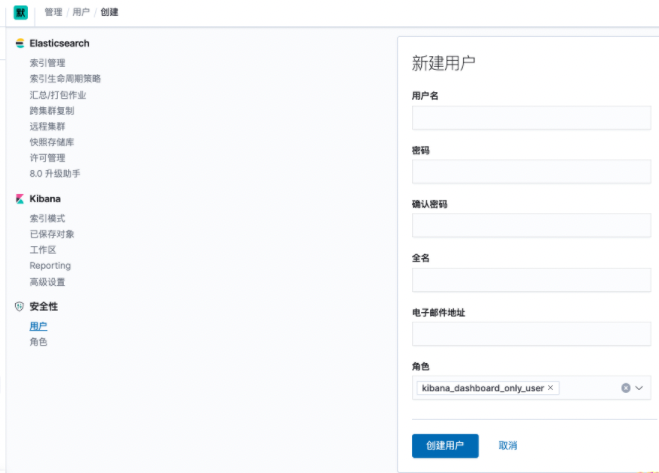
logstash也需要配置
打开自定义的logstash的配置文件logstash.conf,在output中增加elasticsearch的用户名和密码
[root@ELK1 ~]# vim /home/elk/logstash-7.2.1/config/logstash.confinput {beats {port => 5044}}output {stdout {codec => rubydebug}elasticsearch {hosts => ["192.168.3.181:9200","192.168.3.182:9200","192.168.3.183:9200"]user => "elastic"password => "123456"}}
集群配置
在我配置过程中,发现集群认证需要首先配置秘钥才行,否则在给内置用户创建秘钥的时候将会报错。
证书
如下操作在其中一个node节点执行即可,生成完证书传到集群其他节点即可。
/usr/share/elasticsearch/bin/elasticsearch-certutil ca/usr/share/elasticsearch/bin/elasticsearch-certutil cert --ca elastic-stack-ca.p12
两条命令均一路回车即可,不需要给秘钥再添加密码。
证书创建完成之后,默认在es的数据目录,这里统一放到etc下:
$ ls /usr/share/elasticsearch/elastic-*elastic-certificates.p12 elastic-stack-ca.p12mv /usr/share/elasticsearch/elastic-* /etc/elasticsearch/chown elasticsearch.elasticsearch elastic-*
同样,将如上命令生成的两个证书文件拷贝到另外两台机器作为通信依据,要注意调整权限,否则服务无法启动。
配置
三台机器配置文件如下:
cluster.name: db-searchnode.name: dc-search-es7-1path.data: /data/elasticsearch/datapath.logs: /data/elasticsearch/lognetwork.host: 0.0.0.0http.port: 9200transport.tcp.port: 9300discovery.seed_hosts: ["10.3.23.249:9300","10.3.23.48:9300","10.3.23.191:9300"]cluster.initial_master_nodes: ["10.3.23.249:9300","10.3.23.48:9300","10.3.23.191:9300"]xpack.security.enabled: truexpack.security.transport.ssl.enabled: truexpack.security.transport.ssl.verification_mode: certificatexpack.security.transport.ssl.keystore.path: /etc/elasticsearch/elastic-certificates.p12xpack.security.transport.ssl.truststore.path: /etc/elasticsearch/elastic-certificates.p12
除了node.name使用各自主机名之外,其他配置都一样。
如上配置无误,则可以启动es。
为内置账号添加密码
ES中内置了几个管理其他集成组件的账号即:apm_system, beats_system, elastic, kibana, logstash_system, remote_monitoring_user,使用之前,首先需要添加一下密码。
$ /usr/share/elasticsearch/bin/elasticsearch-setup-passwords interactiveInitiating the setup of passwords for reserved users elastic,apm_system,kibana,logstash_system,beats_system,remote_monitoring_user.You will be prompted to enter passwords as the process progresses.Please confirm that you would like to continue [y/N]yEnter password for [elastic]:Reenter password for [elastic]:Enter password for [apm_system]:Reenter password for [apm_system]:Enter password for [kibana]:Reenter password for [kibana]:Enter password for [logstash_system]:Reenter password for [logstash_system]:Enter password for [beats_system]:Reenter password for [beats_system]:Enter password for [remote_monitoring_user]:Reenter password for [remote_monitoring_user]:Changed password for user [apm_system]Changed password for user [kibana]Changed password for user [logstash_system]Changed password for user [beats_system]Changed password for user [remote_monitoring_user]Changed password for user [elastic]
- interactive:给用户一一设置密码。
- auto:自动生成密码。
配置完毕之后,可以通过如下方式访问es服务:
curl -XGET -u elastic 'localhost:9200/_xpack/security/user?pretty'curl 127.0.0.1:9200 -u elastic
剩下的就是与上边的使用方式一致了,kibana的认证,logstash的认证等等。
其中kibana通过密文认证之后,配置如下:
server.port: 5601server.host: "0.0.0.0"server.name: "es-node3"elasticsearch.hosts: ["http://10.3.6.30:9208"]kibana.index: ".kibana"i18n.locale: "zh-CN"
metricbeat配置
brew tap elastic/tapbrew install elastic/tap/metricbeat-full或者curl -L -O https://artifacts.elastic.co/downloads/beats/metricbeat/metricbeat-7.14.2-linux-x86_64.tar.gztar xzvf metricbeat-7.14.2-linux-x86_64.tar.gz
metricbeat modules enable elasticsearch-xpack
配置文件里面
output.elasticsearch:hosts: ["myEShost:9200"]username: "metricbeat_internal"password: "YOUR_PASSWORD"setup.kibana:host: "mykibanahost:5601"username: "my_kibana_user"password: "{pwd}"
xpack破解
https://www.cnblogs.com/dengbangpang/p/12945052.html
elasticsearch7.X x-pack破解 - 非洲羚羊 - 博客园.pdf

若有收获,就点个赞吧
0 人点赞
