参考和内容
文章内容
调试内核,众所周知有多痛苦,但内核提供了些trace(发现,探索)工具,帮助定位问题原因
内核Document下 trace目录 给提供了很多使用方法和资料,
Development_tools-Kernel_tracing : 内核给出的调试器文档
我们暂时不需要了解实现原理,先学会使用及分析输出信息。
常用Trace及区分
gprof
gprof的介绍
gprof是GNU profile工具,可以运行于linux、AIX、Sun等操作系统进行C、C++、Pascal、Fortran程序的性能分析,用于程序的性能优化以及程序瓶颈问题的查找和解决。通过分析应用程序运行时产生的“flat profile”,可以得到每个函数的调用次数,每个函数消耗的处理器时间,也可以得到函数的“调用关系图”,包括函数调用的层次关系,每个函数调用花费了多少时间。
官方网站:http://sourceware.org/binutils/docs-2.17/gprof/index.html
Gprof 是GNU gnu binutils工具之一,默认情况下linux系统当中都带有这个工具。
- 可以显示“flat profile”,包括每个函数的调用次数,每个函数消耗的处理器时间,
- 可以显示“Call graph”,包括函数的调用关系,每个函数调用花费了多少时间。
原理: 通过在编译和链接程序的时候(使用 -pg 编译和链接选项),gcc 在你应用程序的每个函数中都加入了一个名为mcount ( or “_mcount” , or “__mcount” , 依赖于编译器或操作系统)的函数,也就是说你的应用程序里的每一个函数都会调用mcount, 而mcount 会在内存中保存一张函数调用图,并通过函数调用堆栈的形式查找子函数和父函数的地址。这张调用图也保存了所有与函数相关的调用时间,调用次数等等的所有信息。
gprof的作用
gprof 可以用来分析应用程序的性能,但也 只能分析程序运行中的性能,且计算时无法跳过sleep或阻塞时间。
优点:简单好用,最基础的性能分析工具之一
缺点:1.不支持动态链接库的性能分析。2.无法跳过sleep或sleep时间。3.多线程下,只能采集主线程性能数据(gprof采用ITIMER_PROF信号,在多线程内,只有主线程才能响应该信号)。
gprof的使用
gcc编译时 加入-pg选项,然后运行一次后会出现gmon.out解析文件,最后用gprof进行分析。
编译生成可执行程序hello:$gcc -pg -o hello hello.c需要运行一下可执行程序hello以生成gprof分析需要的数据:$./hello这样,会生成一个gmon.out文件供 gprof分析程序时候使用。开始分析程序的执行时间:$gprof hello
gprof的结果分析
输出选项:https://sourceware.org/binutils/docs-2.17/gprof/Output.html#Output
结果分析-Flat Profile:
Each sample counts as 0.01 seconds.% cumulative self self totaltime seconds seconds calls ms/call ms/call name62.76 0.05 0.05 1 50.21 60.25 my_print237.66 0.08 0.03 3 10.04 10.04 count_sum0.00 0.08 0.00 2 0.00 10.04 my_print
简述
| %time | Cumulative seconds |
Self Seconds |
Calls | Self TS/call |
Total TS/call |
name |
|---|---|---|---|---|---|---|
| 该函数消耗时间占程序所有时间百分比 | 程序的累积执行时间 (只是包括gprof能够监控到的函数) |
该函数本身执行时间 (所有被调用次数的统计时间) |
函数被调用次数 | 函数平均执行时间 (不包括被调用时间) (函数的单次执行时间) |
函数平均执行时间 (包括被调用时间) (函数的单次执行时间) |
函数名 |
详细描述
% time这是程序在此函数中花费的总执行时间的百分比。这些加起来应该是 100%。cumulative seconds这是计算机执行此函数所花费的累计总秒数,包括此函数调用其它函数花费的时间。self seconds这是这个函数单独占的秒数,调用其它函数花费的时间不计算在内。calls这是函数被调用的总次数。如果该函数未被调用,或者它被调用的次数无法确定(可能是该函数不是在启用分析的情况下编译的),则调用字段为空。self ms/call如果此函数被分析,这表示每次调用在此函数中花费的平均毫秒数(不包含此函数调用的子函数消耗时间)。total ms/call这表示在此函数及其每次调用的子函数中花费的平均毫秒数。这是Flat Profile文件中唯一使用调用图分析的字段。name这是函数的名称。在self 秒和call 字段排序后,Flat Profile文件按此字段的字母顺序排序。
结果分析2-Call Graph:
index % time self children called name<spontaneous>[1] 100.0 0.00 0.08 main [1]0.05 0.01 1/1 my_print2 [2]0.00 0.02 2/2 my_print [4]-----------------------------------------------0.05 0.01 1/1 main [1][2] 75.0 0.05 0.01 1 my_print2 [2]0.01 0.00 1/3 count_sum [3]-----------------------------------------------0.01 0.00 1/3 my_print2 [2]0.02 0.00 2/3 my_print [4][3] 37.5 0.03 0.00 3 count_sum [3]-----------------------------------------------0.00 0.02 2/2 main [1][4] 25.0 0.00 0.02 2 my_print [4]0.02 0.00 2/3 count_sum [3]-----------------------------------------------
简述:
| Index | %time | Self | Children | Called | Name |
|---|---|---|---|---|---|
| 索引值 | 函数消耗时间占所有时间百分比 | 函数本身执行时间 | 执行子函数所用时间 | 被调用次数 | 函数名 |
详细描述
index:为每个函数起了一个索引号; % time :函数及子函数占用时间百分比,比如main占了100%, 下边调用的my_print和my_print2 加起来也是100%
- self
对于记录中当前函数行来说,代表执行本函数所消耗的时间(不包含它的所有子函数)。 对于记录中当前行上面行(父函数)来说,代表本函数返回到父函数花费了(父函数)多久的时间(不包括本函数的子函数所消耗的时间)。 对于记录中当前行下面行(子函数)来说,代表子函数返回到本函数花费了(本函数)多久的时间(不包括子函数的子函数所消耗的时间)。
- children
对于记录中当前函数行来说,代表本函数的所有子孙函数返回到本函数所消耗(本函数)的时间。
对于记录中当前行上面行(父函数)来说,代表本函数所有子孙返回到父函数,子孙们(待理解?)消耗(父函数)的时间。
对于记录中当前行下面行(子函数)来说,代表子函数所有子孙返回到本函数,那些子孙(待理解?)消耗(本函数)的时间。- called
对于记录中当前函数行来说,代表本函数被调用的次数,如果是递归函数则是非递归部分次数跟一个’+’号接递归调用次数。
对于记录中当前行上面行(父函数)来说,’/‘左面代表该父函数调用该函数次数,’/‘右面代表该函数总共被调用次数。
对于记录中当前行下面行(子函数)来说,’/‘左面代表该函数调用该子函数次数,’/‘右面代表该子函数总共被调用次数。- name
对于记录中当前函数行来说,代表当前函数名加上其所属记录的index号,若该函数是某调用环一员,则环号放在函数名和index号之间。
对于记录中当前行上面行(父函数)来说,代表父函数名加其记录的index号,若父函数是某调用环一员,则环号放在父函数和index号之间。如果函数的父函数无法确定,那么在name字段打印一个`’字符,并且所有其它字段为空(例如第一行)。
对于记录中当前行下面行(子函数)来说,代表子函数名加其记录的index号,若子函数是某调用环一员,则环号放在子函数和index号之间。
ftrace的使用
相关参考
- Development_tools-Kernel_tracing 之 Tracing-Ftrace
- ftrace和trace-cmd:跟踪内核函数的利器
- ftrace 简介-IBM + PPT-总结
- Linux ftrace框架介绍及运用(细致到代码级别,推荐有时间好好看看)
- Debugging the kernel using Ftrace-A 和 B
- 内核文档: ftrace.rst + trace-uses.rst + ftrace-design.rst
- ftrace利器之trace-cmd和kernelshark + 当Linux内核遭遇鲨鱼—kernelshark
ftrace的使用
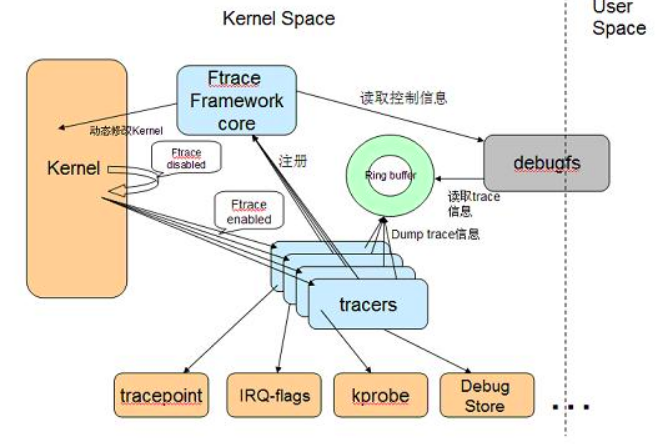
Ftrace是一个内核跟踪器,旨在帮助开发人员和系统设计人员可以查找内核内部发生的情况。
它可用于调试或分析在用户空间之外发生的延迟和性能问题。
尽管通常将ftrace视为函数跟踪器,但实际上它是几个分类跟踪实用程序的框架。
可以进行延迟跟踪,以检查禁用和启用的中断之间发生了什么,以及抢占以及从唤醒任务到计划任务的时间。
ftrace最常见的用途之一是事件跟踪。 整个内核中有数百个静态事件点,可以通过tracefs文件系统启用这些事件点,以查看内核某些部分的情况。
使能trace
内核支持配置
# lib/Kconfig.debug # 关于内核debug的配置都在这里边# 基础配置CONFIG_TRACE_IRQFLAGS_SUPPORTCONFIG_STACKTRACE_SUPPORTCONFIG_TRACING_SUPPORTKernel hacking --->[*] Tracers --->[*] Kernel debugging # DEBUG_KERNEL 基本属于内核必选项# 内部配置参考:kernel/trace/Kconfig,相关代码也在这里边
sysfs中支持
内核中配置了trace,且使能sysfs的话,内核会创建/sys/kernel/tracing,
要自动挂载,可以在 /etc/fstab中支持:
tracefs /sys/kernel/tracing tracefs defaults 0 0
或者
mount -t tracefs nodev /sys/kernel/tracing
注:4.1以前都在/sys/kernel/debug/tracing中,为了向前兼容,所以在挂载debugfs时也有这个目录。
所有的文件作用在:ftrace.rst 描述的很清楚。
# neet rootcd /sys/kernel/debug/tracing
trace-cmd+kernelshark鲨鱼
因为ftrace比较难用,在有条件情况下,建议使用trace-cmd和kernelshark
安装说明
源码包安装
git clone https://git.kernel.org/pub/scm/linux/kernel/git/rostedt/trace-cmd.gitmake install--------------------------只安装trace-cmdmake install_gui--------------------安装trace-cmd和kernelshark
apt安装
sudo apt-get install -y kernelsharksudo apt-get install -y trace-cmd
基础使用方法
baiy@baiy-ThinkPad-E470c:debug-tools$ trace-cmdtrace-cmd version 2.6.1 // 版本信息usage:trace-cmd [COMMAND] ...commands:record - record a trace into a trace.dat file //***记录一个trace info到文件start - start tracing without recording into a fileextract - extract a trace from the kernelstop - stop the kernel from recording trace datarestart - restart the kernel trace data recordingshow - show the contents of the kernel tracing bufferreset - disable all kernel tracing and clear the trace buffersreport - read out the trace stored in a trace.dat filestream - Start tracing and read the output directlyprofile - Start profiling and read the output directlyhist - show a historgram of the trace.dat informationstat - show the status of the running tracing (ftrace) systemsplit - parse a trace.dat file into smaller file(s)options - list the plugin options available for trace-cmd reportlisten - listen on a network socket for trace clientslist - list the available events, plugins or optionsrestore - restore a crashed recordsnapshot - take snapshot of running tracestack - output, enable or disable kernel stack tracingcheck-events - parse trace event formats
trace list
主要作用:列出所有可被追踪的 plugins, events or options for Ftrace
参考:man-page, 其中部分选项支持regex 正则表达式
baiy@baiy-ThinkPad-E470c:debug-tools$ sudo trace-cmd list -htrace-cmd version 2.6.1usage:trace-cmd list [-e [regex]][-t][-o][-f [regex]]-e list available events-F show event format-R show event triggers-l show event filters-t list available tracers-o list available options-f [regex] list available functions to filter on // 列出所有可被追踪的函数-P list loaded plugin files (by path)-O list plugin options-B list defined buffer instances-C list the defined clocks (and active one) // 列出所有时钟baiy@baiy-ThinkPad-E470c:debug-tools$ sudo trace-cmd list -thwlat blk mmiotrace function_graph wakeup_dl wakeup_rt wakeup function nopbaiy@baiy-ThinkPad-E470c:debug-tools$ sudo trace-cmd list -C[local] global counter uptime perf mono mono_raw boot x86-tsc下边三个文件就是trace cmd list显示的所有functions,evnets, tracers/sys/kernel/tracing/tracing# cat available_available_events available_filter_functions available_tracers
trace record
trace-cmd-record : 记录了基本用法
root@baiy-ThinkPad-E470c:tracing# trace-cmd record -htrace-cmd version 2.6.1usage:trace-cmd record [-v][-e event [-f filter]][-p plugin][-F][-d][-D][-o file] \[-s usecs][-O option ][-l func][-g func][-n func] \[-P pid][-N host:port][-t][-r prio][-b size][-B buf][command ...][-m max][-C clock]-e run command with event enabled-f filter for previous -e event.....
# 如何查看支持插件: -proot@baiy-ThinkPad-E470c:tracing# pwd/sys/kernel/tracingroot@baiy-ThinkPad-E470c:tracing# cat available_tracershwlat blk mmiotrace function_graph wakeup_dl wakeup_rt wakeup function noproot@baiy-ThinkPad-E470c:tracing# trace-cmd list -thwlat blk mmiotrace function_graph wakeup_dl wakeup_rt wakeup function nop
怎么使用ftrace
参考: 关于Ftrace的一个完整案例 和 ftrace.rst
通过sysfs导出Ftrace.
注:debugfs有些时候有限制,不允许用绝对路径,可以切换到本地目录执行。
比如,追踪函数调用: 宋宝华测试代码
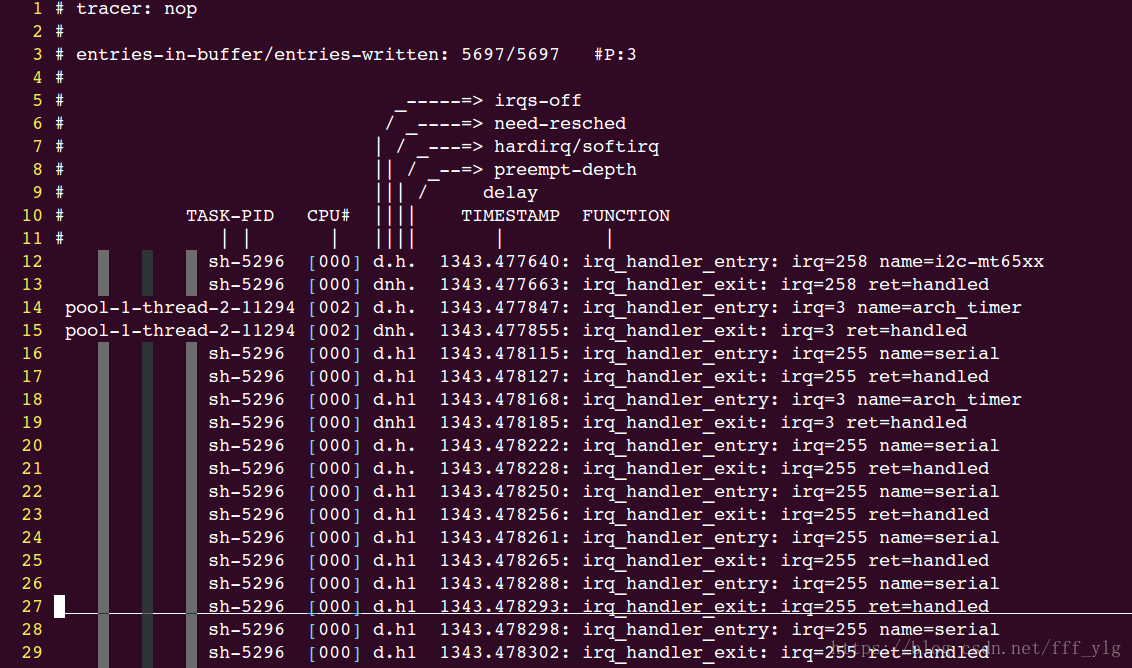
比如,追踪中断信息
#!/bin/bash# CONFIG_IRQSOFF_TRACER=y # 内核配置使能# Kernel hacking ---># [*] Tracers ---># [*] Interrupts-off Latency Tracerdebugfs=/sys/kernel/debugecho nop > $debugfs/tracing/current_tracerecho 0 > $debugfs/tracing/tracing_onecho $$ > $debugfs/tracing/set_ftrace_pidecho 30720 > /sys/kernel/debug/tracing/buffer_size_kbecho irqsoff > /sys/kernel/debug/tracing/current_tracerecho 1 > /sys/kernel/debug/tracing/tracing_on# 等待一段时间 .....echo 0 > /sys/kernel/debug/tracing/tracing_on# 最后,需要获取中断trace的log文件:cat /sys/kernel/debug/tracing/trace > trace.txt
bptrace(TBD)
https://cloud.tencent.com/developer/article/1442285
https://www.cnblogs.com/arnoldlu/p/7211249.html
strace ,ltrace, ptrace, ftrace, sysrq

若有收获,就点个赞吧
0 人点赞
