表联结
提供了类似于SQL的join接口,供我们进行多表组合。不同的是,pandas可以对index进行join
Concatenate
pd.concat(objs, axis=0, join='outer', join_axes=None, ignore_index=False,keys=None, levels=None, names=None, verify_integrity=False,copy=True)
- objs : a sequence or mapping of Series or DataFrame objects. If a dict is passed, the sorted keys will be used as the keys argument, unless it is passed, in which case the values will be selected (see below). Any None objects will be dropped silently unless they are all None in which case a ValueError will be raised.
- axis : {0, 1, …}, default 0. The axis to concatenate along.
- join : {‘inner’, ‘outer’}, default ‘outer’. How to handle indexes on other axis(es). Outer for union and inner for intersection.
- ignore_index : boolean, default False. If True, do not use the index values on the concatenation axis. The resulting axis will be labeled 0, …, n - 1. This is useful if you are concatenating objects where the concatenation axis does not have meaningful indexing information. Note the index values on the other axes are still respected in the join.
- keys : sequence, default None. Construct hierarchical index using the passed keys as the outermost level. If multiple levels passed, should contain tuples.
- levels : list of sequences, default None. Specific levels (unique values) to use for constructing a MultiIndex. Otherwise they will be inferred from the keys.
- names : list, default None. Names for the levels in the resulting hierarchical index.
- verify_integrity : boolean, default False. Check whether the new concatenated axis contains duplicates. This can be very expensive relative to the actual data concatenation.
- copy : boolean, default True. If False, do not copy data unnecessarily.
比较重要的几个参数
- objs通常是一个Series或DataFrame的序列
- axis哪个轴上进行拼接,default 0
- join两种情况,inner依据索引共同出现的部分进行拼接;outer全部都要,索引不匹配的填充NaN,default outer
- ignore_index,是否忽略拼接轴上的索引,如果忽略则从0开始计数
先准备一下我们的练习数据集
df1 = pd.DataFrame({'B': ['B1', 'B2', 'B3'],'A': ['A1', 'A2', 'A3'],'C': ['C1', 'C2', 'C3']},index = [1,2,3])df1
| B | A | C | |
|---|---|---|---|
| 1 | B1 | A1 | C1 |
| 2 | B2 | A2 | C2 |
| 3 | B3 | A3 | C3 |
df2 = pd.DataFrame({'D': ['C3', 'C4', 'C5'],'C': ['A3', 'A4', 'A5'],'B': ['B3', 'B4', 'B5']},index = [3,4,5])df2
| D | C | B | |
|---|---|---|---|
| 3 | C3 | A3 | B3 |
| 4 | C4 | A4 | B4 |
| 5 | C5 | A5 | B5 |
pd.concat([df1, df2], sort=False)
| A | B | C | D | |
|---|---|---|---|---|
| 1 | A1 | B1 | C1 | NaN |
| 2 | A2 | B2 | C2 | NaN |
| 3 | A3 | B3 | C3 | NaN |
| 3 | NaN | B3 | A3 | C3 |
| 4 | NaN | B4 | A4 | C4 |
| 5 | NaN | B5 | A5 | C5 |
pd.concat([df1, df2], join='inner')
| B | C | |
|---|---|---|
| 1 | B1 | C1 |
| 2 | B2 | C2 |
| 3 | B3 | C3 |
| 3 | B3 | A3 |
| 4 | B4 | A4 |
| 5 | B5 | A5 |
pd.concat([df1, df2], join='inner', ignore_index=True)
| B | C | |
|---|---|---|
| 0 | B1 | C1 |
| 1 | B2 | C2 |
| 2 | B3 | C3 |
| 3 | B3 | A3 |
| 4 | B4 | A4 |
| 5 | B5 | A5 |
pd.concat([df1, df2], axis=1)
| A | B | C | C | B | D | |
|---|---|---|---|---|---|---|
| 1 | A1 | B1 | C1 | NaN | NaN | NaN |
| 2 | A2 | B2 | C2 | NaN | NaN | NaN |
| 3 | A3 | B3 | C3 | A3 | B3 | C3 |
| 4 | NaN | NaN | NaN | A4 | B4 | C4 |
| 5 | NaN | NaN | NaN | A5 | B5 | C5 |
pd.concat([df1, df2], axis=1, join='inner')
| A | B | C | C | B | D | |
|---|---|---|---|---|---|---|
| 3 | A3 | B3 | C3 | A3 | B3 | C3 |
Joining / Merging
merge函数用来对两张表进行join,非常类似于sql当中的表联结。 pandas里面不仅可以对columns进行join, 还可以对index进行join。
pd.merge(left, right, how='inner', on=None, left_on=None, right_on=None,left_index=False, right_index=False, sort=True,suffixes=('_x', '_y'), copy=True, indicator=False,validate=None)
- left: A DataFrame object
- right: Another DataFrame object
- on: Columns (names) to join on. Must be found in both the left and right DataFrame objects. If not passed and left_index and right_index are False, the intersection of the columns in the DataFrames will be inferred to be the join keys
- left_on: Columns from the left DataFrame to use as keys. Can either be column names or arrays with length equal to the length of the DataFrame
- right_on: Columns from the right DataFrame to use as keys. Can either be column names or arrays with length equal to the length of the DataFrame
- left_index: If True, use the index (row labels) from the left DataFrame as its join key(s). In the case of a DataFrame with a MultiIndex (hierarchical), the number of levels must match the number of join keys from the right DataFrame
- right_index: Same usage as left_index for the right DataFrame
- how: One of ‘left’, ‘right’, ‘outer’, ‘inner’. Defaults to inner. See below for more detailed description of each method
- sort: Sort the result DataFrame by the join keys in lexicographical order. Defaults to True, setting to False will improve performance substantially in many cases
- suffixes: A tuple of string suffixes to apply to overlapping columns. Defaults to (‘_x’, ‘_y’).
- copy: Always copy data (default True) from the passed DataFrame objects, even when reindexing is not necessary. Cannot be avoided in many cases but may improve performance / memory usage. The cases where copying can be avoided are somewhat pathological but this option is provided nonetheless.
- indicator: Add a column to the output DataFrame called _merge with information on the source of each row. _merge is Categorical-type and takes on a value of left_only for observations whose merge key only appears in ‘left’ DataFrame, right_only for observations whose merge key only appears in ‘right’ DataFrame, and both if the observation’s merge key is found in both.
对一些常用参数进行说明
- left / right参数 指定左右表
- on参数 关联的key是什么,适用于左右表关联key相同的情况
- left_on / right_on参数 分别指定,适用于左右表关联key不同的情况
- left_index / right_index参数 是否按照index来join
- how参数 left / right / outer / inner 默认为inner方式
- indicator参数 True / False
基于columns进行join
# 在一个主键上mergepd.merge(df1, df2, on='B')# 下面这条语句和上面是等价的效果# pd.merge(df1, df2, left_on='B', right_on='B')
| B | A | C_x | D | C_y | |
|---|---|---|---|---|---|
| 0 | B3 | A3 | C3 | C3 | A3 |
df2.loc[3, 'C'] = 'C3'df2
| D | C | B | |
|---|---|---|---|
| 3 | C3 | C3 | B3 |
| 4 | C4 | A4 | B4 |
| 5 | C5 | A5 | B5 |
# 在多个主键上mergepd.merge(df1, df2, on=['B', 'C'])
| B | A | C | D | |
|---|---|---|---|---|
| 0 | B3 | A3 | C3 | C3 |
# 在多个主键上merge,分别指定不同的列pd.merge(df1, df2, left_on=['B', 'C'], right_on=['B', 'D'])
| B | A | C | D | |
|---|---|---|---|---|
| 0 | B3 | A3 | C3 | C3 |
注意看加上indicator参数后,输出结果与上面对比有什么不同?这个参数表明是左右表都有,还是只是左表或右表有。
pd.merge(df1, df2, on=['B', 'C'], indicator=True)
| B | A | C | D | _merge | |
|---|---|---|---|---|---|
| 0 | B3 | A3 | C3 | C3 | both |
pd.merge(df1, df2, how='left', indicator=True)
| B | A | C | D | _merge | |
|---|---|---|---|---|---|
| 0 | B1 | A1 | C1 | NaN | left_only |
| 1 | B2 | A2 | C2 | NaN | left_only |
| 2 | B3 | A3 | C3 | C3 | both |
pd.merge(df1, df2, how='right', indicator=True)
| B | A | C | D | _merge | |
|---|---|---|---|---|---|
| 0 | B3 | A3 | C3 | C3 | both |
| 1 | B4 | NaN | A4 | C4 | right_only |
| 2 | B5 | NaN | A5 | C5 | right_only |
pd.merge(df1, df2, how='outer', indicator=True)
| B | A | C | D | _merge | |
|---|---|---|---|---|---|
| 0 | B1 | A1 | C1 | NaN | left_only |
| 1 | B2 | A2 | C2 | NaN | left_only |
| 2 | B3 | A3 | C3 | C3 | both |
| 3 | B4 | NaN | A4 | C4 | right_only |
| 4 | B5 | NaN | A5 | C5 | right_only |
基于index进行join
注意:即便是MultiIndex,也是可以进行join的,只要两张表有公共的索引部分即可
pd.merge(df1, df2, left_index=True, right_index=True)
| B_x | A | C_x | D | C_y | B_y | |
|---|---|---|---|---|---|---|
| 3 | B3 | A3 | C3 | C3 | C3 | B3 |
索引和列混合join
df2 = df2.reset_index()pd.merge(df1, df2, left_index=True, right_on='index')
注意事项:当在多个key上进行merge时,keys的数量要一致,keys的位置要相互对应
最后,对比concat和merge
* concat主要是基于某个轴上的索引进行拼接的* 而merge主要是进行横向的合并* 当运用concat函数时axis为1时,也可用相应的merge实现等价的操作,除了结果数据框的列名不同
数据透视与重塑
重塑 reshape
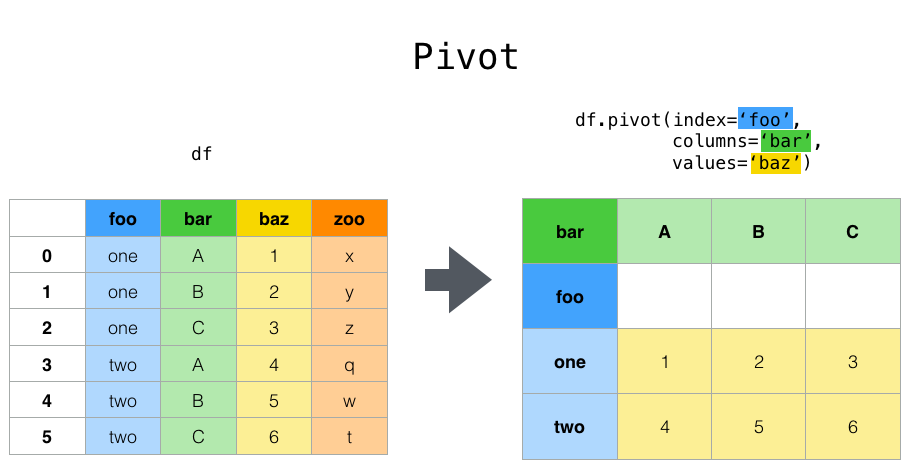
先写一下对pivot函数的理解,pivot函数仅仅是对数据框做了格式的转换,此时还没有汇总计算。
index参数,指定某一列数据进行去重,使之成为行标签。(每一行的标签)
columns参数,指定某一列数据进行去重,使之成为列标签。(每一列的标签)
values参数,指定其中某一列的值填充到新数据框,如果没有指定,则所有可能的值都会出现在新的数据框中,形成multiIndex
df = pd.DataFrame({'foo': ['one', 'one', 'two', 'two'],
                    'baz': ['A', 'B', 'C', 'B'],
                     'bar': [1, 2, 3, 4]})
df
| foo | baz | bar | |
|---|---|---|---|
| 0 | one | A | 1 |
| 1 | one | B | 2 |
| 2 | two | C | 3 |
| 3 | two | B | 4 |
df.pivot(index='foo', columns='baz', values='bar')
| baz | A | B | C |
|---|---|---|---|
| foo | |||
| one | 1.0 | 2.0 | NaN |
| two | NaN | 4.0 | 3.0 |
df = pd.DataFrame({'foo': ['one', 'one', 'one', 'two', 'two', 'two'],
                  'bar': ['A', 'B', 'C', 'A', 'B', 'C'],
                  'baz': [1, 2, 3, 4, 5, 6],
                  'zoo': ['x', 'y', 'z', 'q', 'w', 't']})
df
| foo | bar | baz | zoo | |
|---|---|---|---|---|
| 0 | one | A | 1 | x |
| 1 | one | B | 2 | y |
| 2 | one | C | 3 | z |
| 3 | two | A | 4 | q |
| 4 | two | B | 5 | w |
| 5 | two | C | 6 | t |
df.pivot(index='foo', columns='bar')
| baz | zoo | |||||
|---|---|---|---|---|---|---|
| bar | A | B | C | A | B | C |
| foo | ||||||
| one | 1 | 2 | 3 | x | y | z |
| two | 4 | 5 | 6 | q | w | t |
现在我们来模拟一份销售数据,有日期,有组别,有销量,然后来作一个pivot运算
from datetime import datetime, timedelta

today = datetime.now().date()

date = [today - timedelta(i) for i in range(5)] * 6

group = ['A'] * 5 + ['B'] * 5 + ['C'] * 5 + ['D'] * 5 + ['E'] * 5 + ['F'] * 5

sells = np.random.randint(1000, 100000, size=30)

data = {"date": date, "group": group, 'sells': sells}
df = pd.DataFrame({"date": date, "group": group, 'sells': sells})
df.head(10)
| date | group | sells | |
|---|---|---|---|
| 0 | 2019-09-30 | A | 48452 |
| 1 | 2019-09-29 | A | 38219 |
| 2 | 2019-09-28 | A | 44226 |
| 3 | 2019-09-27 | A | 35117 |
| 4 | 2019-09-26 | A | 33288 |
| 5 | 2019-09-30 | B | 5537 |
| 6 | 2019-09-29 | B | 5315 |
| 7 | 2019-09-28 | B | 9035 |
| 8 | 2019-09-27 | B | 76891 |
| 9 | 2019-09-26 | B | 45026 |
# df.pivot(index='group', columns='date', values='sells')

# 假设我们想按照日期进行查看
df.pivot(index='date', columns='group', values='sells')
| group | A | B | C | D | E | F |
|---|---|---|---|---|---|---|
| date | ||||||
| 2019-09-26 | 33288 | 45026 | 24553 | 16556 | 83922 | 55761 |
| 2019-09-27 | 35117 | 76891 | 75131 | 92268 | 46653 | 12062 |
| 2019-09-28 | 44226 | 9035 | 97750 | 99789 | 48696 | 56881 |
| 2019-09-29 | 38219 | 5315 | 49445 | 44874 | 36867 | 90270 |
| 2019-09-30 | 48452 | 5537 | 12272 | 25255 | 73326 | 20004 |
Note
pivot() will error with a ValueError: Index contains duplicate entries, cannot reshape if the index/column pair is not unique. In this case, consider using pivot_table() which is a generalization of pivot that can handle duplicate values for one index/column pair.
如果行标签与列标签不能唯一确定一个值,则会报错;此时应该使用pivot_table;在应用pivot时行标签和列标签对应的值不可以是重复的;这一点不同于Excel,它的数据透视可以直接做统计。看下面的小例子。
# 添加了重复值
df.loc[3, 'foo'] = 'one'
# 会报错
df.pivot(index='foo', columns='baz', values='bar')
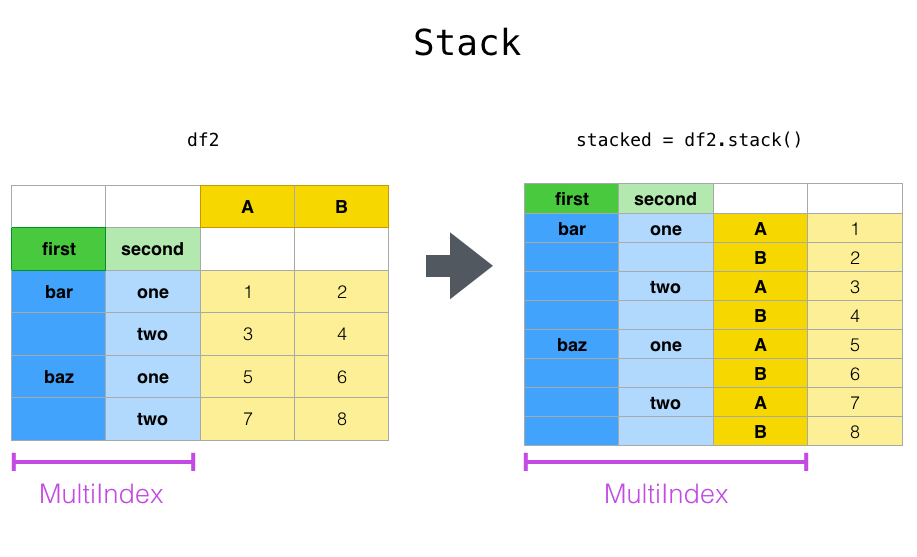
stack()与 unstack() 函数都是用于多重索引的
- stack():column转换成index
- unstack():index转换成column
关于stack函数的一点理解
- 栈,堆叠的意思
- 会把数据框中所有列的名字都传入到索引里
- 堆叠起来,展示数据
- 最后形成multiIndex
- 结果中共m * n行记录(其中m是原数据框中的行数,n是原数据框中的列数,在无重复列名的情况下)
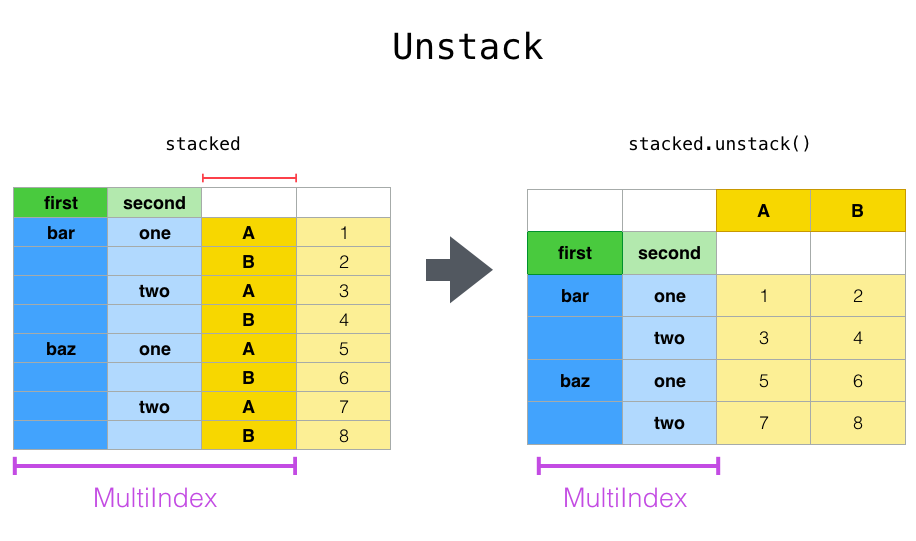
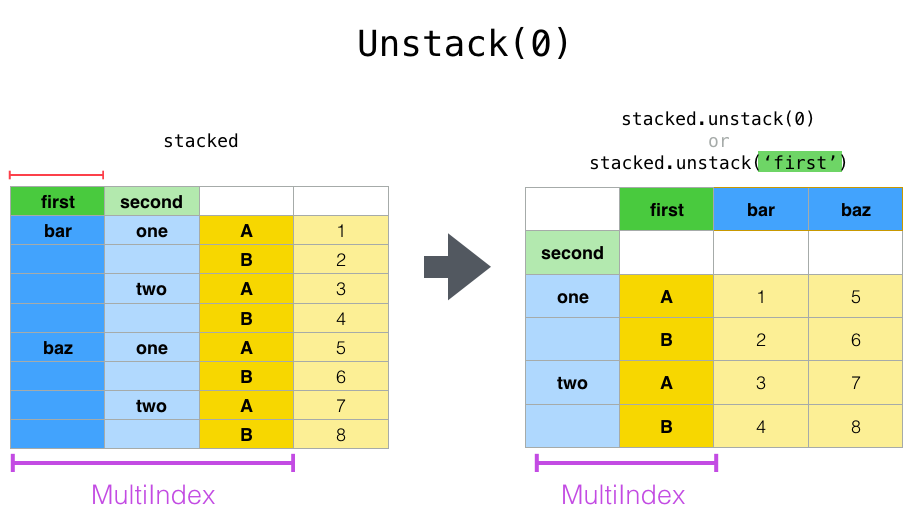
关于unstack函数的一点理解
- stack的逆操作;
- 默认是unstack最内层最里面的索引,即最后一个level
- 将该level索引里面的唯一值都作为列名
- 把后面的值按照对应关系填充到新的数据框内
- 其中multiIndex会减少一个level
和pd.melt操作作对比
- melt将一列或多列转化为一列来显示
- 而stack将所有不重复的列转化为索引来显示
- 其实melt能实现的操作通过stack也是可以实现的
和pivot_table作对比
- pivot_bale将某一列的唯一值转化为了行标签
- 而stack将所有不重复的列名转化为了行标签
tuples = list(zip(*[['bar', 'bar', 'baz', 'baz', 'foo', 'foo', 'qux', 'qux'],
         ['one', 'two', 'one', 'two', 'one', 'two', 'one', 'two']]))
index = pd.MultiIndex.from_tuples(tuples, names=['first', 'second'])
df_mul = pd.DataFrame(np.random.randn(8, 2), index=index, columns=['A', 'B'])
df_mul
| A | B | ||
|---|---|---|---|
| first | second | ||
| bar | one | 1.607880 | -0.364222 |
| two | 1.753577 | -2.514792 | |
| baz | one | 1.143161 | 0.685996 |
| two | -1.570172 | 0.333576 | |
| foo | one | 0.099722 | 0.923258 |
| two | -0.793577 | -2.215845 | |
| qux | one | -0.093891 | 1.003900 |
| two | 0.504794 | 1.563427 |
df_mul.stack()
执行(A, B两列的数据被堆叠了起来)
first  second
bar    one     A    0.442057
               B    0.757438
       two     A   -0.161969
               B   -0.028757
baz    one     A    0.211266
               B   -0.590143
       two     A   -0.175162
               B    0.517473
foo    one     A   -1.854350
               B   -0.975292
       two     A    1.297431
               B   -1.077260
qux    one     A   -1.348159
               B    1.318323
       two     A    1.131164
               B    1.410893
dtype: float64
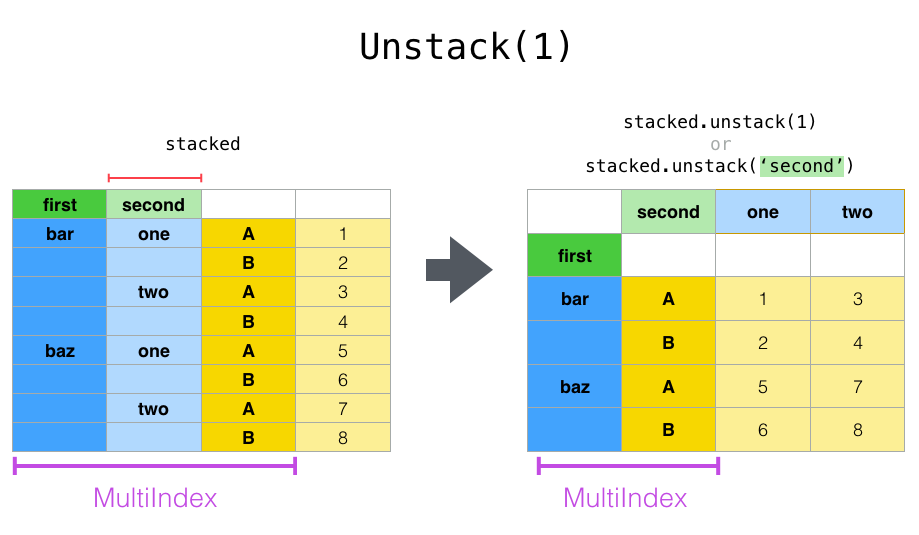
注意这个地方,level参数值不同所造成结果的不同
df1 = df_mul.stack()

df1.unstack(level=2)
执行
| A | B | ||
|---|---|---|---|
| first | second | ||
| bar | one | 0.442057 | 0.757438 |
| two | -0.161969 | -0.028757 | |
| baz | one | 0.211266 | -0.590143 |
| two | -0.175162 | 0.517473 | |
| foo | one | -1.854350 | -0.975292 |
| two | 1.297431 | -1.077260 | |
| qux | one | -1.348159 | 1.318323 |
| two | 1.131164 | 1.410893 |
# df1.unstack(level=0)

df1.unstack(level=1)
执行
| second | one | two | |
|---|---|---|---|
| first | |||
| bar | A | 0.442057 | -0.161969 |
| B | 0.757438 | -0.028757 | |
| baz | A | 0.211266 | -0.175162 |
| B | -0.590143 | 0.517473 | |
| foo | A | -1.854350 | 1.297431 |
| B | -0.975292 | -1.077260 | |
| qux | A | -1.348159 | 1.131164 |
| B | 1.318323 | 1.410893 |
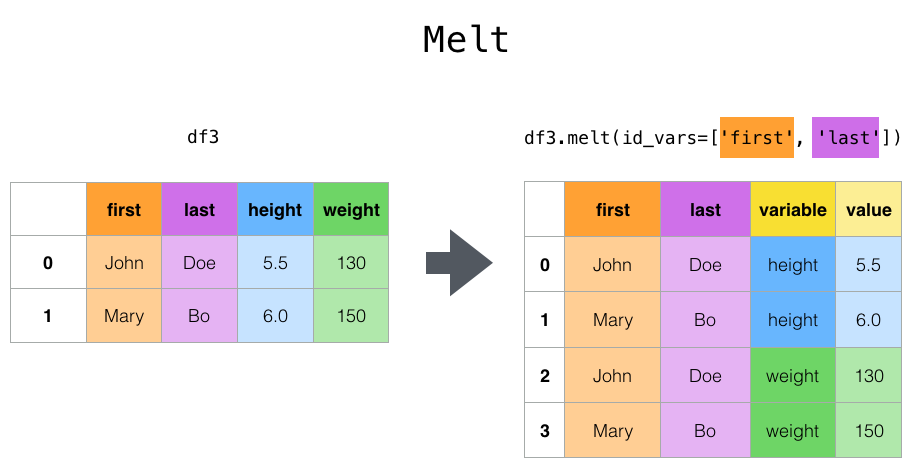
melt函数将数据框从wide format转化为long format;某些列设置为标记变量;其它的列设置为衡量变量;函数会自动生成两列: “variable” and “value”;我们也可以通过var
_name和value_name两个参数自定义列名。
df = pd.DataFrame({
                    'A': ['foo', 'foo', 'foo', 'bar', 'bar'],
                    'B': ['one', 'two', 'two', 'one', 'one'],
                    'C': ['s', 's', 'l', 'l', 's'],
                    'D': [1, 2, 2, 3, 4],
                    'E': [2, 4, 8, 16, 32]})
df
| A | B | C | D | E | |
|---|---|---|---|---|---|
| 0 | foo | one | s | 1 | 2 |
| 1 | foo | two | l | 2 | 4 |
| 2 | foo | two | l | 2 | 8 |
| 3 | bar | one | l | 3 | 16 |
| 4 | bar | one | s | 4 | 32 |
宽格式要转成长格式了!
df.melt(id_vars=['A', 'B'], value_vars=['C', 'D'], var_name='mear', value_name='val')
| A | B | mear | val | |
|---|---|---|---|---|
| 0 | foo | one | C | s |
| 1 | foo | two | C | l |
| 2 | foo | two | C | l |
| 3 | bar | one | C | l |
| 4 | bar | one | C | s |
| 5 | foo | one | D | 1 |
| 6 | foo | two | D | 2 |
| 7 | foo | two | D | 2 |
| 8 | bar | one | D | 3 |
| 9 | bar | one | D | 4 |
下面的这几行代码通过重置索引和stack的方式,实现了和上面一行代码同样的效果
df1 = df.loc[:,'A':'D']
df1 = df1.set_index(['A', 'B'])
df1 = df1.stack()
df1= df1.reset_index()
df1.rename(columns={'level_2': 'mear', 0: 'val'})
透视表 pivot table
pivot_table 提供了类似于EXCEL数据透视表的功能,重点的参数如下:
- data: A DataFrame object
- values: a column or a list of columns to aggregate
- index: a column, Grouper, array which has the same length as data, or list of them. Keys to group by on the pivot table index. If an array is passed, it is being used as the same manner as column values.
- columns: a column, Grouper, array which has the same length as data, or list of them. Keys to group by on the pivot table column. If an array is passed, it is being used as the same manner as column values.
- aggfunc: function to use for aggregation, defaulting to numpy.mean
crosstab 用于计算两个以上的因子的cross-tabulation. 默认的是计算因子之间的频率,除非指定了其它数组或者函数进行计算
- index: array-like, values to group by in the rows
- columns: array-like, values to group by in the columns
- values: array-like, optional, array of values to aggregate according to the factors
- aggfunc: function, optional, If no values array is passed, computes a frequency table
- rownames: sequence, default None, must match number of row arrays passed
- colnames: sequence, default None, if passed, must match number of column arrays passed
- margins: boolean, default False, Add row/column margins (subtotals)
- normalize: boolean, {‘all’, ‘index’, ‘columns’}, or {0,1}, default False. Normalize by dividing all values by the sum of values.
df.pivot_table函数,用来办pivot函数办不了的事儿,主要是用来汇总的。
values参数,要聚集(统计)的列
index参数,该列的值去重后充当行标签
columns参数,该列的值去重后充当列标签
aggfunc参数,可以使字符串,list或字典
df
| A | B | C | D | E | |
|---|---|---|---|---|---|
| 0 | foo | one | s | 1 | 2 |
| 1 | foo | two | s | 2 | 4 |
| 2 | foo | two | l | 2 | 8 |
| 3 | bar | one | l | 3 | 16 |
| 4 | bar | one | s | 4 | 32 |
df.pivot_table(values='D', index='A', columns='B', aggfunc=[np.sum, np.mean])
| sum | mean | |||
|---|---|---|---|---|
| B | one | two | one | two |
| A | ||||
| bar | 7.0 | NaN | 3.5 | NaN |
| foo | 1.0 | 4.0 | 1.0 | 2.0 |
df.pivot_table(values=['D', 'E'], index=['A', 'B'], columns='C', aggfunc=np.sum, fill_value=0)
| D | E | ||||
|---|---|---|---|---|---|
| C | l | s | l | s | |
| A | B | ||||
| bar | one | 3 | 4 | 16 | 32 |
| foo | one | 0 | 1 | 0 | 2 |
| two | 2 | 2 | 8 | 4 |
df.loc[1, 'C'] = 'l'
df
| A | B | C | D | E | |
|---|---|---|---|---|---|
| 0 | foo | one | s | 1 | 2 |
| 1 | foo | two | l | 2 | 4 |
| 2 | foo | two | l | 2 | 8 |
| 3 | bar | one | l | 3 | 16 |
| 4 | bar | one | s | 4 | 32 |
不同的列应用不同的聚集函数
df.pivot_table(values=['D', 'E'], index=['A', 'B'], columns='C', aggfunc={'D': np.sum, 'E': np.mean}, fill_value=0)
| D | E | ||||
|---|---|---|---|---|---|
| C | l | s | l | s | |
| A | B | ||||
| bar | one | 3 | 4 | 16 | 32 |
| foo | one | 0 | 1 | 0 | 2 |
| two | 4 | 0 | 6 | 0 |
一键数据分析
注意 该工具包存在BUG,不能确保所有电脑的jupyter都能安装上!!!
https://github.com/pandas-profiling/pandas-profiling
安装命令:pip install pandas-profiling
import pandas_profiling

df.profile_report(style={'full_width':True})

若有收获,就点个赞吧
0 人点赞
