文档作者:Armor
资料参考:http://www.openkg.cn/dataset/2020
简介
构造知识图谱是一个复杂的系统工程。其构造和实现方法并不唯一,尚未存在固定的范式。
在算法上不考虑知识图谱的实体抽取、关系抽取、知识消融和嵌入算法。
在数据上不考虑非结构化数据,仅通过百度百科爬取半结构化的数据进行数据源获取。
所以本Demo是假设在已具备数据质量优良的前提下,把数据从Neo4j或其他的图数据库中释放出来,进行web端的可视化展示,并据此开发一些基本功能或下游任务。
参考openKG的开源项目,进行一定程度的修改和适配。
目的有二:
- 一是作为CQUSTKG的小型的知识图谱展示Demo
- 二是提供一个简单的知识图谱可视化开发流程
1.数据获取和清洗
- 从政府公开信息获得 全国普通高等学校名单 文件获取点我
- 截至2020年6月30日,全国高等学校共计3005所,其中:普通高等学校2740所,含本科院校1258所、高职(专科)院校1482所;
1.1 清洗高校名单数据
- 在清洗之前,先打开excel文件删除头两行,再用python代码进行清洗 ```python import numpy as np import pandas as pd
用pandas 打开
df = pd.read_excel(“全国高等学校名单.xls”)
先把备注中所有的Nan全部替换为公办
df[“备注”].fillna(“公办”,inplace=True)
删除含Nan的空行
df.dropna(axis=0,inplace=True)
学校表示码转换数据类型 成int64
df[“学校标识码”] = df[“学校标识码”].astype(np.int64)
保存文件
df.to_csv(“School_List_2020.csv”,index=False)
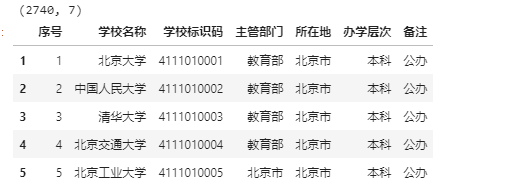
看看长啥样
print(df.shape) df.head()
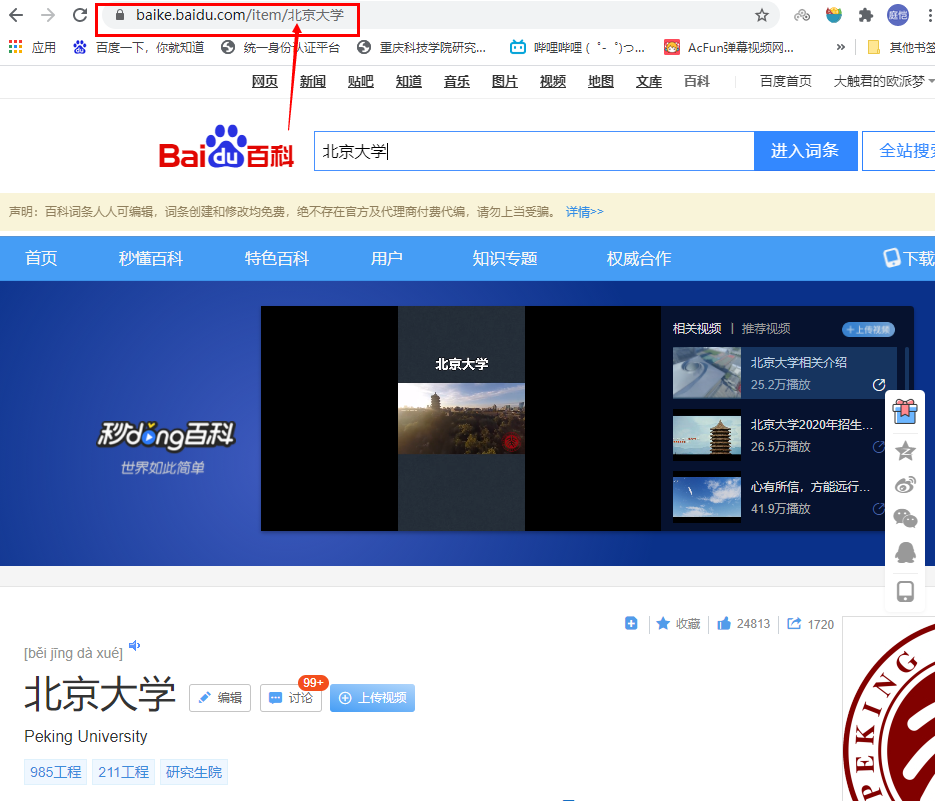
<br />🚀OK!得到一个干净的csv文件,接下来进行爬虫。<a name="E6mWb"></a>## 1.2 爬虫获取json数据可以看到高校的百度百科的构成是 `https://baike.baidu.com/item/` + `"高校名称"` <br />所以爬虫遍历的urls链接可以用上面的csv文件来构造:```pythondf = pd.read_csv("School_List_2020.csv")urls = []for i in df["学校名称"]:url = "https://baike.baidu.com/item/" + str(i)urls.append(url)

报错缺什么自己pip ,爬虫完整代码:
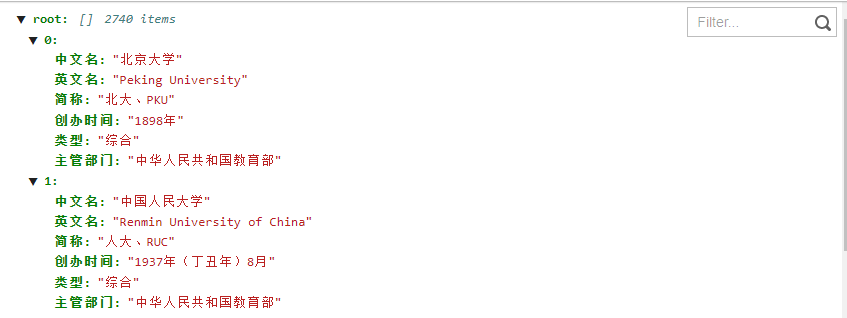
import requestsimport jsonimport timefrom tqdm import tqdmimport numpy as npimport pandas as pdfrom bs4 import BeautifulSoup# 计时def run_time(start_time):current_time = time.strftime("%Y-%m-%d %H:%M:%S",time.localtime())print(f"当前时间:{current_time}")print("耗时:%.3f sec" %(time.time()-start_time))# get url 并获取网页内容def url_open(url):headers = {'User-Agent':'Mozilla/5.0 (Windows NT 10.0; WOW64) AppleWebKit/537.36 (KHTML, like Gecko) Chrome/69.0.3497.100 Safari/537.36'}r = requests.get(url, headers = headers)return r# get the school listdef school_list(filename):schools = []df = pd.read_csv(filename)for i in df["学校名称"]:schools.append(i)return schoolsif __name__ == "__main__":school = school_list("School_List_2020.csv")# print(school)result_data = []start_time = time.time()for index in tqdm(school):url = 'https://baike.baidu.com/item/' + indexprint(url)data = url_open(url)soup = BeautifulSoup(data.content, 'html.parser', from_encoding='utf-8')name_data = []value_data = []name_node = soup.find_all('dt', class_='basicInfo-item name')# print(name_node)for i in range(len(name_node)):name_data.append(name_node[i].get_text().replace('\xa0', ''))# name_data.append(name_node[i].get_text())# print(name_data)value_node = soup.find_all('dd', class_='basicInfo-item value')for i in range(len(value_node)):value_data.append(value_node[i].get_text().replace('\n', ''))# print(type(value_node[i].get_text().replace('\n', '')))# print(value_node[i].get_text().replace('\n', ''))# print(value_data)# print(type(value_data))result = {'中文名': '无信息', '英文名': '无信息', '简称':'无信息','创办时间': '无信息', '类型': '综合', '主管部门': '无信息'}for i in range(len(name_data)):if name_data[i] == '中文名':result['中文名'] = value_data[i]if name_data[i] in ['英文名','外文名']:result['英文名'] = value_data[i]if name_data[i] == '简称':result['简称'] = value_data[i]if name_data[i] == '创办时间':result['创办时间'] = value_data[i]if name_data[i] == '类型':result['类型'] = value_data[i]if name_data[i] == '主管部门':result['主管部门'] = value_data[i]result_data.append({'中文名': result['中文名'], '英文名': result['英文名'], '简称': result['简称'], '创办时间': result['创办时间'], '类型': result['类型'], '主管部门': result['主管部门']})# print('reading the website...')# print(result_data)fw = open('all.json', 'w', encoding='utf-8')fw.write(json.dumps(result_data, ensure_ascii=False))fw.close()print('complete!')run_time(start_time)

- 预计等候15分钟左右
1.3 json数据清洗
- json数据清洗分为两步骤:特征提取、linknode构造。
- 特征提取:主要是把节点属性提取为一个一个的txt文本,方便后续构造node-link-node的三元组形式。 ```python import json
with open(‘./spider/all.json’, ‘r’, encoding=’utf-8’) as fr: str_data = fr.read() full_data = json.loads(str_data) # json 解码 fw1 = open(‘./dataprocess/Name.txt’, ‘w’, encoding=’utf-8’) # 名称list fw2 = open(‘./dataprocess/English.txt’, ‘w’, encoding=’utf-8’) # 英文名list fw3 = open(‘./dataprocess/Abbr.txt’, ‘w’, encoding=’utf-8’) # 简称list fw4 = open(‘./dataprocess/Time.txt’, ‘w’, encoding=’utf-8’) # 创办时间list fw5 = open(‘./dataprocess/Type.txt’, ‘w’, encoding=’utf-8’) # 类型list fw6 = open(‘./dataprocess/Admin.txt’, ‘w’, encoding=’utf-8’) # 主管部门list
for i in range(len(full_data)):# 傻瓜式遍历for key, value in full_data[i].items():if key == '中文名':fw1.write("{'中文名': '" + value +"'}\n")if key == '英文名':fw2.write("{'英文名': '" + value +"'}\n")if key == '简称':fw3.write("{'简称': '" + value +"'}\n")if key == '创办时间':# fw4.write("{'创办时间': '" + value[0:4] +"年'}\n")fw4.write("{'创办时间': '" + value +"'}\n")if key == '类型':fw5.write("{'类型': '" + value +"'}\n")if key == '主管部门':fw6.write("{'主管部门': '" + value +"'}\n")
fw1.close() fw2.close() fw3.close() fw4.close() fw5.close() fw6.close()
- linknode构造```pythonimport jsonimport csvnodes = []links = []name_list = []english_list = []abbr_list = []time_list = []type_list = []admin_list = []# english2_list = []# time2_list = []# abbr2_list = []# central nodenodes.append({'id': '大学', 'class': 'university', 'group': 0, 'size': 22})# type nodefr = open('./dataprocess/Type.txt', 'r', encoding='utf-8')for line in fr.readlines():tmp = line.strip('\n')for key, value in eval(tmp).items():if value not in type_list:type_list.append(value)nodes.append({'id': value, 'class': 'type', 'group': 5, 'size': 18})links.append({'source': '大学', 'target': value, 'value': 3})links.append({'source': value, 'target': '大学', 'value': 3})fr.close()# english nodefr = open('./dataprocess/English.txt', 'r', encoding='utf-8')for line in fr.readlines():tmp = line.strip('\n')for key, value in eval(tmp).items():if value not in english_list:english_list.append(value)nodes.append({'id': value, 'class': 'english', 'group': 2, 'size': 15})fr.close()# abbr nodefr = open('./dataprocess/Abbr.txt', 'r', encoding='utf-8')for line in fr.readlines():tmp = line.strip('\n')for key, value in eval(tmp).items():if value not in abbr_list:abbr_list.append(value)nodes.append({'id': value, 'class': 'abbr', 'group': 3, 'size': 15})fr.close()# time nodefr = open('./dataprocess/Time.txt', 'r', encoding='utf-8')for line in fr.readlines():tmp = line.strip('\n')for key, value in eval(tmp).items():if value not in time_list:time_list.append(value)nodes.append({'id': value, 'class': 'time', 'group': 4, 'size': 11})fr.close()# admin nodefr = open('./dataprocess/Admin.txt', 'r', encoding='utf-8')for line in fr.readlines():tmp = line.strip('\n')for key, value in eval(tmp).items():if value not in admin_list:admin_list.append(value)nodes.append({'id': value, 'class': 'admin', 'group': 6, 'size': 11})fr.close()# # english2 node# fr = open('./dataprocess/English.txt', 'r', encoding='utf-8')# for line in fr.readlines():# tmp = line.strip('\n')# for key, value in eval(tmp).items():# if value not in english2_list:# english2_list.append(value)# nodes.append({'id': value, 'class': 'english2', 'group': 7, 'size': 13})# fr.close()# # abbr2 node# fr = open('./dataprocess/Abbr.txt', 'r', encoding='utf-8')# for line in fr.readlines():# tmp = line.strip('\n')# for key, value in eval(tmp).items():# if value not in abbr2_list:# abbr2_list.append(value)# nodes.append({'id': value, 'class': 'abbr2', 'group': 8, 'size': 13})# fr.close()# # time2 node# fr = open('./dataprocess/Time.txt', 'r', encoding='utf-8')# for line in fr.readlines():# tmp = line.strip('\n')# for key, value in eval(tmp).items():# if value not in time2_list:# time2_list.append(value)# nodes.append({'id': value, 'class': 'time2', 'group': 9, 'size': 13})# fr.close()with open('./spider/all.json', 'r', encoding='utf-8') as fr:str_data = fr.read()full_data = json.loads(str_data)for i in range(len(full_data)):# for key, value in full_data[i].items():# name nodenodes.append({'id': full_data[i]['中文名'], 'class': 'names', 'group': 1, 'size': 20})links.append({'source': full_data[i]['类型'], 'target': full_data[i]['中文名'], 'value': 3})links.append({'source': full_data[i]['中文名'], 'target': full_data[i]['类型'], 'value': 3})# english nodelinks.append({'source': full_data[i]['中文名'], 'target': full_data[i]['英文名'], 'value': 3})links.append({'source': full_data[i]['英文名'], 'target': full_data[i]['中文名'], 'value': 3})# abbr nodelinks.append({'source': full_data[i]['中文名'], 'target': full_data[i]['简称'], 'value': 3})links.append({'source': full_data[i]['简称'], 'target': full_data[i]['中文名'], 'value': 3})# time nodelinks.append({'source': full_data[i]['简称'], 'target': full_data[i]['创办时间'], 'value': 3})links.append({'source': full_data[i]['创办时间'], 'target': full_data[i]['简称'], 'value': 3})# admin nodelinks.append({'source': full_data[i]['简称'], 'target': full_data[i]['主管部门'], 'value': 3})links.append({'source': full_data[i]['主管部门'], 'target': full_data[i]['简称'], 'value': 3})fw = open('./nodes.json', 'w', encoding='utf-8')fw.write(json.dumps({'nodes': nodes, 'links': links}, ensure_ascii=False))fw.close()
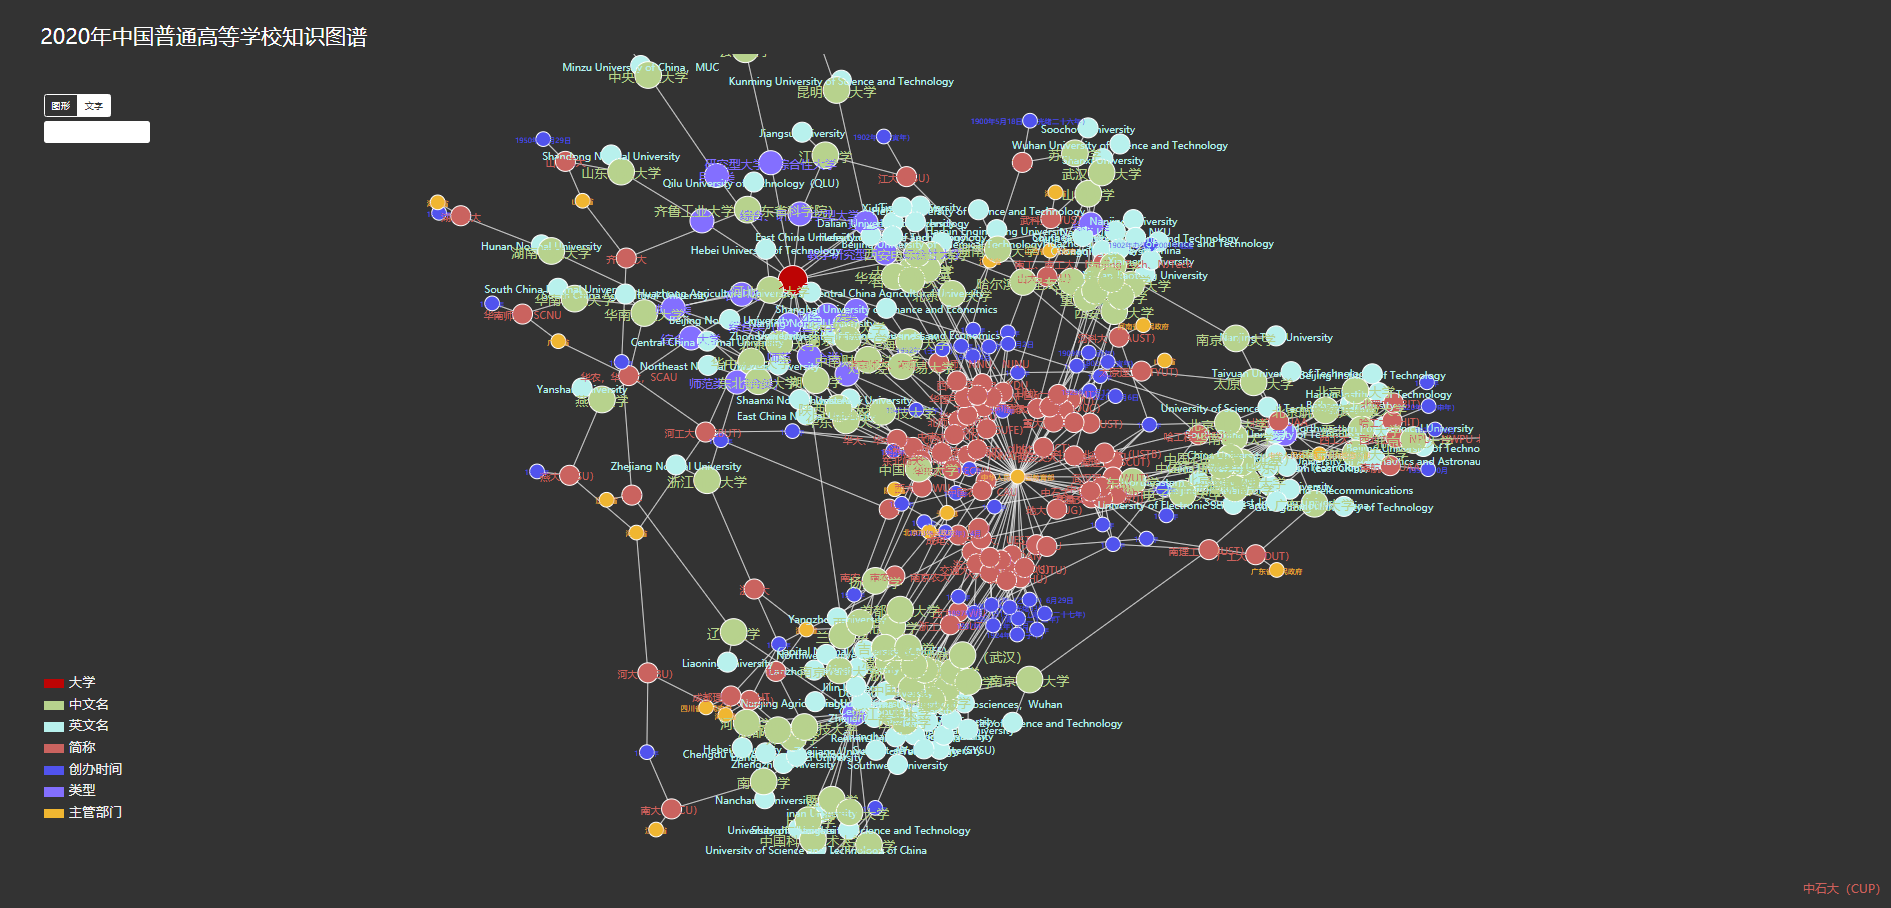
经过一系列处理得到了含node和link信息的 nodes.json 接下来我们通过D3.js进行图谱可视化生成。
2.生成图谱
图谱生成可以用Echarts或者D3.js,Echarts简单易上手但定制不够灵活,D3.js灵活可定制但难上手。根据参考资料,先用D3.js实现整体图谱的展示,并做适当修改美化。

<!DOCTYPE html><html><head><meta charset="UTF-8"/><meta http-equiv="X-UA-Compatible" content="IE=edge"><meta name="viewport" content="width=device-width, initial-scale=1"><title>2020年中国普通高等学校图谱可视化</title><meta name="description" content=""/><meta name="keywords" content=""/><meta name="author" content=""/><link rel="shortcut icon" href=""><script src="http://cdn.bootcss.com/jquery/2.1.4/jquery.min.js"></script><link href="http://cdn.bootcss.com/bootstrap/3.3.4/css/bootstrap.min.css" rel="stylesheet"><script src="http://cdn.bootcss.com/bootstrap/3.3.4/js/bootstrap.min.js"></script><script src="https://cdn.staticfile.org/echarts/4.3.0/echarts.min.js"></script></head><style>body {background-color: #333333;padding: 30px 40px;text-align: center;font-family: OpenSans-Light, PingFang SC, Hiragino Sans GB, Microsoft Yahei, Microsoft Jhenghei, sans-serif;}.links line {stroke: rgb(240, 240, 240);stroke-opacity: 0.8;}.links line.inactive {/*display: none !important;*/stroke-opacity: 0;}.nodes circle {stroke: #fff;stroke-width: 1.5px;}.nodes circle:hover {cursor: pointer;}.nodes circle.inactive {display: none !important;}.texts text {display: none;}.texts text:hover {cursor: pointer;}.texts text.inactive {display: none !important;}#indicator {position: absolute;left: 45px;bottom: 50px;text-align: left;color: #f2f2f2;font-size: 20px;}#indicator > div {margin-bottom: 4px;}#indicator span {display: inline-block;width: 30px;height: 14px;position: relative;top: 2px;margin-right: 8px;}#mode {position: absolute;top: 60px;left: 45px;}#mode span {display: inline-block;border: 1px solid #fff;color: #fff;padding: 6px 10px;border-radius: 4px;font-size: 14px;transition: color, background-color .3s;-o-transition: color, background-color .3s;-ms-transition: color, background-color .3s;-moz-transition: color, background-color .3s;-webkit-transition: color, background-color .3s;}#mode span.active, #mode span:hover {background-color: #fff;color: #333;cursor: pointer;}#info {position: absolute;bottom: 40px;right: 30px;text-align: right;width: 270px;}#info p {color: #fff;font-size: 12px;margin-bottom: 5px;margin-top: 0px;}#info p span {color: #888;margin-right: 10px;}#search input {position: absolute;top: 100px;left: 45px;color: #000;border: none;outline: none;box-shadow: none;width: 160px;background-color: #FFF;}#svg2 g.row:hover {stroke-width: 1px;stroke: #fff;}</style><body><h1 style="color: #fff;font-size: 32px;text-align: left;margin-left:40px;">2020年中国普通高等学校知识图谱</h1><div style="text-align: center;position: relative;"><svg width="1600" height="1200" style="margin-left: 0px;margin-bottom: 0px;" id="svg1"></svg><div id="indicator"></div><div id="mode"><span class="active" style="border-top-right-radius: 0;border-bottom-right-radius: 0; ">图形</span><span style="border-top-left-radius: 0;border-bottom-left-radius: 0; position: relative;left: -5px;">文字</span></div><div id="search"><input type="text" class="form-control"></div></div><div style="text-align: center;position: relative;"></div><div id="info"><h4></h4></div><!-- <div id="main" style="width: 600px;height:400px;"></div> --></body><script src="https://d3js.org/d3.v4.min.js"></script><script>$(document).ready(function () {var svg = d3.select("#svg1"), width = svg.attr('width'), height = svg.attr('height');var names = ['大学', '中文名','英文名','简称','创办时间','类型','主管部门'];var colors = ['#bd0404','#b7d28d', '#b8f1ed', '#ca635f', '#5153ee','#836FFF', '#f0b631'];// 图注for (var i = 0; i < names.length; i++) {$('#indicator').append("<div><span style='background-color: " + colors[i] + "'></span>" + names[i] + "</div>");}// 相互作用力,定义鼠标拖拽时的效果var simulation = d3.forceSimulation()//速度衰减因子,相当于摩擦力,0是无摩擦,1是冻结.velocityDecay(0.6)// α衰变,借用粒子的放射性的概念,指力的模拟经过一定次数后会逐渐停止;// 数值范围也是0-1,如果设为1,经过300次迭代后,模拟就会停止;这里我们设为0,会一直进行模拟。.alphaDecay(0)//连线间的斥力.force("link", d3.forceLink().id(function (d) {return d.id;}))//斥力.force("charge", d3.forceManyBody())//中心力.force("center", d3.forceCenter(width / 2, height / 2));//导图设置var graph;d3.json("nodes.json", function (error, data) {if (error) throw error;graph = data;console.log(graph);var link = svg.append("g").attr("class", "links").selectAll("line").data(graph.links).enter().append("line").attr("stroke-width", function (d) {return 1;});var node = svg.append("g").attr("class", "nodes").selectAll("circle").data(graph.nodes).enter().append('circle').attr('r', function (d) {return d.size;}).attr("fill", function (d) {return colors[d.group];}).attr("stroke", "none").attr("name", function (d) {return d.id;}).call(d3.drag().on("start", dragstarted).on("drag", dragged).on("end", dragended));var text =svg.append("g").attr("class", "texts").selectAll("text").data(graph.nodes).enter().append('text').attr("font-size", function (d) {return d.size;}).attr("fill", function (d) {return colors[d.group];}).attr("name", function (d) {return d.id;}).text(function (d) {return d.id;}).attr("text-anchor", 'middle').call(d3.drag().on("start", dragstarted).on("drag", dragged).on("end", dragended));var data = svg.append("g").attr("class", "datas").selectAll("text").data(graph.nodes).enter();node.append("title").text(function (d) {return d.id;});print = node.append("title").text(function (d) {return d.id;});print.enter().append("text").style("text-anchor", "middle").text(function (d) {return d.name;});simulation.nodes(graph.nodes).on("tick", ticked);simulation.force("link").links(graph.links);//tick函数的作用:由于力导向图是不断运动的,每一时刻都在发生更新,因此,必须不断更新节点和连线的位置。//迭代力项导图位置function ticked() {link.attr("x1", function (d) {return d.source.x;}).attr("y1", function (d) {return d.source.y;}).attr("x2", function (d) {return d.target.x;}).attr("y2", function (d) {return d.target.y;});node.attr("cx", function (d) {return d.x;}).attr("cy", function (d) {return d.y;});text.attr('transform', function (d) {return 'translate(' + d.x + ',' + (d.y + d.size / 2) + ')';});}});//激活导图函数var dragging = false;// 起始位置function dragstarted(d) {if (!d3.event.active) simulation.alphaTarget(0.6).restart();d.fx = d.x;d.fy = d.y;dragging = true;}// 画图function dragged(d) {d.fx = d3.event.x;d.fy = d3.event.y;}// 结束位置 alphaTarget也代表衰减因子,如果设置为1迭代位置后定死位置function dragended(d) {if (!d3.event.active) simulation.alphaTarget(0);d.fx = null;d.fy = null;dragging = false;}// 图像/文字 按钮$('#mode span').click(function (event) {$('#mode span').removeClass('active');$(this).addClass('active');if ($(this).text() == '图形') {$('.texts text').hide();$('.nodes circle').show();}else {$('.texts text').show();$('.nodes circle').show();}});$('#svg1').on('mouseenter', '.nodes circle', function (event) {if (!dragging) {var name = $(this).attr('name');$('#info h4').css('color', $(this).attr('fill')).text(name);$('#info p').remove();console.log(info[name]);for (var key in info[name]) {if (typeof(info[name][key]) == 'object') {continue;}if (key == 'url' || key == 'title' || key == 'name' || key == 'edited' || key == 'created' || key == 'homeworld') {continue;}$('#info').append('<p><span>' + key + '</span>' + info[name][key] + '</p>');}d3.select("#svg1 .nodes").selectAll('circle').attr('class', function (d) {if (d.id == name) {return '';}for (var i = 0; i < graph.links.length; i++) {if (graph.links[i]['source'].id == name && graph.links[i]['target'].id == d.id) {return '';}if (graph.links[i]['target'].id == name && graph.links[i]['source'].id == d.id) {return '';}}return 'inactive';});d3.select("#svg1 .links").selectAll('line').attr('class', function (d) {if (d.source.id == name || d.target.id == name) {return '';} else {return 'inactive';}});}});$('#svg1').on('mouseleave', '.nodes circle', function (event) {if (!dragging) {d3.select('#svg1 .nodes').selectAll('circle').attr('class', '');d3.select('#svg1 .links').selectAll('line').attr('class', '');}});$('#svg1').on('mouseenter', '.texts text', function (event) {if (!dragging) {var name = $(this).attr('name');$('#info h4').css('color', $(this).attr('fill')).text(name);$('#info p').remove();for (var key in info[name]) {if (typeof(info[name][key]) == 'object') {continue;}if (key == 'url' || key == 'title' || key == 'name' || key == 'edited' || key == 'created' || key == 'homeworld') {continue;}$('#info').append('<p><span>' + key + '</span>' + info[name][key] + '</p>');}d3.select('#svg1 .texts').selectAll('text').attr('class', function (d) {if (d.id == name) {return '';}for (var i = 0; i < graph.links.length; i++) {if (graph.links[i]['source'].id == name && graph.links[i]['target'].id == d.id) {return '';}if (graph.links[i]['target'].id == name && graph.links[i]['source'].id == d.id) {return '';}}return 'inactive';});d3.select("#svg1 .links").selectAll('line').attr('class', function (d) {if (d.source.id == name || d.target.id == name) {return '';} else {return 'inactive';}});}});$('#svg1').on('mouseleave', '.texts text', function (event) {if (!dragging) {d3.select('#svg1 .texts').selectAll('text').attr('class', '');d3.select('#svg1 .links').selectAll('line').attr('class', '');}});$('#search input').keyup(function (event) {if ($(this).val() == '') {d3.select('#svg1 .texts').selectAll('text').attr('class', '');d3.select('#svg1 .nodes').selectAll('circle').attr('class', '');d3.select('#svg1 .links').selectAll('line').attr('class', '');}else {var name = $(this).val();d3.select('#svg1 .nodes').selectAll('circle').attr('class', function (d) {if (d.id.toLowerCase().indexOf(name.toLowerCase()) >= 0) {return '';} else {return 'inactive';}});d3.select('#svg1 .texts').selectAll('text').attr('class', function (d) {if (d.id.toLowerCase().indexOf(name.toLowerCase()) >= 0) {return '';} else {return 'inactive';}});d3.select("#svg1 .links").selectAll('line').attr('class', function (d) {return 'inactive';});}});var info;d3.json("all.json", function (error, data) {info = data;});});</script></html>
3.本地部署
当前目录下的结构如下图:
all.json│ creatNodeLink.ipynb│ getFeature.ipynb│ index.html│ nodes.json│ School_list_2020.csv│ Spider_school.ipynb│ 全国高等学校名单.xls│└─dataprocessAbbr.txtAdmin.txtEnglish.txtName.txtTime.txtType.txt
- 移动到当前index.html目录下,在目录下进入cmd命令,输入以下代码,快速假设本地服务器。
- python3一行代码搞定服务器
打开浏览器python -m http.server 8000
http://localhost:8000/,查看自己的图谱吧
Demo预览:http://yzy616.xyz/
接下来,不管是增加下游任务,或是添加事务功能。
不管怎么说,先做增删改查,对于图数据库的内容还不是很熟悉,后续会由实验室的老武同学完善Neo4j相关协助开发。4.下游任务
待开发


